| Param | Original file | Final file |
|---|---|---|
| Filename | modeM0/AS1A04_171T01_9000001634_11193cztM0_level2.evt | modeM0/AS1A04_171T01_9000001634_11193cztM0_level2_quad_clean.evt |
| Size (bytes) | 647,706,240 | 74,626,560 |
| Size | 617.7 MB | 71.2 MB |
| Events in quadrant A | 5,620,926 | 427,046 |
| Events in quadrant B | 4,740,516 | 439,743 |
| Events in quadrant C | 3,617,441 | 444,945 |
| Events in quadrant D | 5,117,113 | 414,089 |
| Mode SS | |||
|---|---|---|---|
| Quadrant | BADHDUFLAG | Total packets | Discarded packets |
| A | 0 | 156 | 4 |
| B | 0 | 156 | 0 |
| C | 0 | 156 | 2 |
| D | 0 | 156 | 2 |
| Mode M0 | |||
|---|---|---|---|
| Quadrant | BADHDUFLAG | Total packets | Discarded packets |
| A | 0 | 22169 | 390 |
| B | 0 | 19536 | 392 |
| C | 0 | 16563 | 335 |
| D | 0 | 21012 | 758 |
| Quadrant | Total seconds | Saturated seconds | Saturation percentage |
|---|---|---|---|
| A | 7673 | 660 | 8.601590% |
| B | 7670 | 522 | 6.805737% |
| C | 7684 | 278 | 3.617907% |
| D | 7645 | 585 | 7.652060% |
Noise dominated data is calculated using 1-second bins in cleaned event files. If a bin has >2000 counts, and if more than 50% of those come from <1% of pixels, then it is considered to be noise-dominated and hence unusable.
| Quadrant | # 1 sec bins | Bins with >0 counts | Bins with >2000 counts | High rate bins dominated by noise | Noise dominated (total time) | Noise dominated (detector-on time) | Marked lightcurve |
|---|---|---|---|---|---|---|---|
| A | 7757 | 7715 | 233 | 233 | 3.00% | 3.02% | 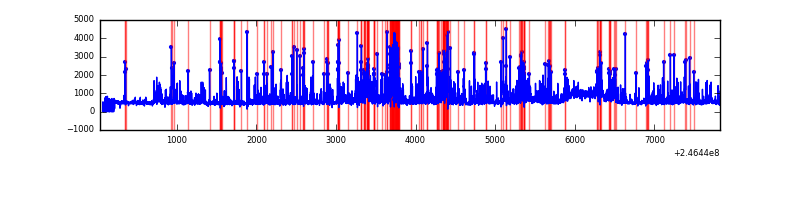 |
| B | 7764 | 7711 | 166 | 166 | 2.14% | 2.15% | 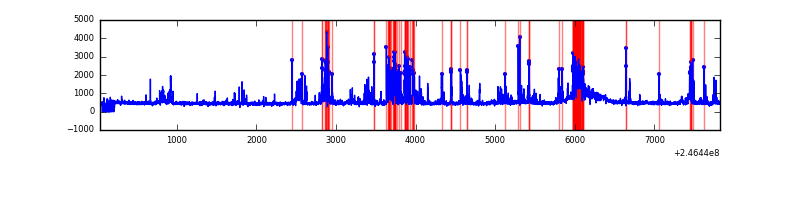 |
| C | 7792 | 7722 | 0 | 0 | 0.00% | 0.00% | 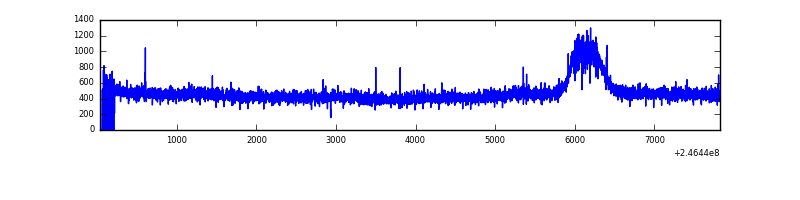 |
| D | 7752 | 7672 | 199 | 199 | 2.57% | 2.59% | 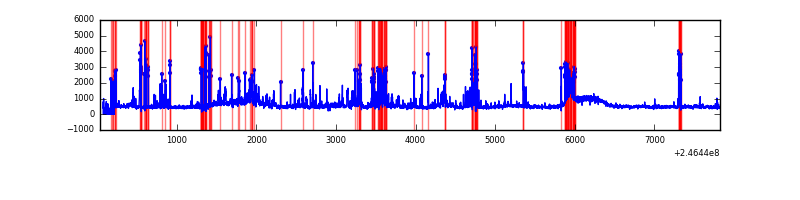 |
Top three noisy pixels from each quadrant. If the there are fewer than three noisy pixels in the level2.evt file, extra rows are filled as -1
| Pixel properties | Quadrant properties | ||||||
|---|---|---|---|---|---|---|---|
| Quadrant | DetID | PixID | Counts | Sigma | Mean | Median | Sigma |
| A | 8 | 5 | 1961790 | 10359.47 | 911 | 888 | 189.3 |
| A | 8 | 15 | 126911 | 665.78 | 911 | 888 | 189.3 |
| A | 14 | 63 | 12008 | 58.75 | 911 | 888 | 189.3 |
| B | 4 | 239 | 757788 | 4281.59 | 906 | 882 | 176.8 |
| B | 10 | 16 | 229603 | 1293.81 | 906 | 882 | 176.8 |
| B | 4 | 80 | 74248 | 415.01 | 906 | 882 | 176.8 |
| C | 8 | 128 | 15678 | 68.13 | 919 | 920 | 216.6 |
| C | 8 | 112 | 8211 | 33.66 | 919 | 920 | 216.6 |
| C | 14 | 234 | 7252 | 29.23 | 919 | 920 | 216.6 |
| D | 2 | 14 | 460098 | 2118.46 | 888 | 862 | 216.8 |
| D | 1 | 52 | 363236 | 1671.63 | 888 | 862 | 216.8 |
| D | 10 | 253 | 348177 | 1602.16 | 888 | 862 | 216.8 |
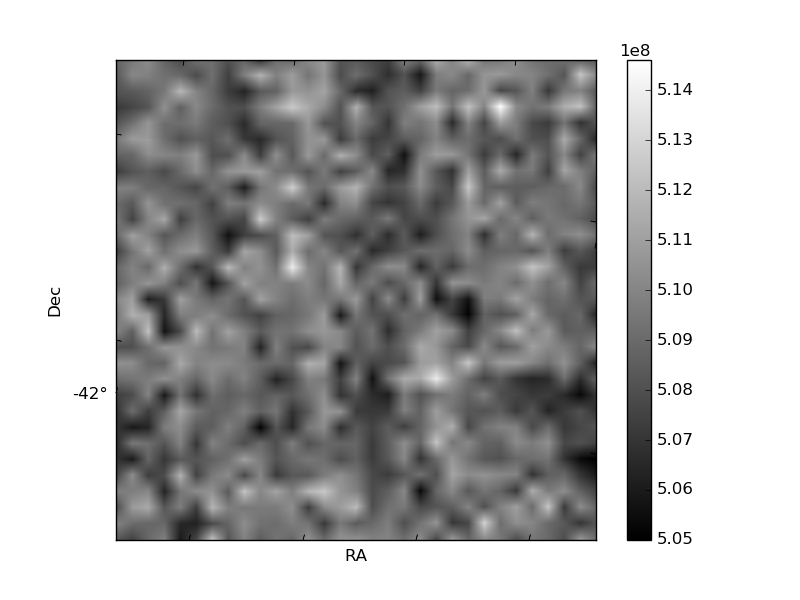
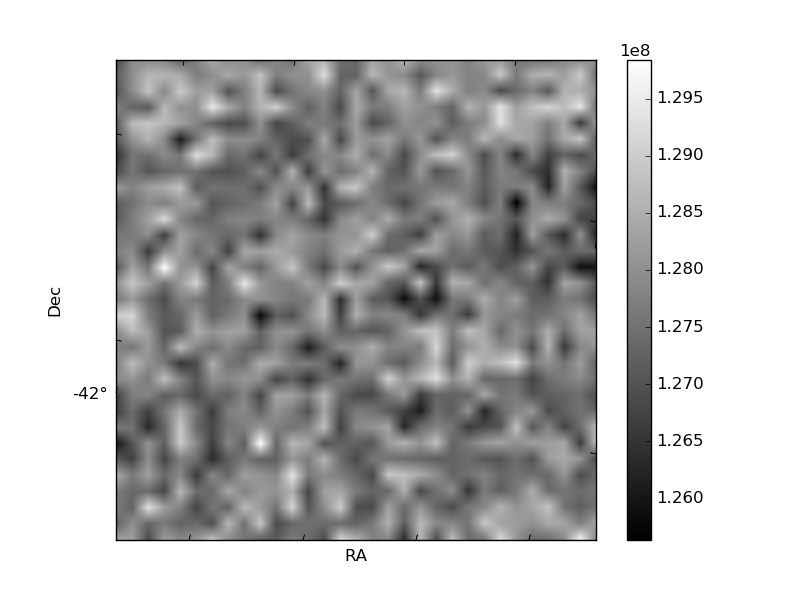
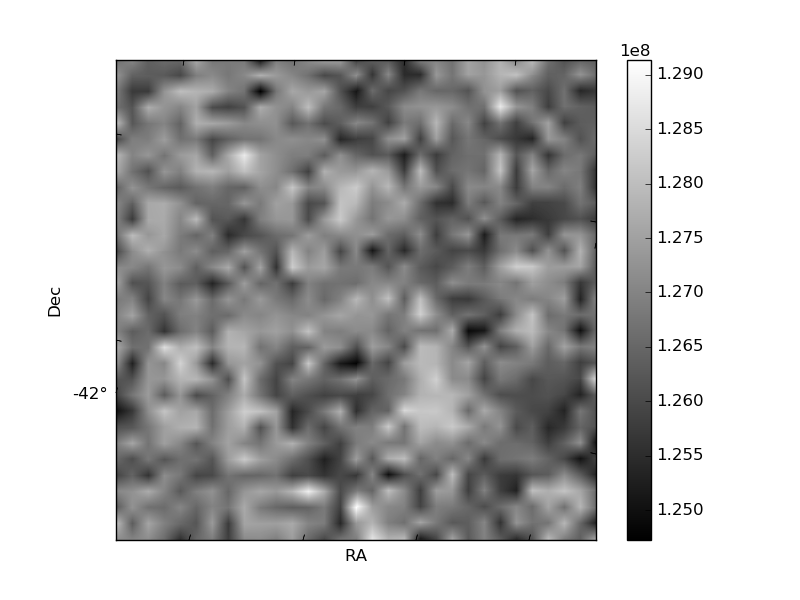
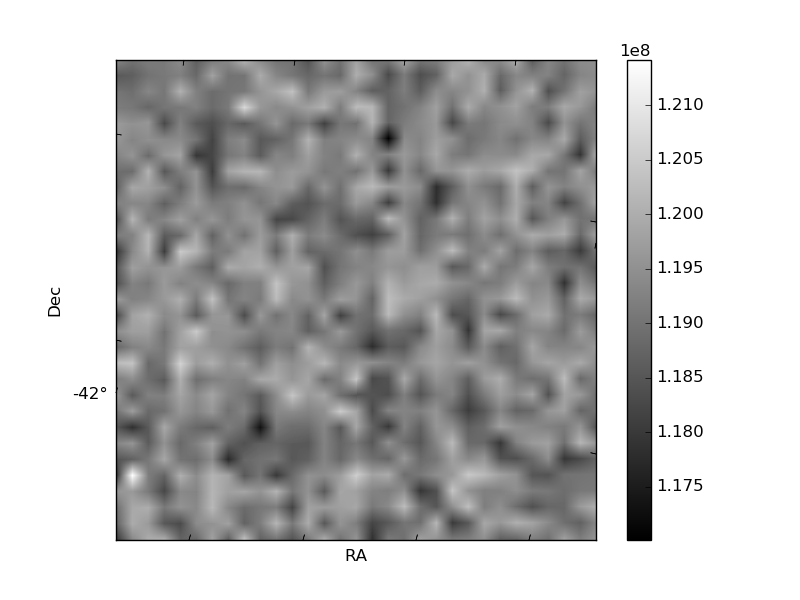
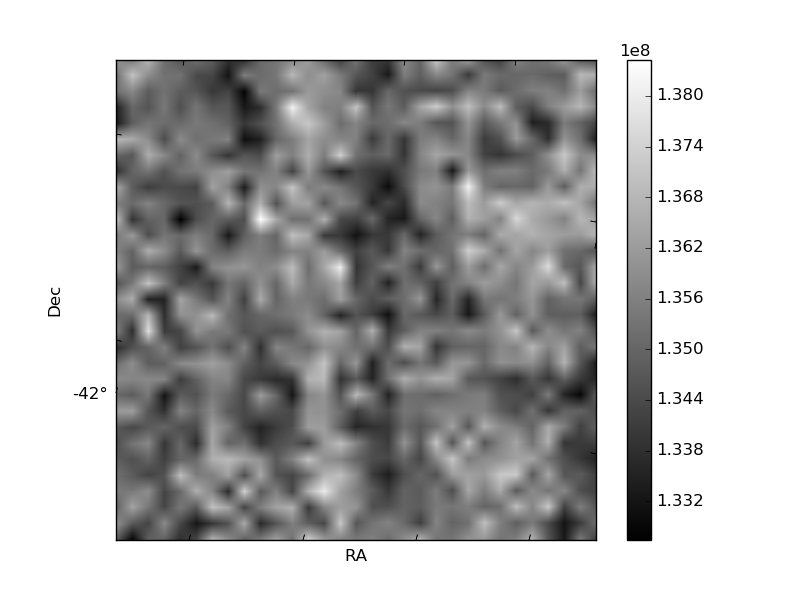
Histogram calculated using DETX and DETY for each event in the final _common_clean file
| Quadrant A | 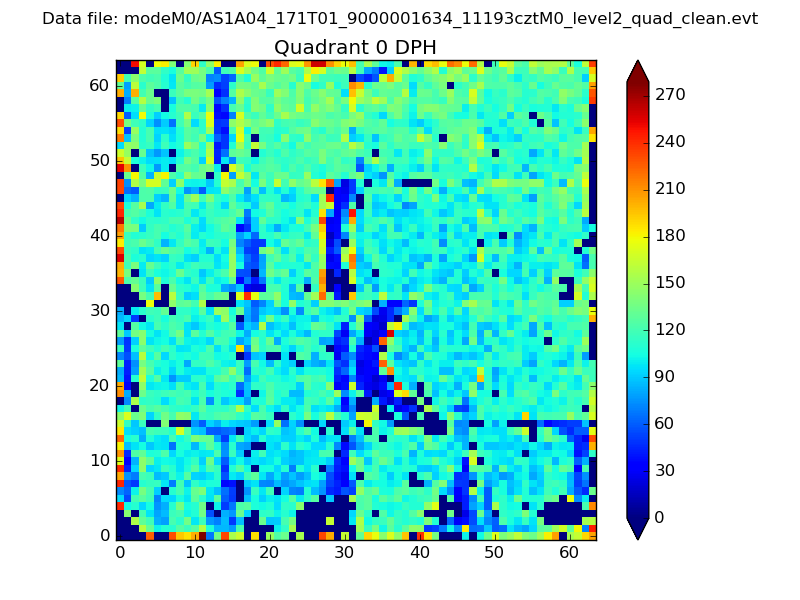 |
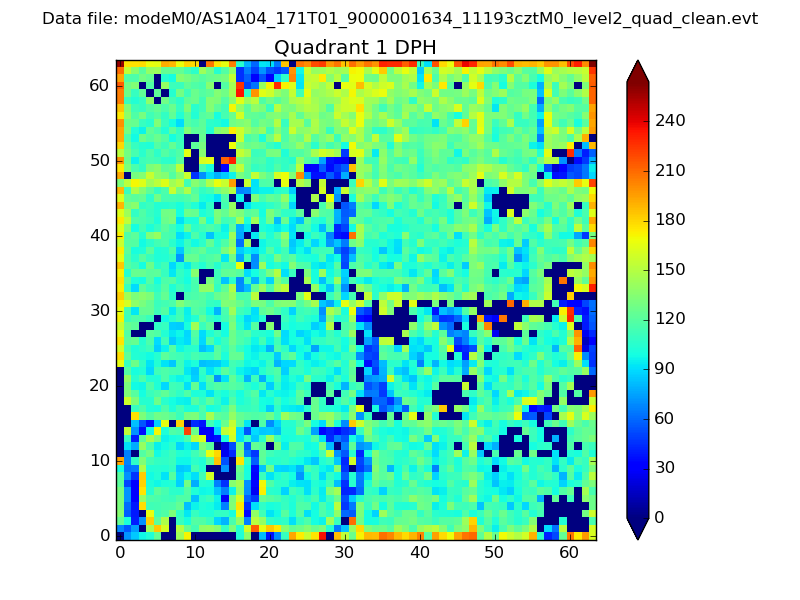 |
Quadrant B |
|---|---|---|---|
| Quadrant D | 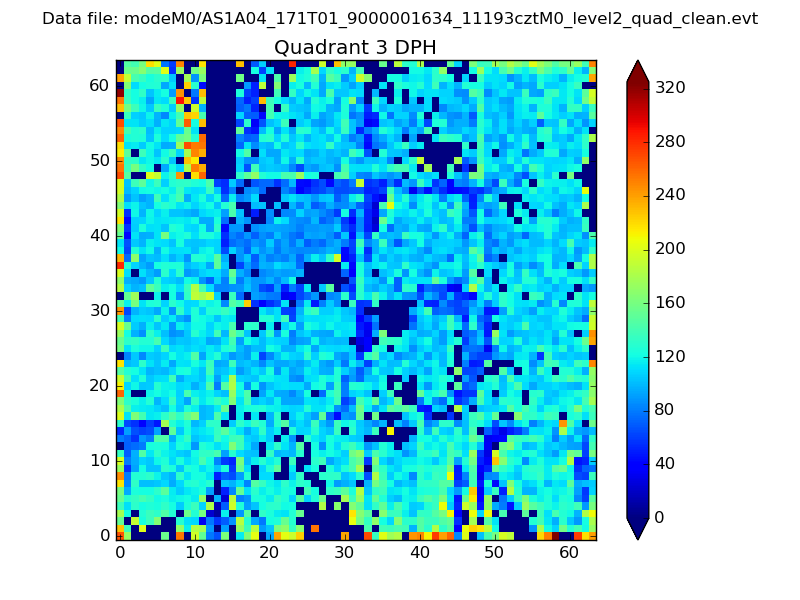 |
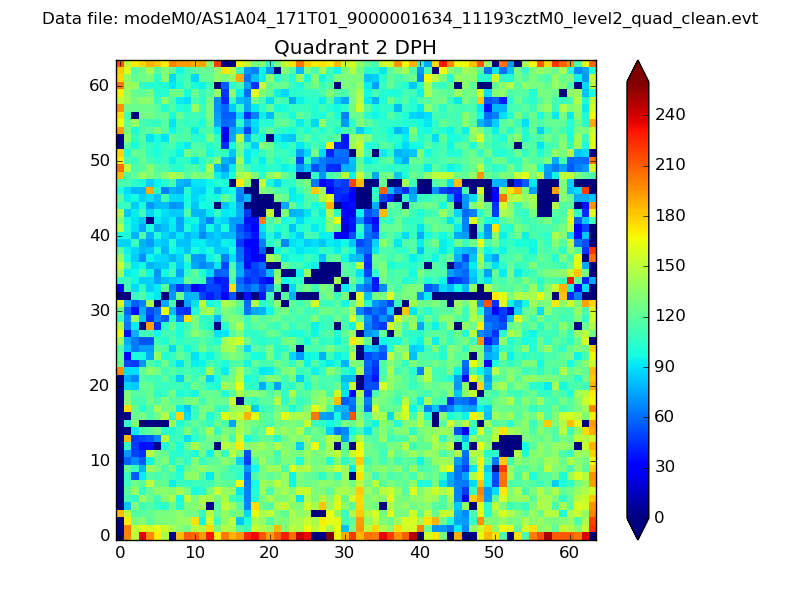 |
Quadrant C |
| Plot type | Count rate plots | Images |
|---|---|---|
| Comparison with Poisson distribution Blue bars denote a histogram of data divided into 1 sec bins. Red curve is a Poisson curve with rate = median count rate of data. |
 |
 |
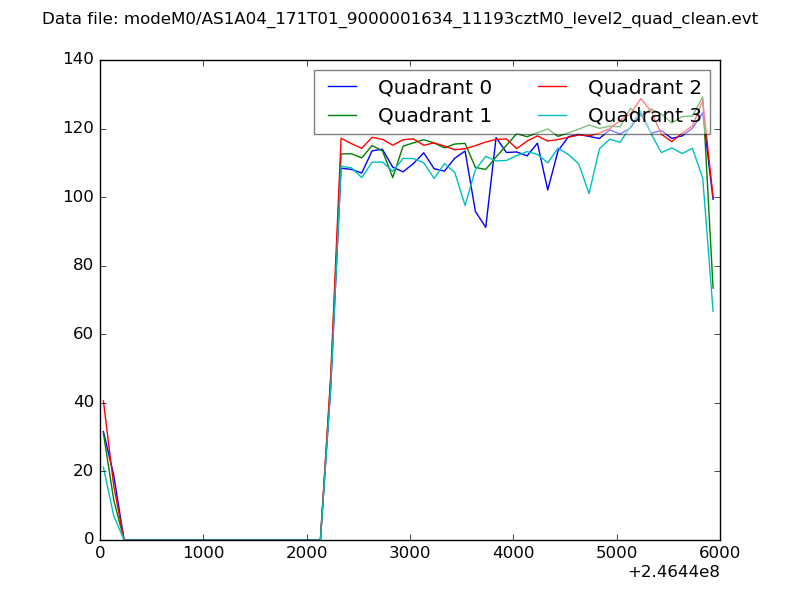
| Quadrant-wise count rates Data is divided into 100 sec bins |
 |
|
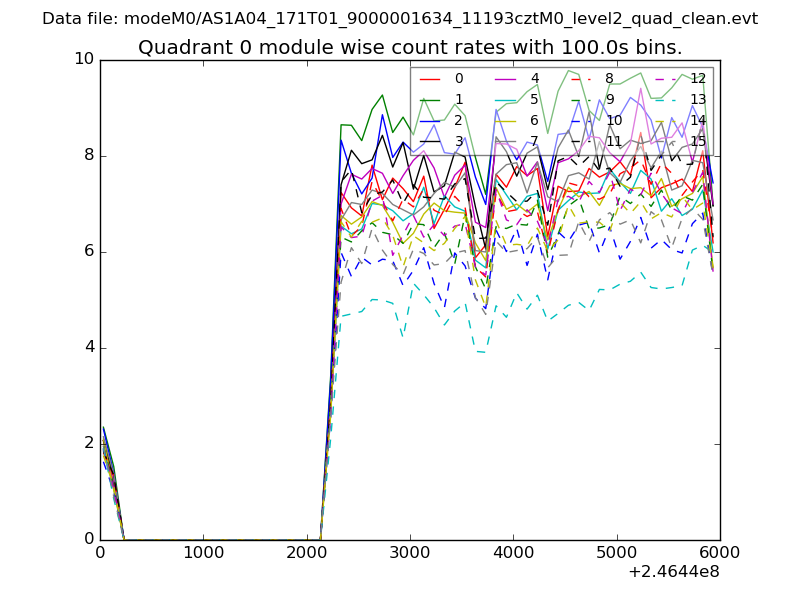
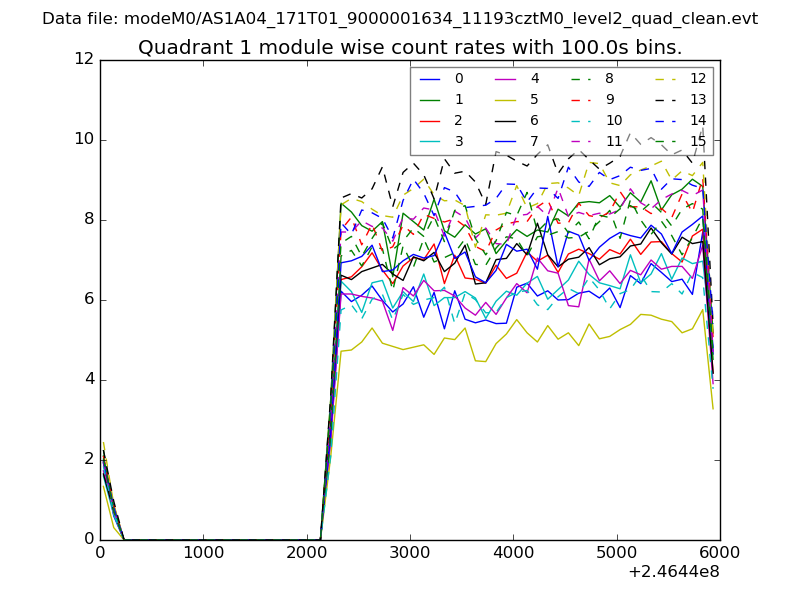
| Module-wise count rates for Quadrant A Data is divided into 100 sec bins |
 |
 |
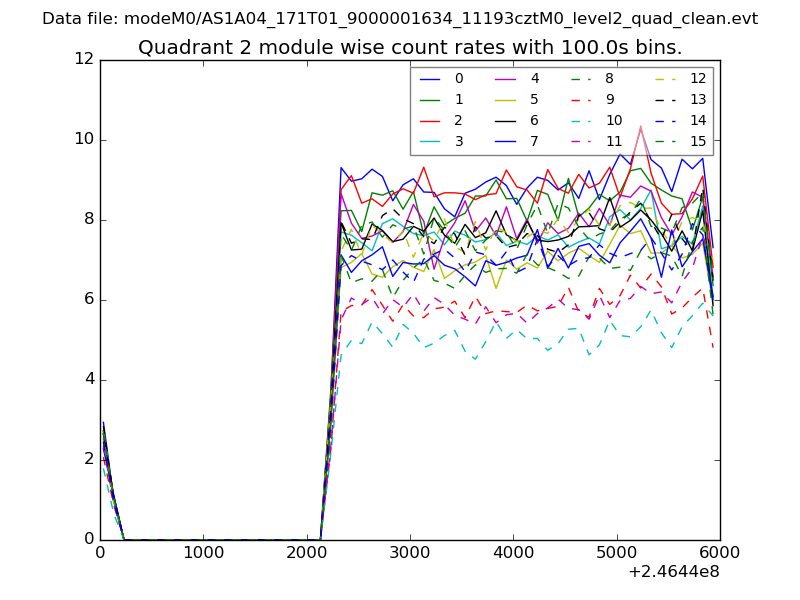
| Module-wise count rates for Quadrant B Data is divided into 100 sec bins |
 |
 |
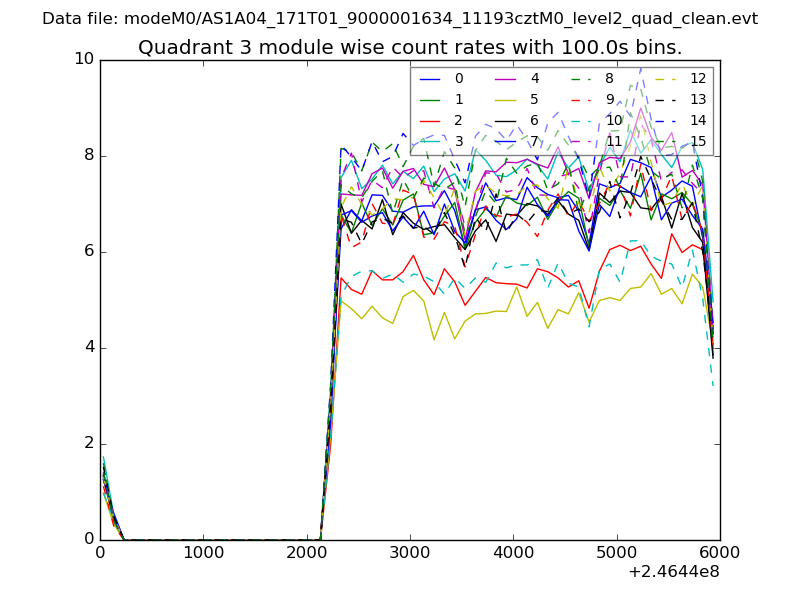
| Module-wise count rates for Quadrant C Data is divided into 100 sec bins |
 |
 |
| Module-wise count rates for Quadrant D Data is divided into 100 sec bins |
 |
 |
| Parameter | Plot |
|---|---|
| CZT HV Monitor |  |
| D_VDD | 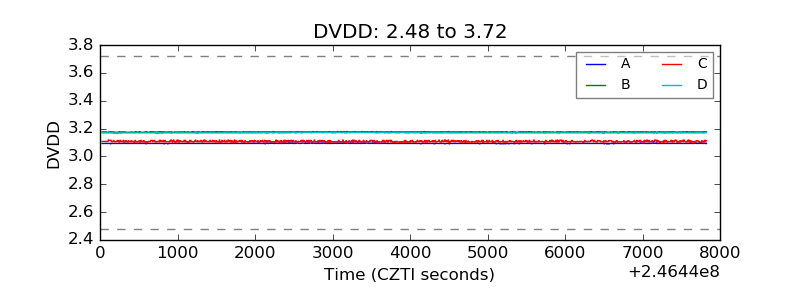 |
| Temperature 1 | 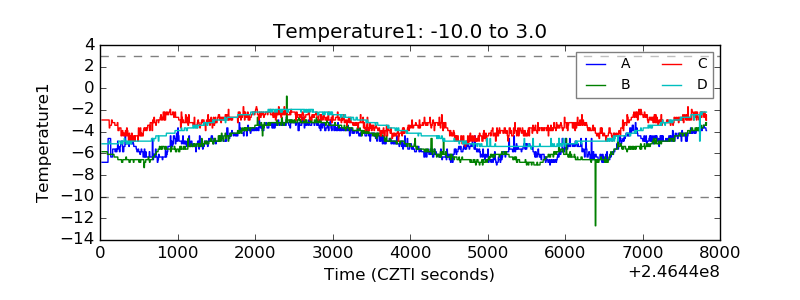 |
| Veto HV Monitor | 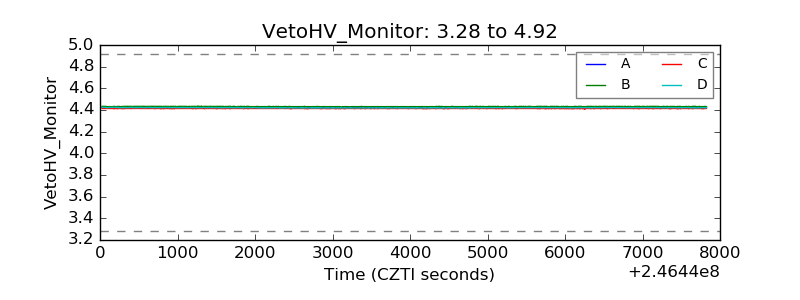 |
| Veto LLD | 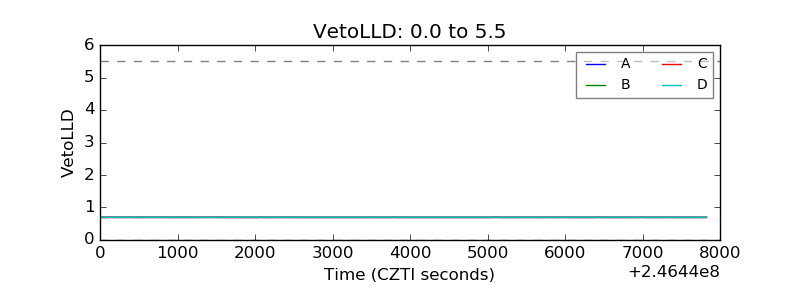 |
| Alpha Counter | 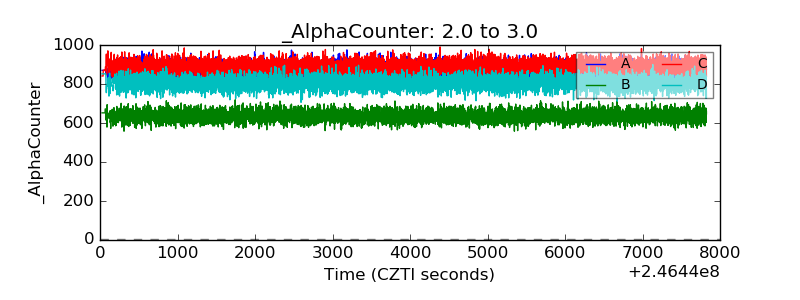 |
| _CPM_Rate | 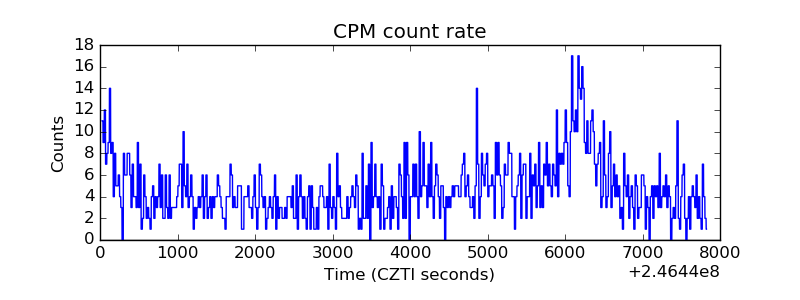 |
| CZT Counter | 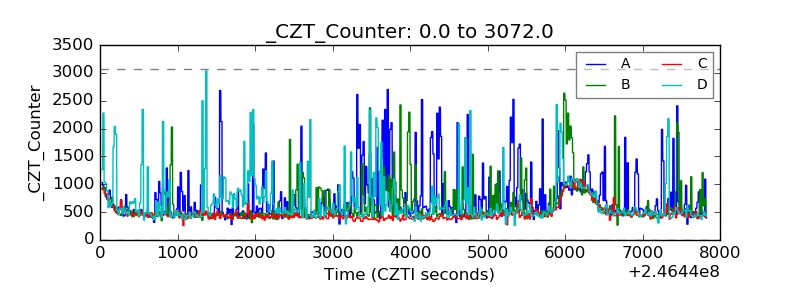 |
| +2.5 Volts monitor |  |
| +5 Volts monitor |  |
| _ROLL_ROT | 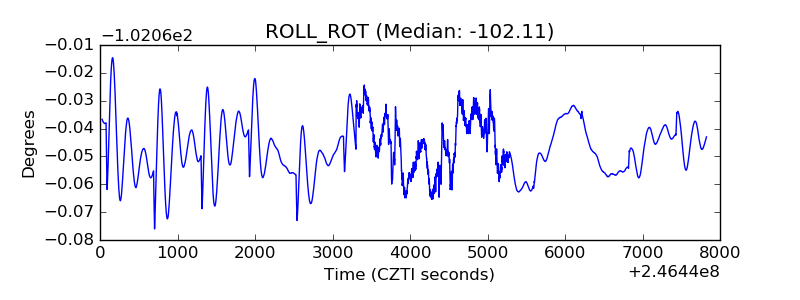 |
| _Roll_DEC | 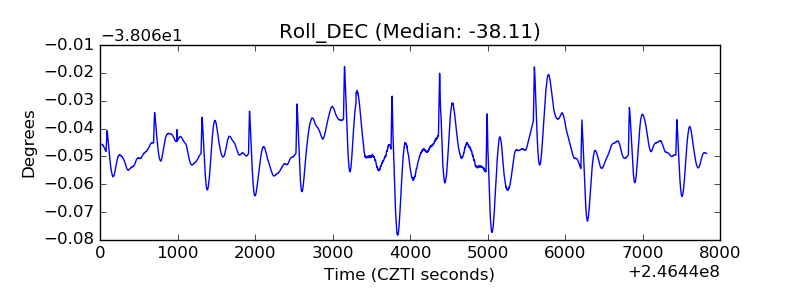 |
| _Roll_RA | 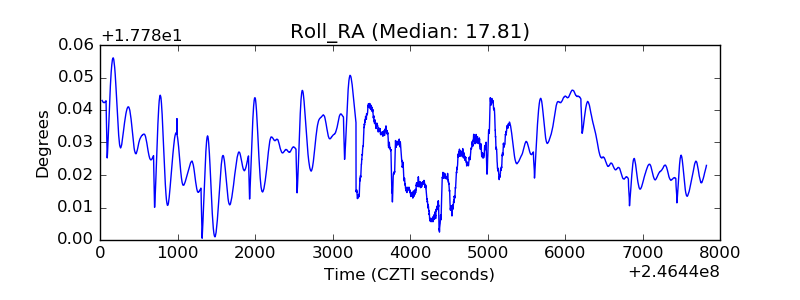 |
| Veto Counter | 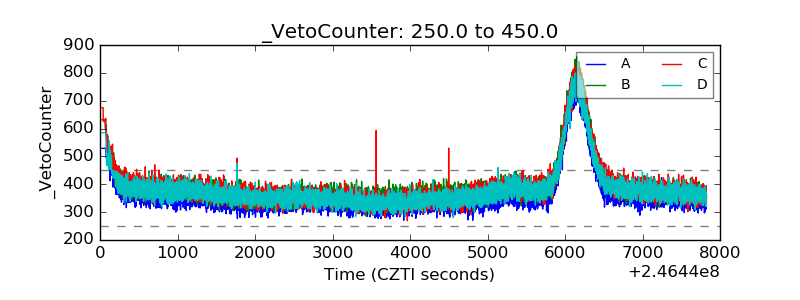 |