| Param | Original file | Final file |
|---|---|---|
| Filename | modeM0/AS1A04_171T01_9000001634_11194cztM0_level2.evt | modeM0/AS1A04_171T01_9000001634_11194cztM0_level2_quad_clean.evt |
| Size (bytes) | 665,314,560 | 76,806,720 |
| Size | 634.5 MB | 73.2 MB |
| Events in quadrant A | 6,176,118 | 438,487 |
| Events in quadrant B | 4,785,335 | 457,846 |
| Events in quadrant C | 3,517,052 | 463,451 |
| Events in quadrant D | 5,150,255 | 431,161 |
| Mode SS | |||
|---|---|---|---|
| Quadrant | BADHDUFLAG | Total packets | Discarded packets |
| A | 0 | 158 | 2 |
| B | 0 | 158 | 2 |
| C | 0 | 158 | 2 |
| D | 0 | 158 | 4 |
| Mode M0 | |||
|---|---|---|---|
| Quadrant | BADHDUFLAG | Total packets | Discarded packets |
| A | 0 | 24028 | 651 |
| B | 0 | 19781 | 612 |
| C | 0 | 16560 | 655 |
| D | 0 | 20872 | 648 |
| Mode M9 | |||
|---|---|---|---|
| Quadrant | BADHDUFLAG | Total packets | Discarded packets |
| A | 0 | 3 | 0 |
| B | 0 | 3 | 0 |
| C | 0 | 3 | 0 |
| D | 0 | 3 | 0 |
| Quadrant | Total seconds | Saturated seconds | Saturation percentage |
|---|---|---|---|
| A | 7684 | 727 | 9.461218% |
| B | 7684 | 480 | 6.246746% |
| C | 7677 | 137 | 1.784551% |
| D | 7686 | 526 | 6.843612% |
Noise dominated data is calculated using 1-second bins in cleaned event files. If a bin has >2000 counts, and if more than 50% of those come from <1% of pixels, then it is considered to be noise-dominated and hence unusable.
| Quadrant | # 1 sec bins | Bins with >0 counts | Bins with >2000 counts | High rate bins dominated by noise | Noise dominated (total time) | Noise dominated (detector-on time) | Marked lightcurve |
|---|---|---|---|---|---|---|---|
| A | 8034 | 7715 | 344 | 344 | 4.28% | 4.46% | 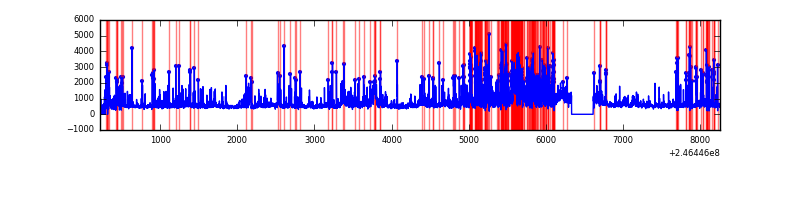 |
| B | 8020 | 7719 | 177 | 177 | 2.21% | 2.29% | 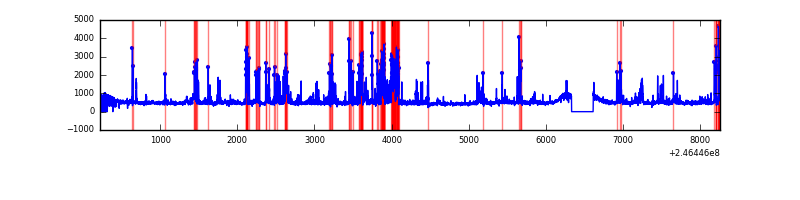 |
| C | 8012 | 7712 | 0 | 0 | 0.00% | 0.00% | 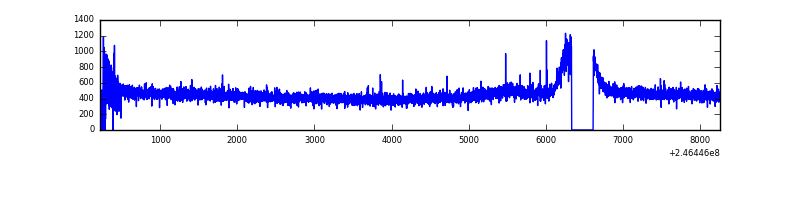 |
| D | 8018 | 7719 | 304 | 304 | 3.79% | 3.94% | 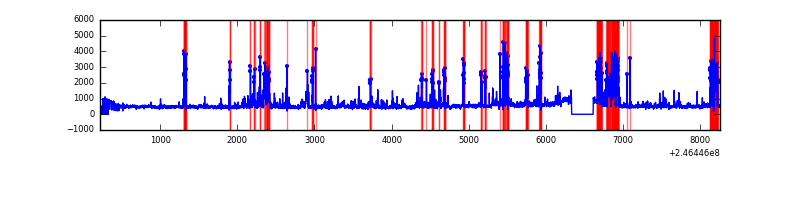 |
Top three noisy pixels from each quadrant. If the there are fewer than three noisy pixels in the level2.evt file, extra rows are filled as -1
| Pixel properties | Quadrant properties | ||||||
|---|---|---|---|---|---|---|---|
| Quadrant | DetID | PixID | Counts | Sigma | Mean | Median | Sigma |
| A | 8 | 5 | 2362322 | 12947.6 | 884 | 864 | 182.4 |
| A | 8 | 15 | 310622 | 1698.37 | 884 | 864 | 182.4 |
| A | 15 | 174 | 70479 | 381.69 | 884 | 864 | 182.4 |
| B | 4 | 239 | 1018313 | 5774.11 | 902 | 877 | 176.2 |
| B | 4 | 80 | 85994 | 483.05 | 902 | 877 | 176.2 |
| B | 11 | 51 | 72767 | 407.99 | 902 | 877 | 176.2 |
| C | 8 | 128 | 11107 | 48.77 | 895 | 898 | 209.3 |
| C | 13 | 61 | 6533 | 26.92 | 895 | 898 | 209.3 |
| C | 8 | 112 | 6523 | 26.87 | 895 | 898 | 209.3 |
| D | 10 | 253 | 498622 | 2366.95 | 867 | 841 | 210.3 |
| D | 1 | 52 | 412961 | 1959.63 | 867 | 841 | 210.3 |
| D | 2 | 14 | 404672 | 1920.22 | 867 | 841 | 210.3 |
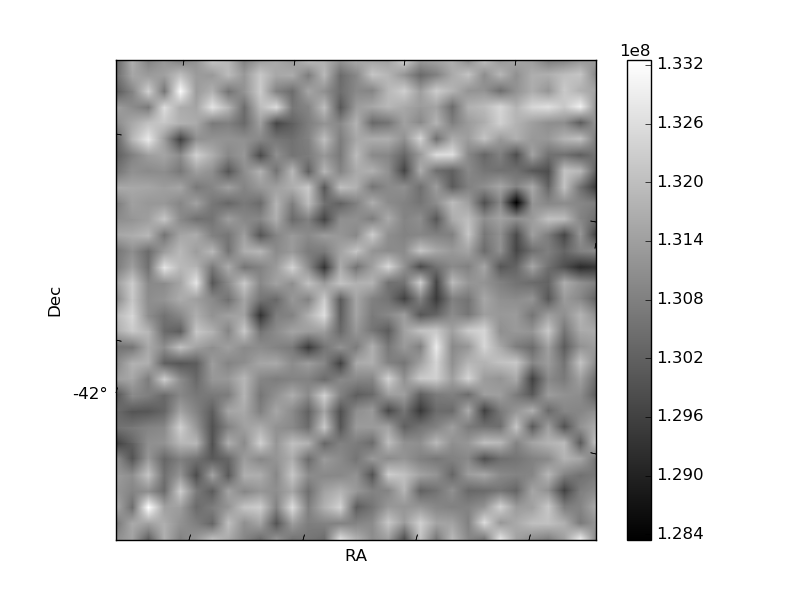
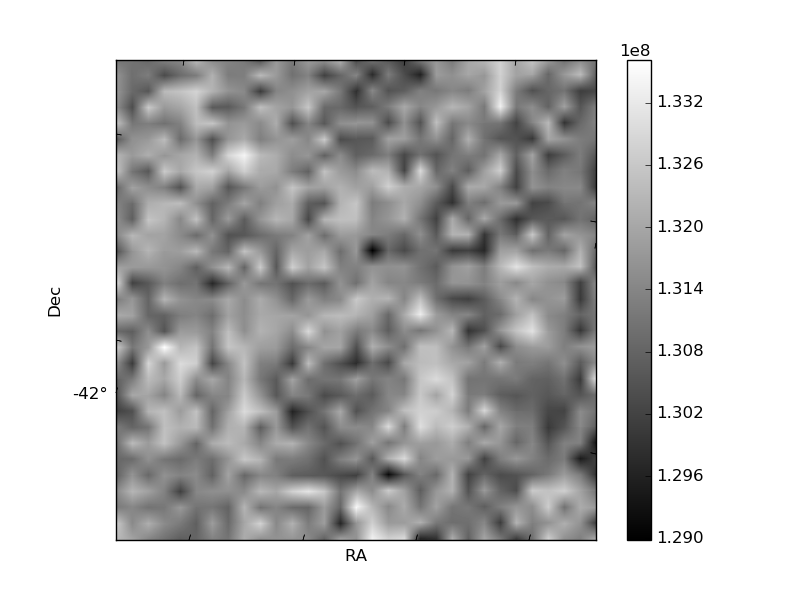
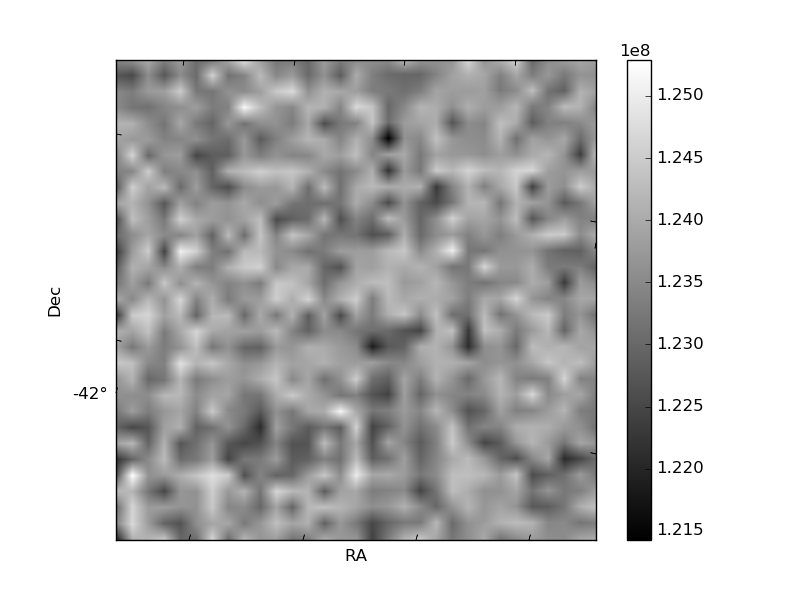
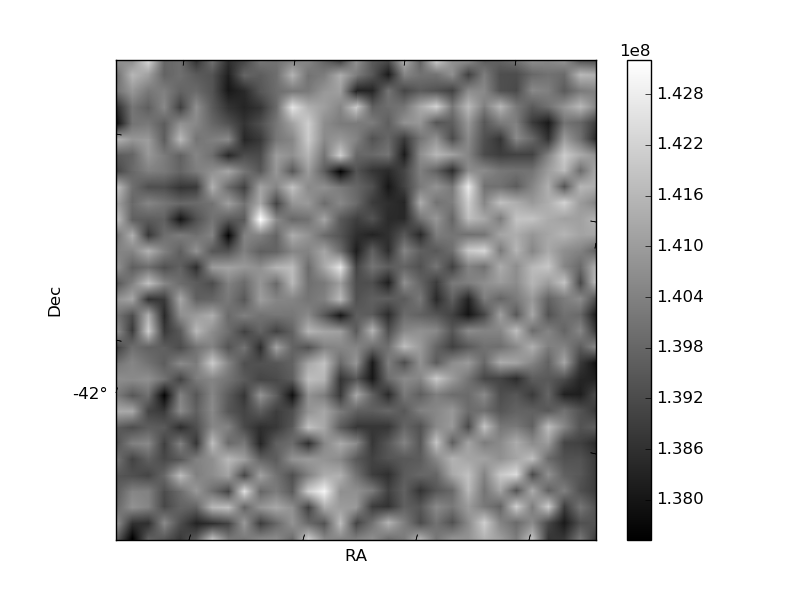
Histogram calculated using DETX and DETY for each event in the final _common_clean file
| Quadrant A | 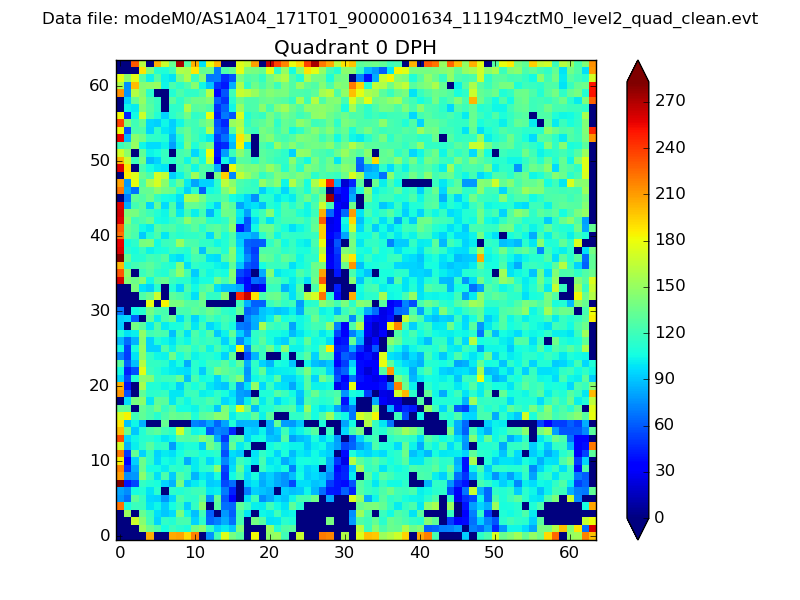 |
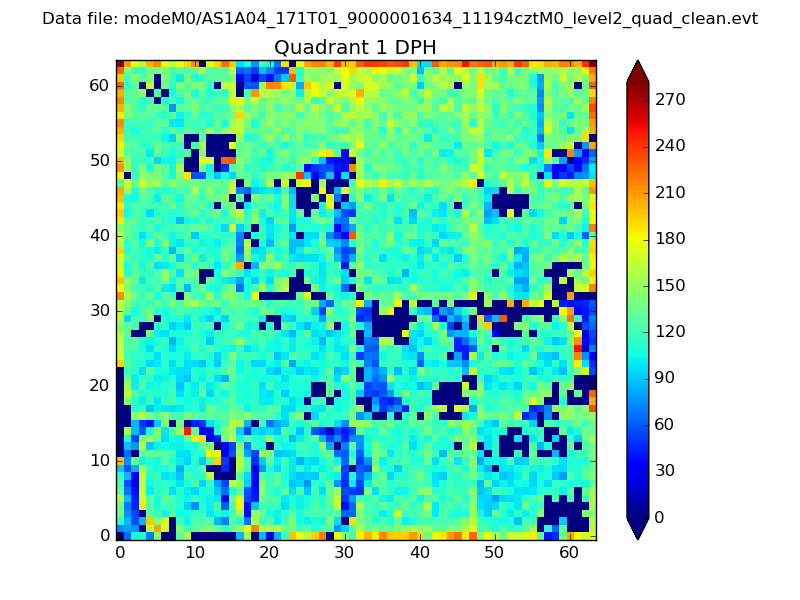 |
Quadrant B |
|---|---|---|---|
| Quadrant D | 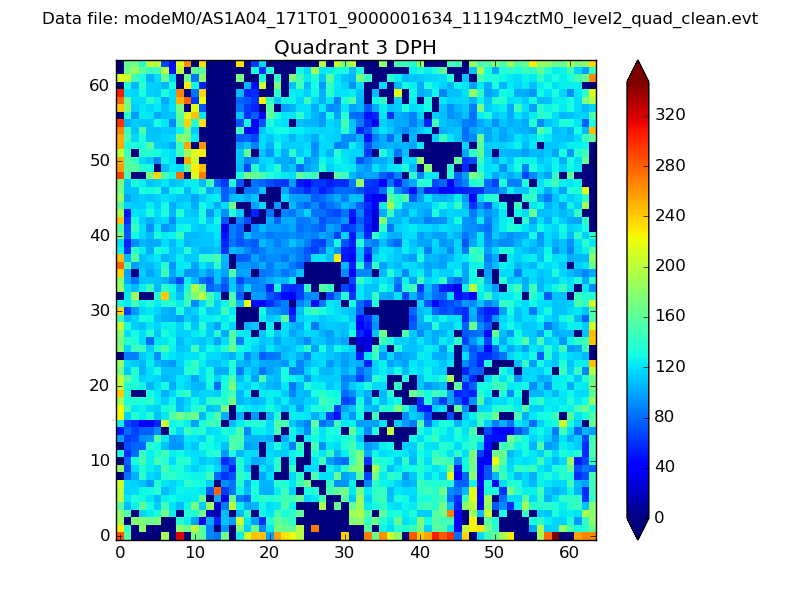 |
 |
Quadrant C |
| Plot type | Count rate plots | Images |
|---|---|---|
| Comparison with Poisson distribution Blue bars denote a histogram of data divided into 1 sec bins. Red curve is a Poisson curve with rate = median count rate of data. |
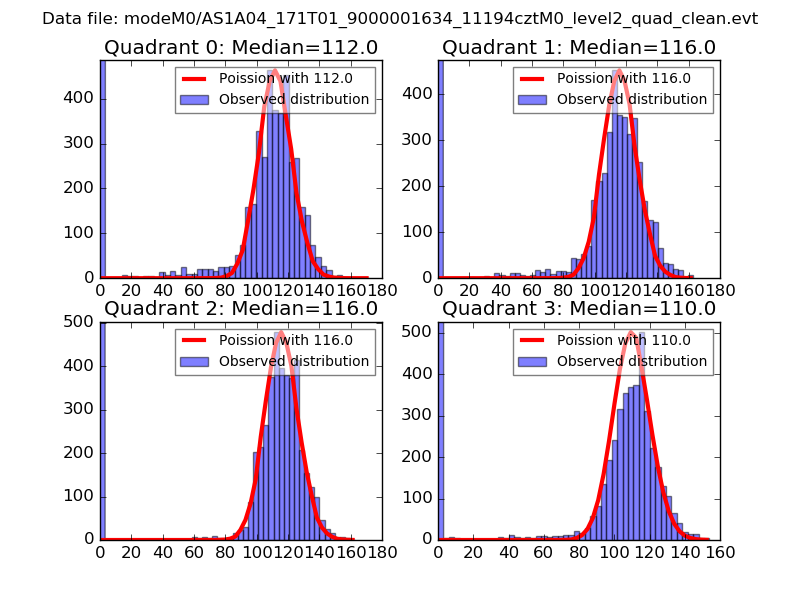 |
 |
| Quadrant-wise count rates Data is divided into 100 sec bins |
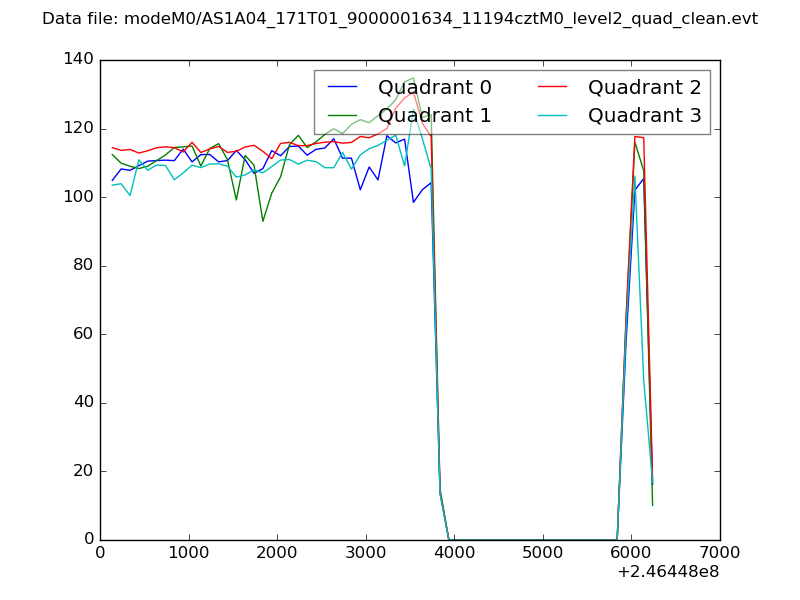 |
|
| Module-wise count rates for Quadrant A Data is divided into 100 sec bins |
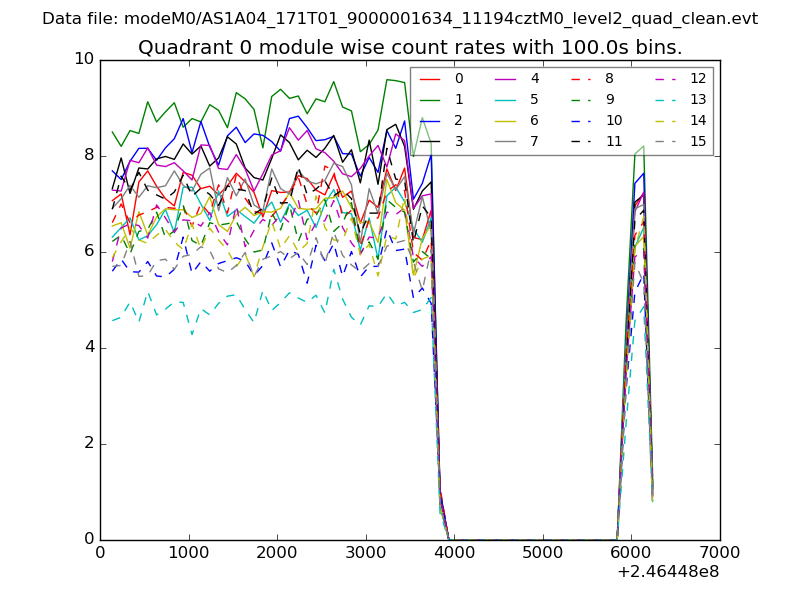 |
 |
| Module-wise count rates for Quadrant B Data is divided into 100 sec bins |
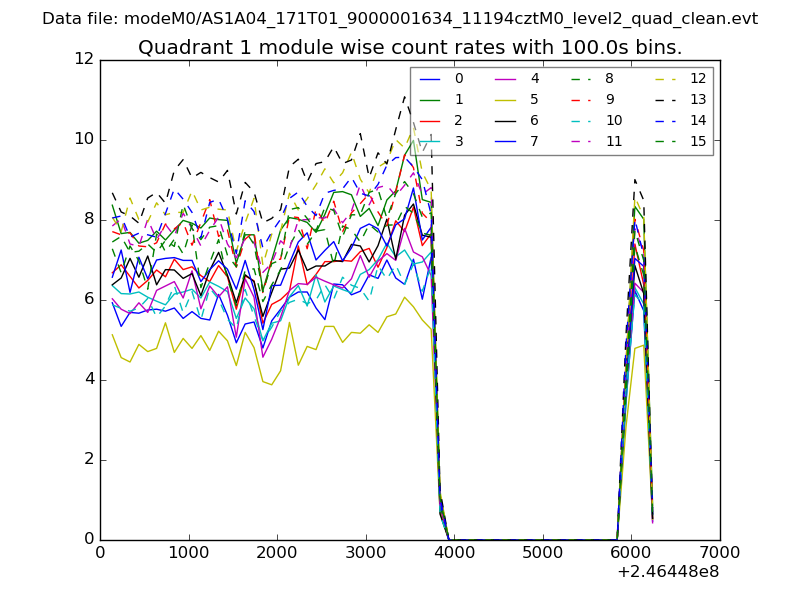 |
 |
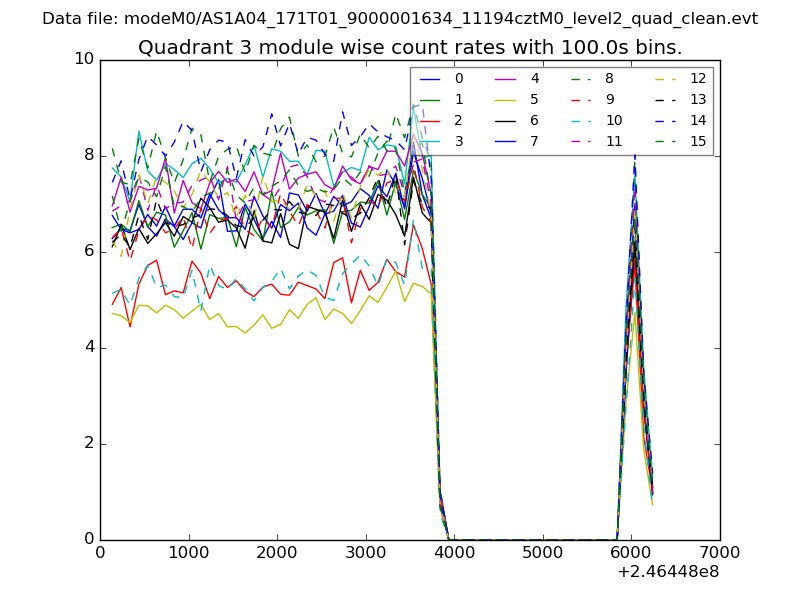
| Module-wise count rates for Quadrant C Data is divided into 100 sec bins |
 |
 |
| Module-wise count rates for Quadrant D Data is divided into 100 sec bins |
 |
 |
| Parameter | Plot |
|---|---|
| CZT HV Monitor | 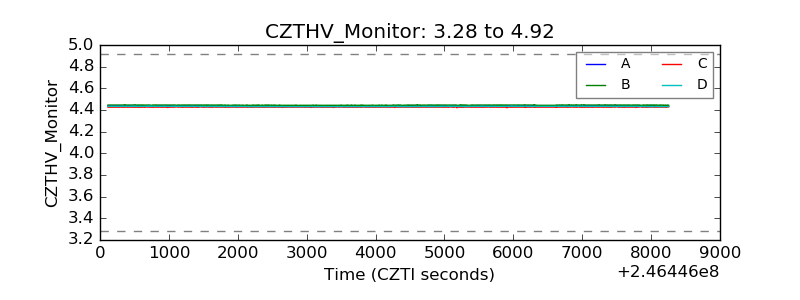 |
| D_VDD | 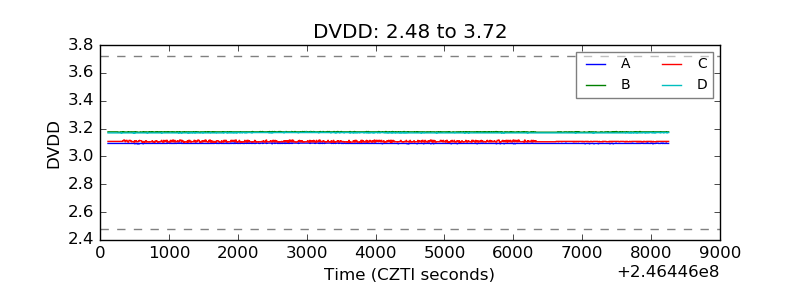 |
| Temperature 1 | 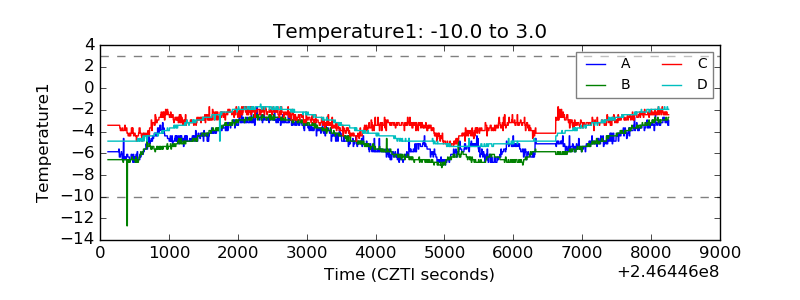 |
| Veto HV Monitor | 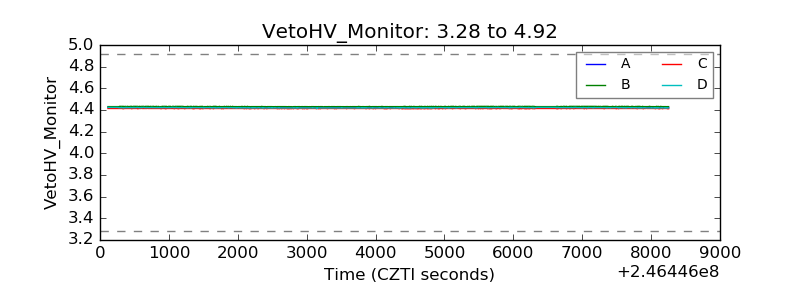 |
| Veto LLD | 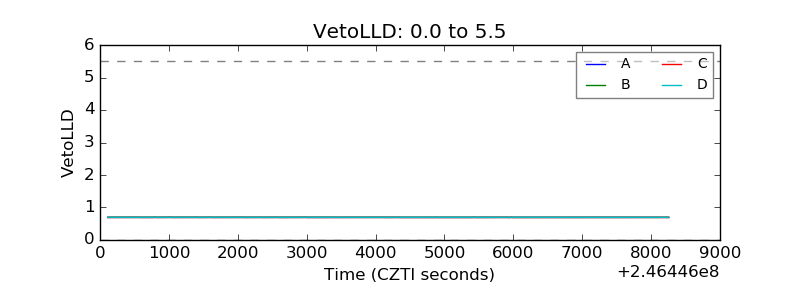 |
| Alpha Counter | 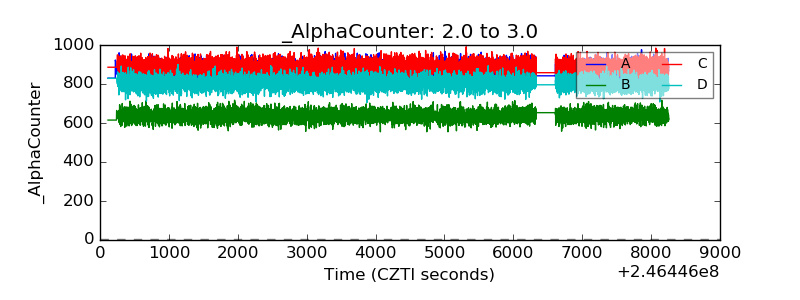 |
| _CPM_Rate | 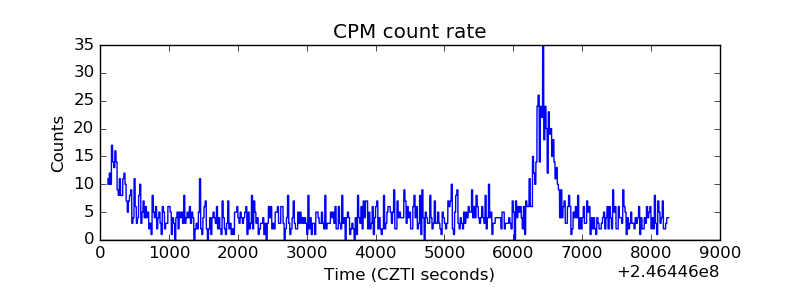 |
| CZT Counter |  |
| +2.5 Volts monitor |  |
| +5 Volts monitor |  |
| _ROLL_ROT | 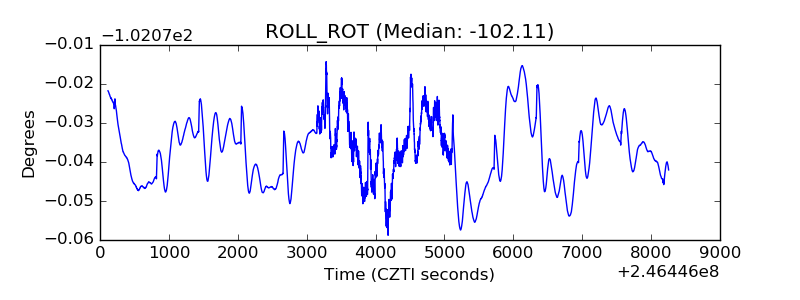 |
| _Roll_DEC | 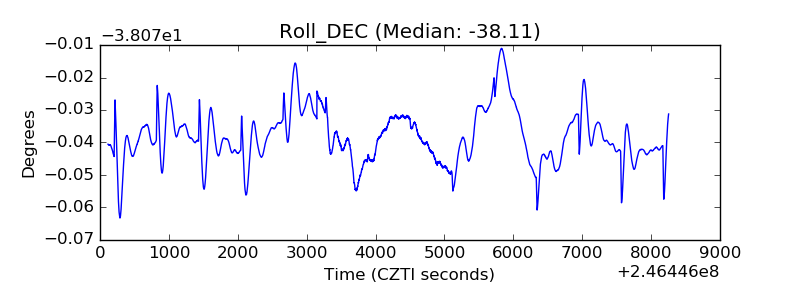 |
| _Roll_RA |  |
| Veto Counter | 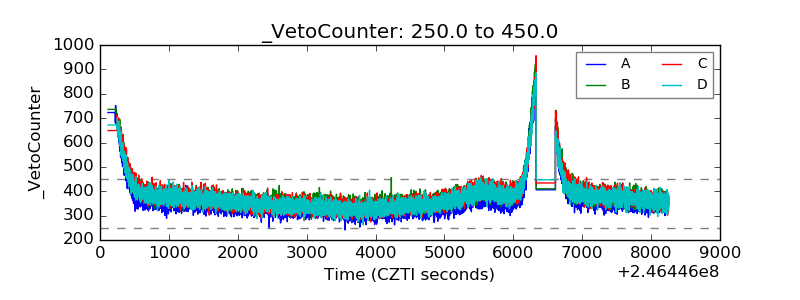 |