| Param | Original file | Final file |
|---|---|---|
| Filename | modeM0/AS1A04_171T01_9000001634_11197cztM0_level2.evt | modeM0/AS1A04_171T01_9000001634_11197cztM0_level2_quad_clean.evt |
| Size (bytes) | 1,444,993,920 | 229,495,680 |
| Size | 1.3 GB | 218.9 MB |
| Events in quadrant A | 11,996,086 | 1,429,635 |
| Events in quadrant B | 11,137,302 | 1,444,191 |
| Events in quadrant C | 7,841,225 | 1,462,154 |
| Events in quadrant D | 11,572,593 | 1,374,118 |
| Mode SS | |||
|---|---|---|---|
| Quadrant | BADHDUFLAG | Total packets | Discarded packets |
| A | 0 | 368 | 2 |
| B | 0 | 368 | 0 |
| C | 0 | 368 | 0 |
| D | 0 | 368 | 0 |
| Mode M0 | |||
|---|---|---|---|
| Quadrant | BADHDUFLAG | Total packets | Discarded packets |
| A | 0 | 47820 | 240 |
| B | 0 | 45271 | 152 |
| C | 0 | 36570 | 150 |
| D | 0 | 46568 | 185 |
| Mode M9 | |||
|---|---|---|---|
| Quadrant | BADHDUFLAG | Total packets | Discarded packets |
| A | 0 | 20 | 0 |
| B | 0 | 20 | 0 |
| C | 0 | 20 | 0 |
| D | 0 | 20 | 0 |
| Quadrant | Total seconds | Saturated seconds | Saturation percentage |
|---|---|---|---|
| A | 17979 | 895 | 4.978030% |
| B | 17996 | 924 | 5.134474% |
| C | 17988 | 98 | 0.544808% |
| D | 17987 | 633 | 3.519208% |
Noise dominated data is calculated using 1-second bins in cleaned event files. If a bin has >2000 counts, and if more than 50% of those come from <1% of pixels, then it is considered to be noise-dominated and hence unusable.
| Quadrant | # 1 sec bins | Bins with >0 counts | Bins with >2000 counts | High rate bins dominated by noise | Noise dominated (total time) | Noise dominated (detector-on time) | Marked lightcurve |
|---|---|---|---|---|---|---|---|
| A | 20123 | 18021 | 529 | 529 | 2.63% | 2.94% | 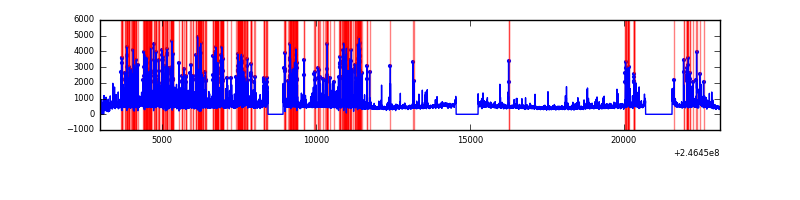 |
| B | 20123 | 18034 | 506 | 506 | 2.51% | 2.81% | 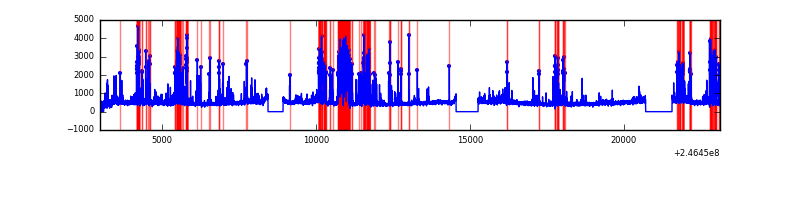 |
| C | 20124 | 18023 | 0 | 0 | 0.00% | 0.00% | 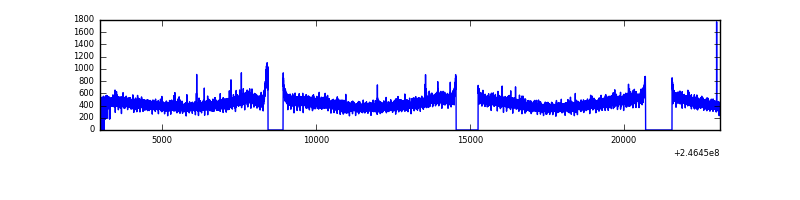 |
| D | 20123 | 18023 | 448 | 448 | 2.23% | 2.49% | 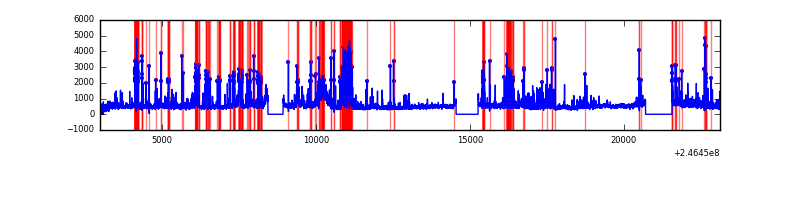 |
Top three noisy pixels from each quadrant. If the there are fewer than three noisy pixels in the level2.evt file, extra rows are filled as -1
| Pixel properties | Quadrant properties | ||||||
|---|---|---|---|---|---|---|---|
| Quadrant | DetID | PixID | Counts | Sigma | Mean | Median | Sigma |
| A | 8 | 5 | 3403245 | 8204.07 | 2032 | 1985 | 414.6 |
| A | 8 | 15 | 445511 | 1069.81 | 2032 | 1985 | 414.6 |
| A | 15 | 239 | 234368 | 560.52 | 2032 | 1985 | 414.6 |
| B | 4 | 239 | 2682678 | 6899.56 | 2044 | 1994 | 388.5 |
| B | 4 | 80 | 170685 | 434.18 | 2044 | 1994 | 388.5 |
| B | 11 | 51 | 129770 | 328.87 | 2044 | 1994 | 388.5 |
| C | 13 | 61 | 14687 | 27.06 | 2010 | 2014 | 468.3 |
| C | 12 | 4 | 8903 | 14.71 | 2010 | 2014 | 468.3 |
| C | 3 | 202 | 4948 | 6.27 | 2010 | 2014 | 468.3 |
| D | 1 | 52 | 958378 | 2011.81 | 1973 | 1915 | 475.4 |
| D | 5 | 222 | 805067 | 1689.33 | 1973 | 1915 | 475.4 |
| D | 8 | 195 | 593489 | 1244.31 | 1973 | 1915 | 475.4 |
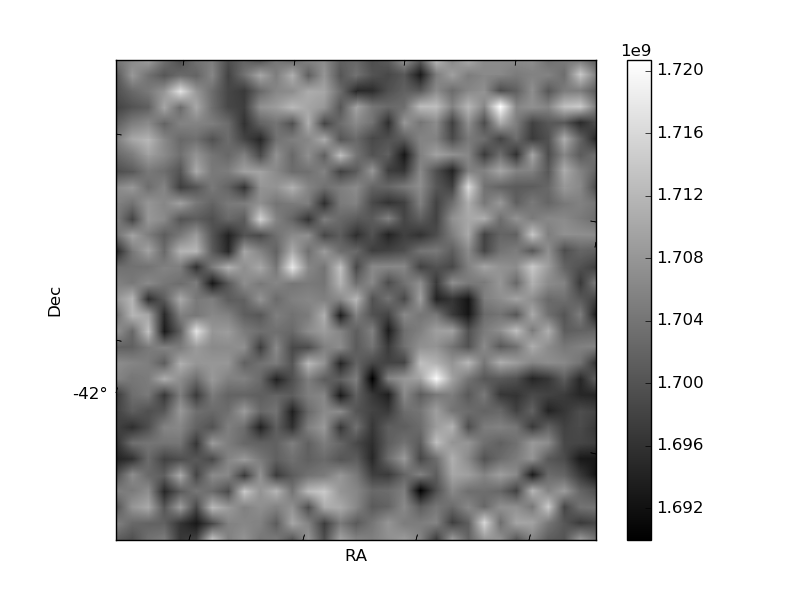
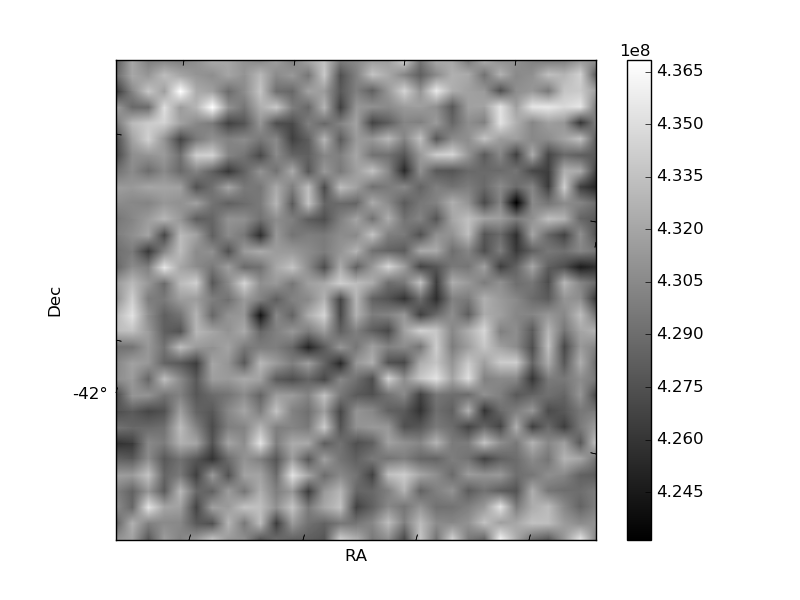
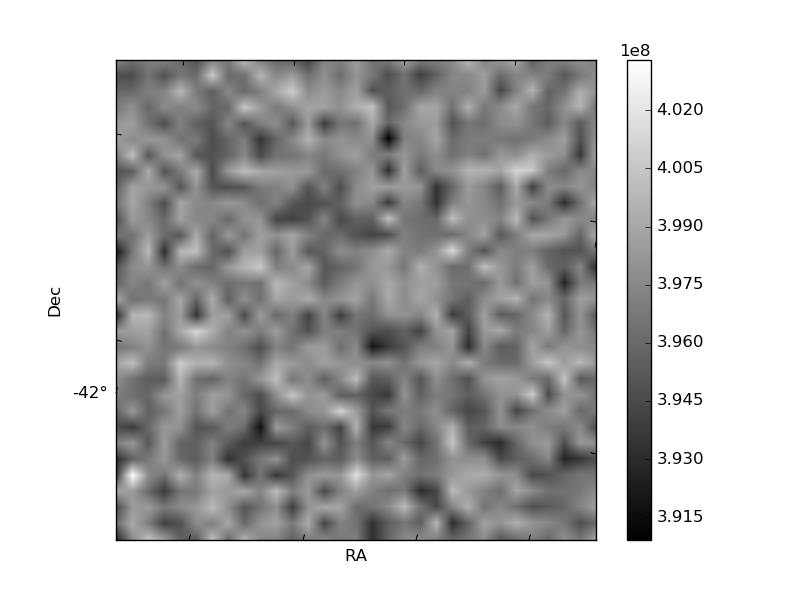
Histogram calculated using DETX and DETY for each event in the final _common_clean file
| Quadrant A | 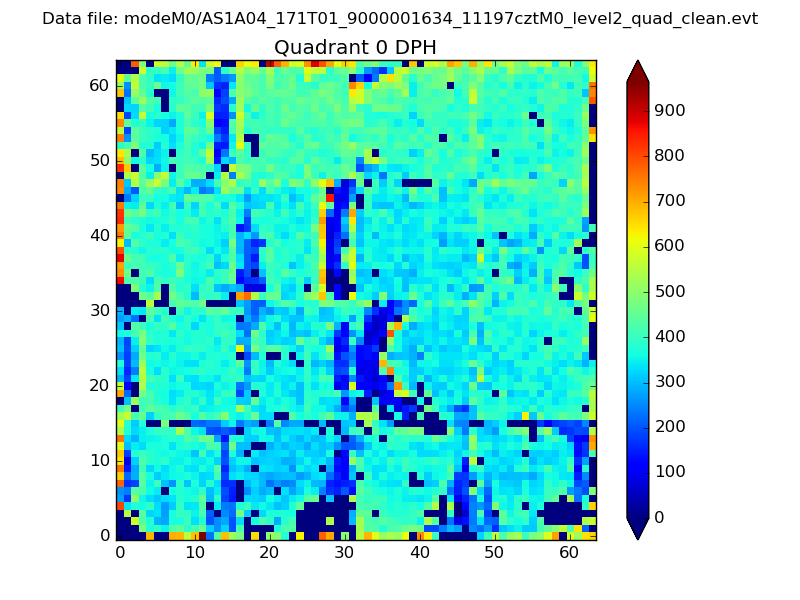 |
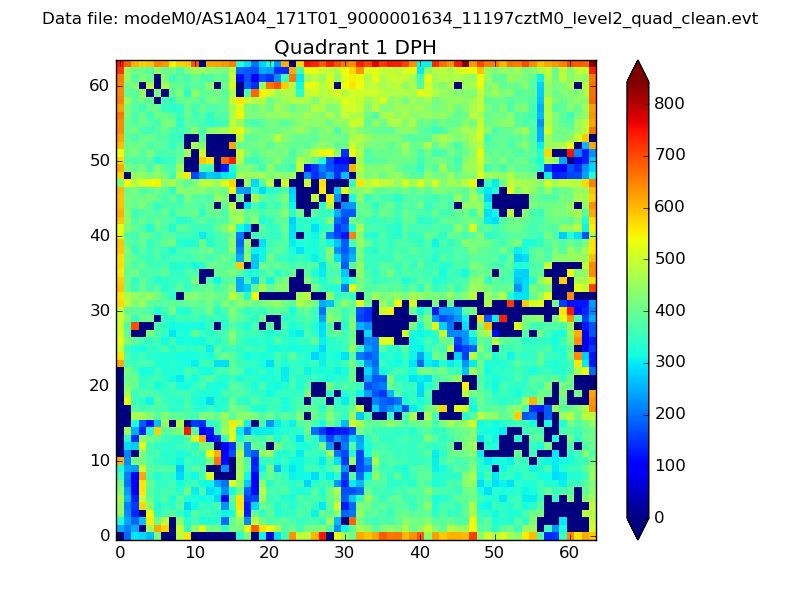 |
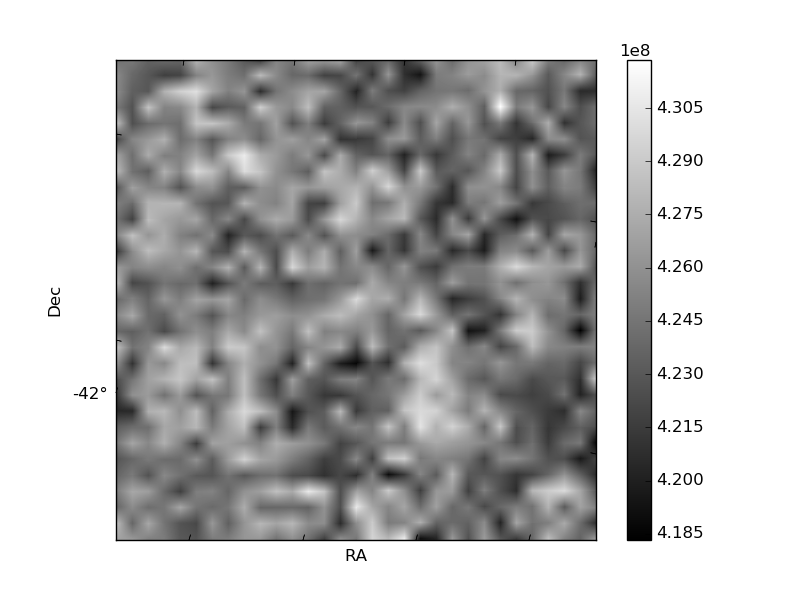
Quadrant B |
|---|---|---|---|
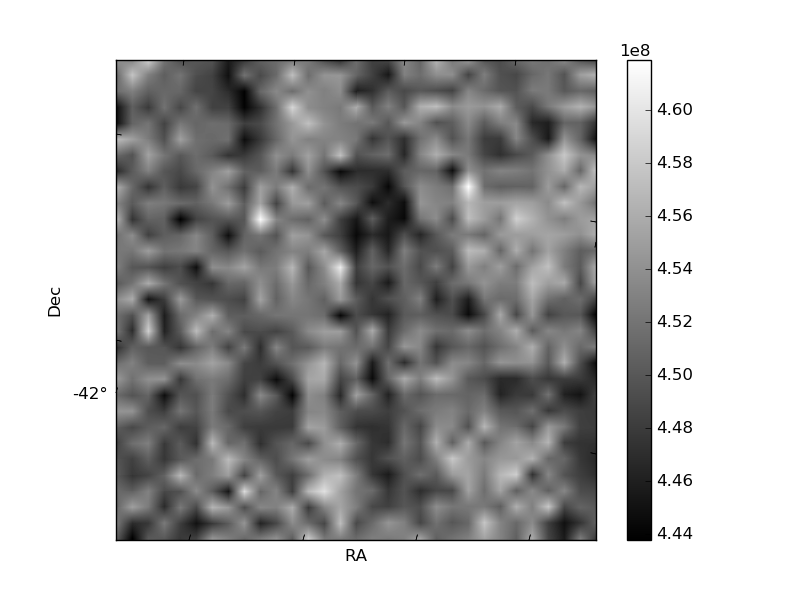
| Quadrant D | 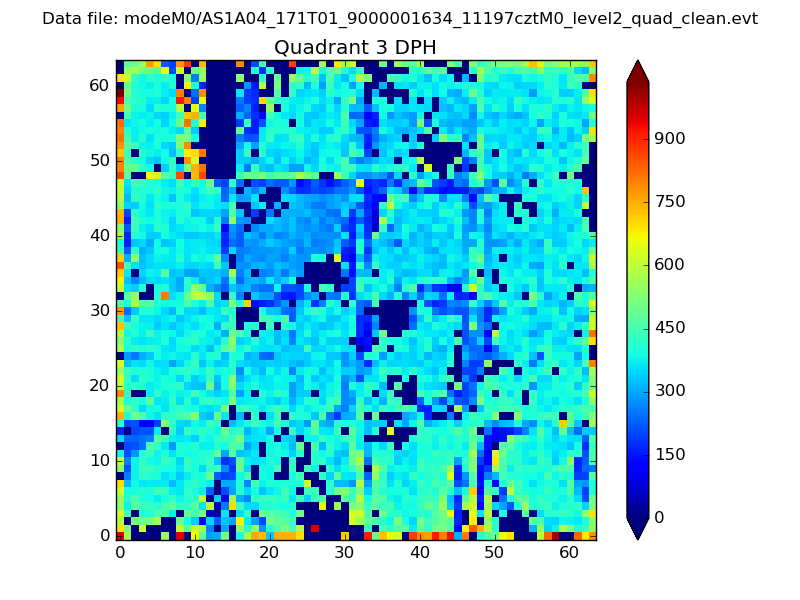 |
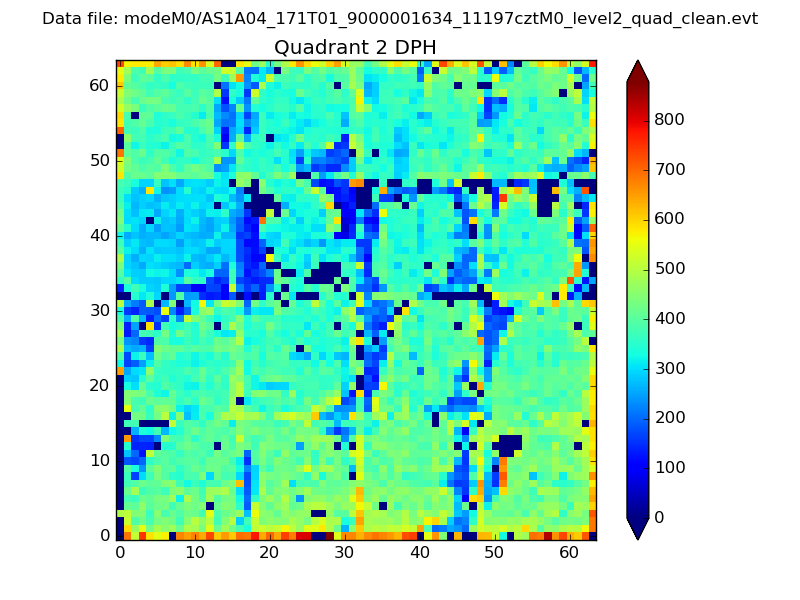 |
Quadrant C |
| Plot type | Count rate plots | Images |
|---|---|---|
| Comparison with Poisson distribution Blue bars denote a histogram of data divided into 1 sec bins. Red curve is a Poisson curve with rate = median count rate of data. |
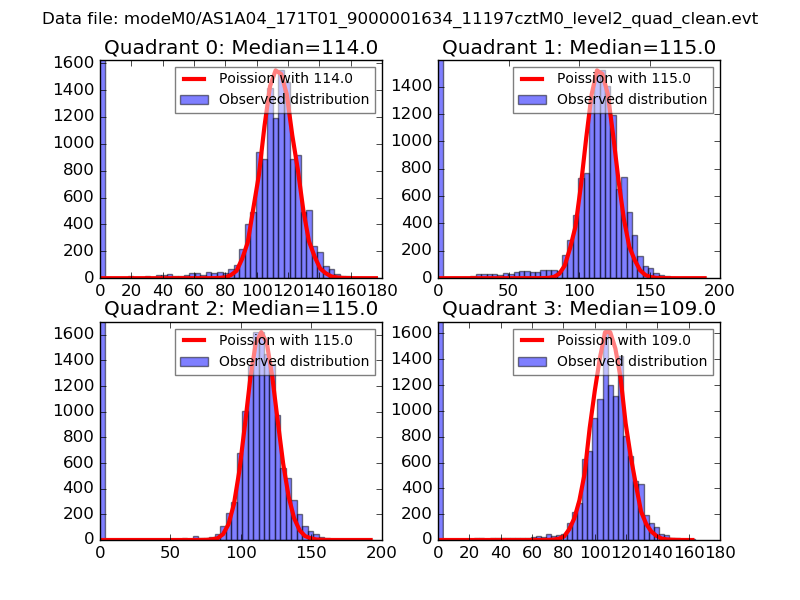 |
 |
| Quadrant-wise count rates Data is divided into 100 sec bins |
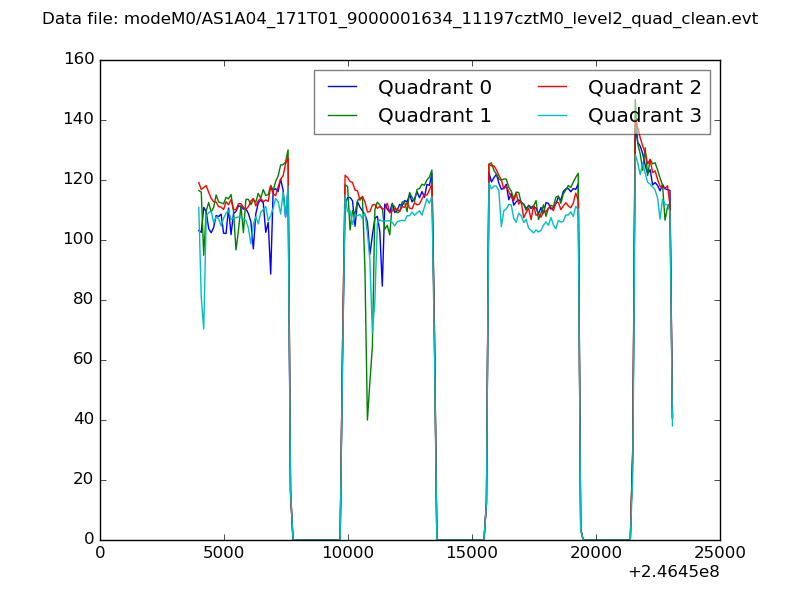 |
|
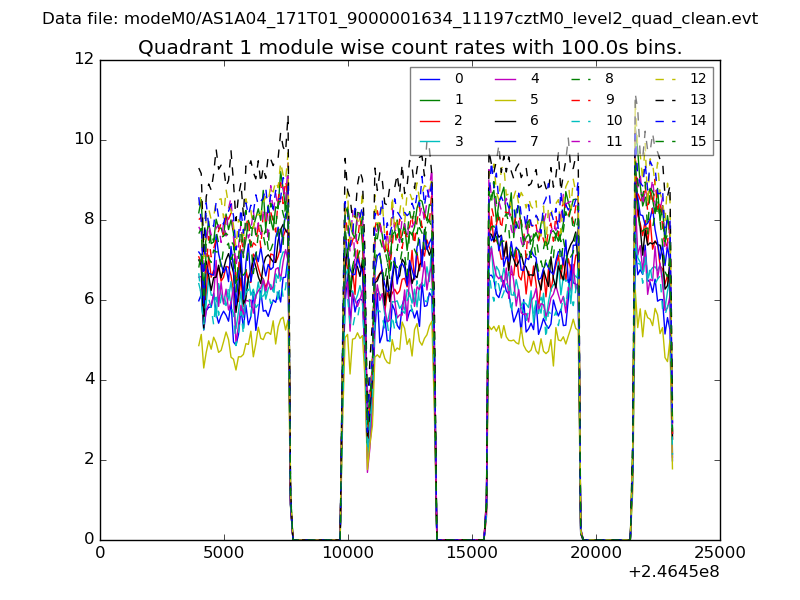
| Module-wise count rates for Quadrant A Data is divided into 100 sec bins |
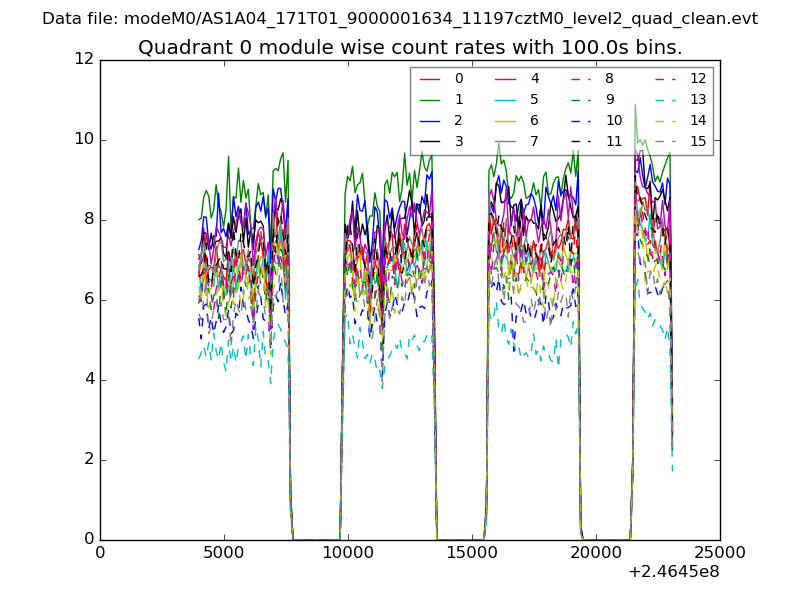 |
 |
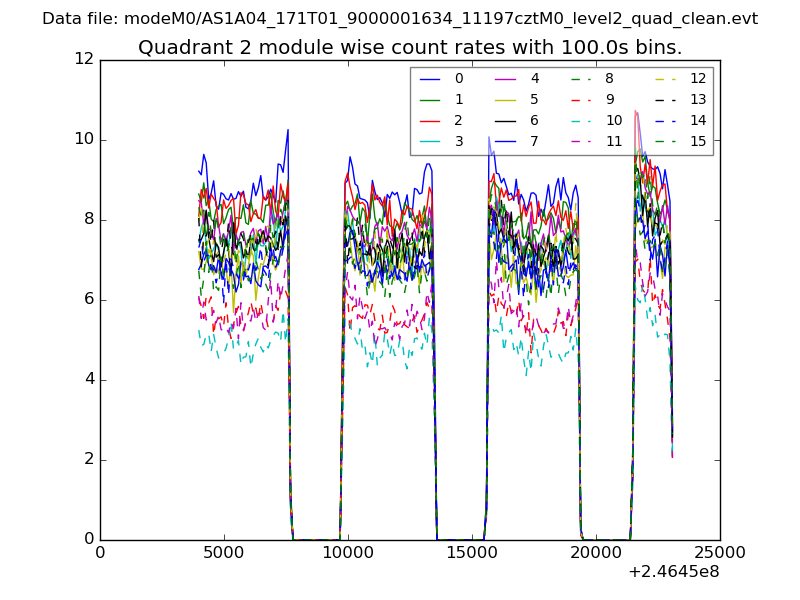
| Module-wise count rates for Quadrant B Data is divided into 100 sec bins |
 |
 |
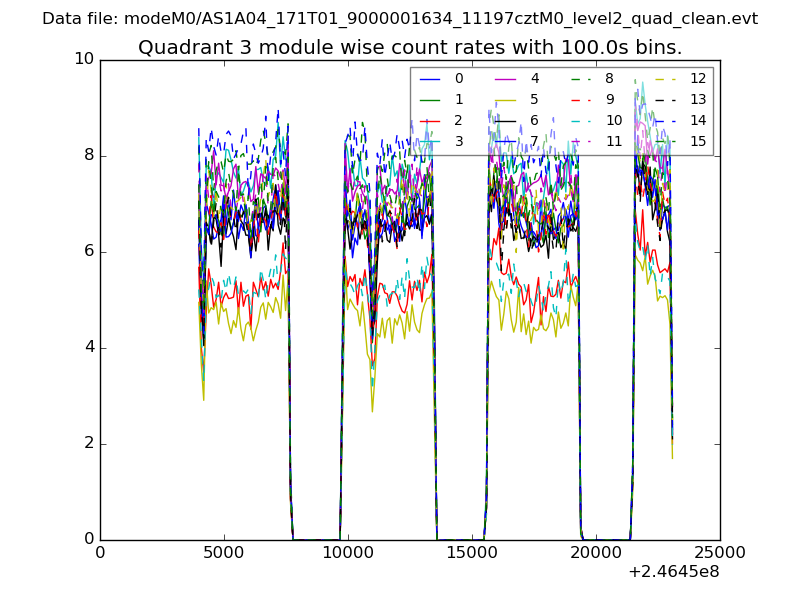
| Module-wise count rates for Quadrant C Data is divided into 100 sec bins |
 |
 |
| Module-wise count rates for Quadrant D Data is divided into 100 sec bins |
 |
 |
| Parameter | Plot |
|---|---|
| CZT HV Monitor | 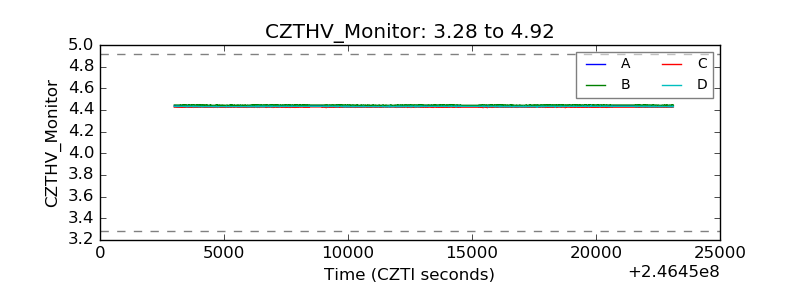 |
| D_VDD | 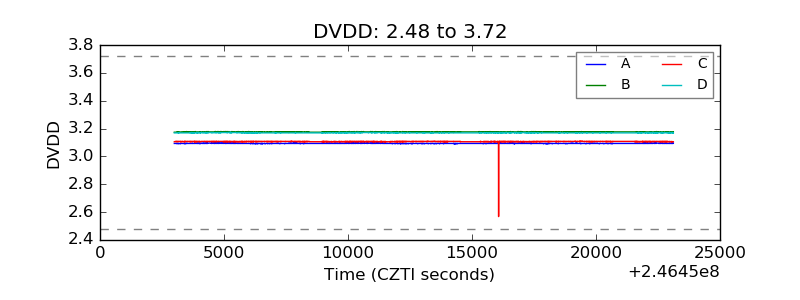 |
| Temperature 1 | 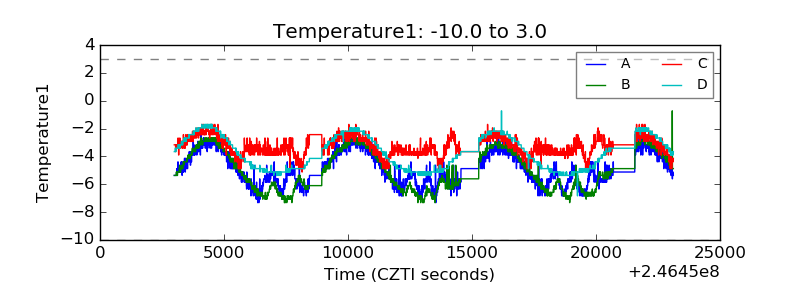 |
| Veto HV Monitor |  |
| Veto LLD | 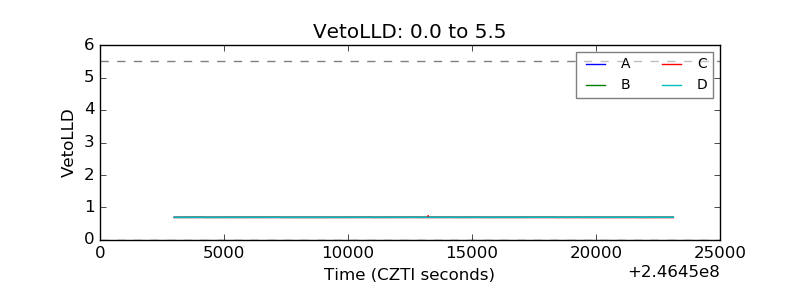 |
| Alpha Counter | 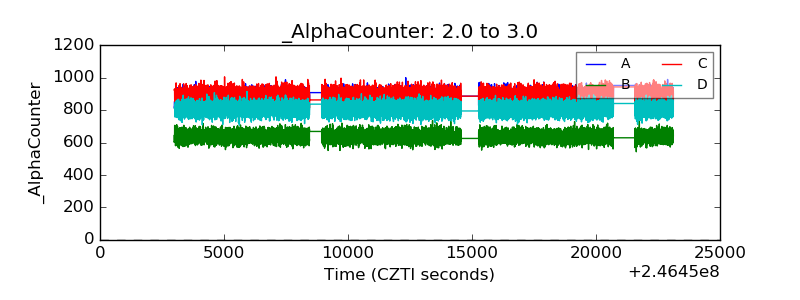 |
| _CPM_Rate | 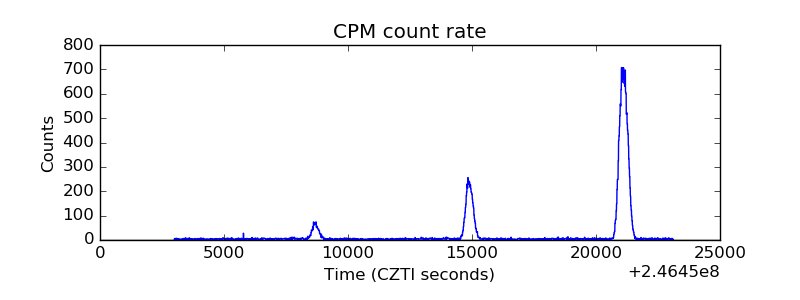 |
| CZT Counter | 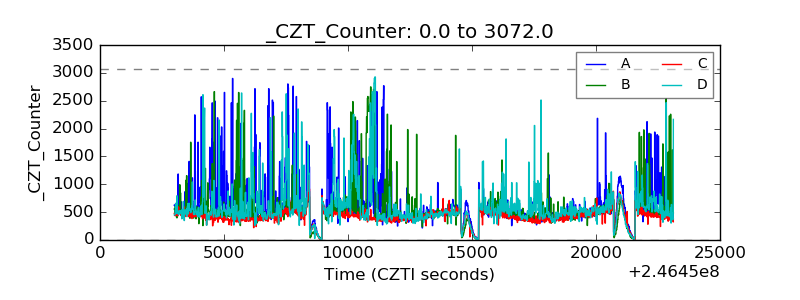 |
| +2.5 Volts monitor |  |
| +5 Volts monitor |  |
| _ROLL_ROT |  |
| _Roll_DEC | 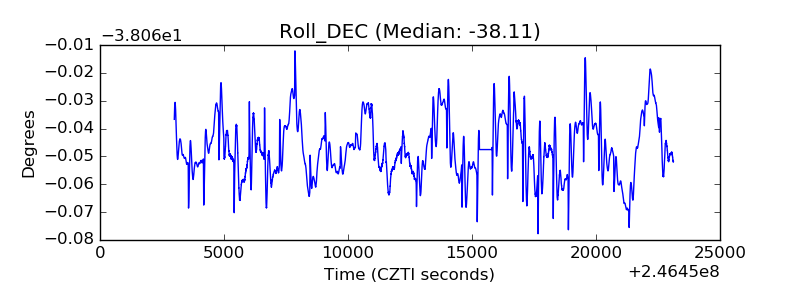 |
| _Roll_RA | 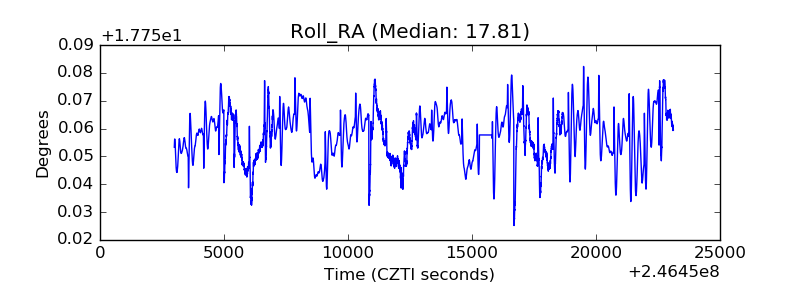 |
| Veto Counter | 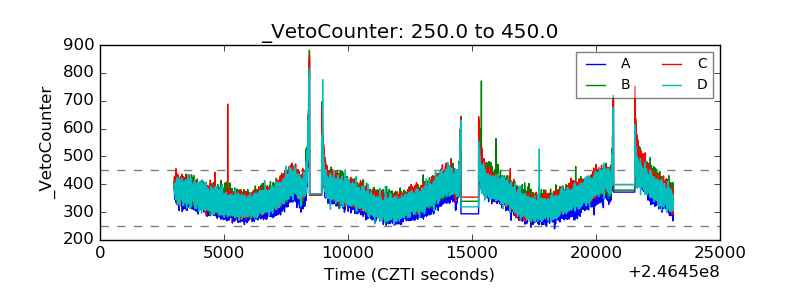 |