| Param | Original file | Final file |
|---|---|---|
| Filename | modeM0/AS1A04_171T01_9000001634_11198cztM0_level2.evt | modeM0/AS1A04_171T01_9000001634_11198cztM0_level2_quad_clean.evt |
| Size (bytes) | 554,976,000 | 96,140,160 |
| Size | 529.3 MB | 91.7 MB |
| Events in quadrant A | 4,780,202 | 612,642 |
| Events in quadrant B | 4,427,602 | 620,628 |
| Events in quadrant C | 2,984,190 | 620,909 |
| Events in quadrant D | 4,157,067 | 585,791 |
| Mode SS | |||
|---|---|---|---|
| Quadrant | BADHDUFLAG | Total packets | Discarded packets |
| A | 0 | 138 | 0 |
| B | 0 | 138 | 0 |
| C | 0 | 138 | 0 |
| D | 0 | 138 | 0 |
| Mode M0 | |||
|---|---|---|---|
| Quadrant | BADHDUFLAG | Total packets | Discarded packets |
| A | 0 | 18797 | 3 |
| B | 0 | 17652 | 2 |
| C | 0 | 13740 | 2 |
| D | 0 | 16926 | 2 |
| Mode M9 | |||
|---|---|---|---|
| Quadrant | BADHDUFLAG | Total packets | Discarded packets |
| A | 0 | 10 | 0 |
| B | 0 | 10 | 0 |
| C | 0 | 10 | 0 |
| D | 0 | 10 | 0 |
| Quadrant | Total seconds | Saturated seconds | Saturation percentage |
|---|---|---|---|
| A | 6760 | 398 | 5.887574% |
| B | 6760 | 375 | 5.547337% |
| C | 6760 | 13 | 0.192308% |
| D | 6761 | 104 | 1.538234% |
Noise dominated data is calculated using 1-second bins in cleaned event files. If a bin has >2000 counts, and if more than 50% of those come from <1% of pixels, then it is considered to be noise-dominated and hence unusable.
| Quadrant | # 1 sec bins | Bins with >0 counts | Bins with >2000 counts | High rate bins dominated by noise | Noise dominated (total time) | Noise dominated (detector-on time) | Marked lightcurve |
|---|---|---|---|---|---|---|---|
| A | 7755 | 6761 | 292 | 292 | 3.77% | 4.32% | 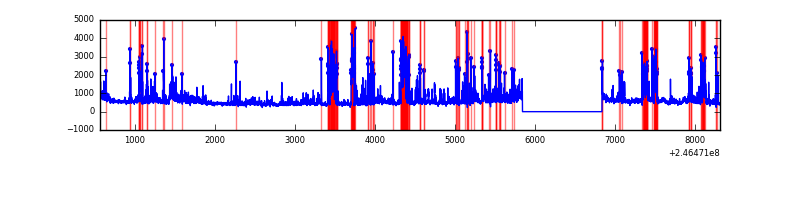 |
| B | 7755 | 6761 | 213 | 213 | 2.75% | 3.15% | 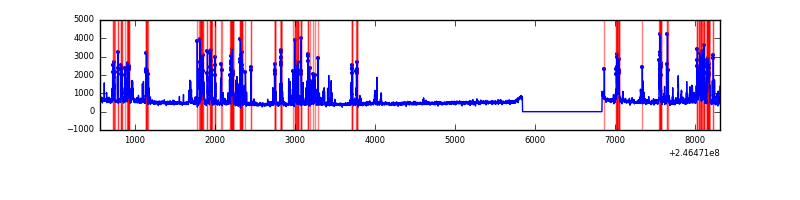 |
| C | 7755 | 6761 | 0 | 0 | 0.00% | 0.00% | 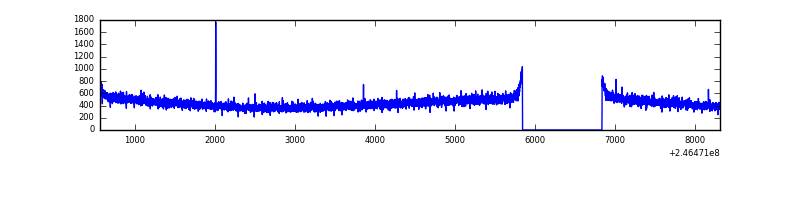 |
| D | 7756 | 6762 | 61 | 61 | 0.79% | 0.90% | 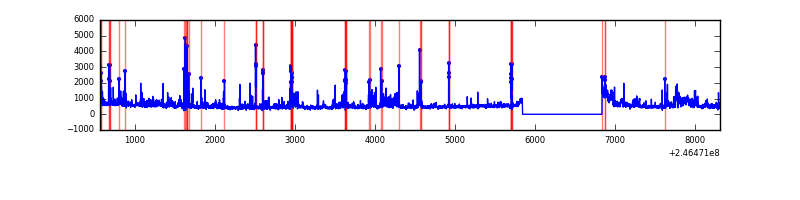 |
Top three noisy pixels from each quadrant. If the there are fewer than three noisy pixels in the level2.evt file, extra rows are filled as -1
| Pixel properties | Quadrant properties | ||||||
|---|---|---|---|---|---|---|---|
| Quadrant | DetID | PixID | Counts | Sigma | Mean | Median | Sigma |
| A | 15 | 239 | 1309922 | 8250.31 | 778 | 762 | 158.7 |
| A | 8 | 5 | 306232 | 1925.07 | 778 | 762 | 158.7 |
| A | 8 | 15 | 138296 | 866.74 | 778 | 762 | 158.7 |
| B | 4 | 239 | 1221215 | 8029.25 | 786 | 767 | 152.0 |
| B | 15 | 204 | 59337 | 385.33 | 786 | 767 | 152.0 |
| B | 11 | 51 | 55294 | 358.73 | 786 | 767 | 152.0 |
| C | 13 | 61 | 5528 | 26.59 | 764 | 768 | 179.0 |
| C | 12 | 4 | 4620 | 21.52 | 764 | 768 | 179.0 |
| C | 3 | 202 | 1918 | 6.43 | 764 | 768 | 179.0 |
| D | 13 | 152 | 418864 | 2313.05 | 752 | 731 | 180.8 |
| D | 1 | 52 | 389307 | 2149.54 | 752 | 731 | 180.8 |
| D | 8 | 195 | 168054 | 925.6 | 752 | 731 | 180.8 |
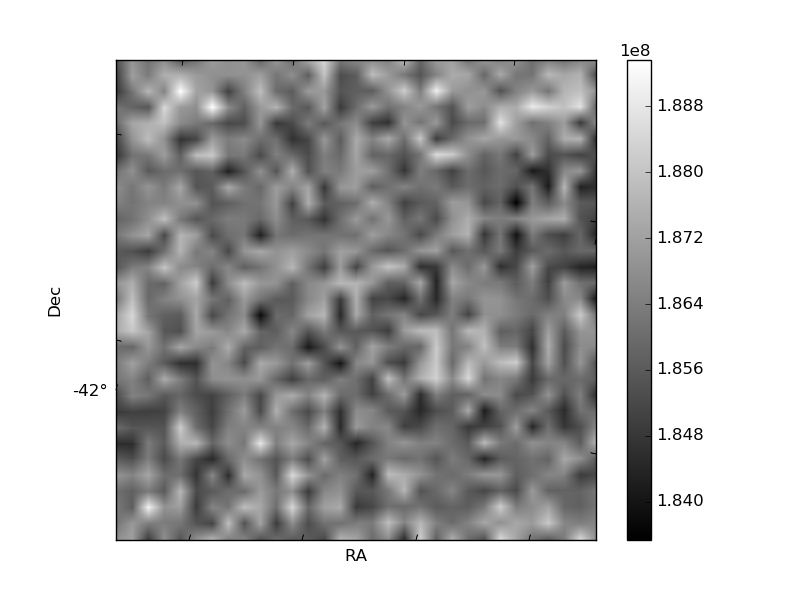
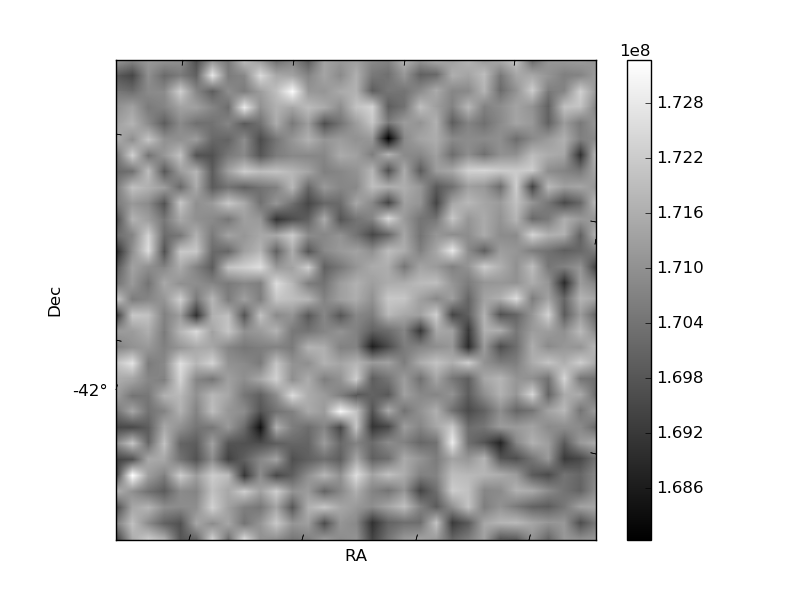
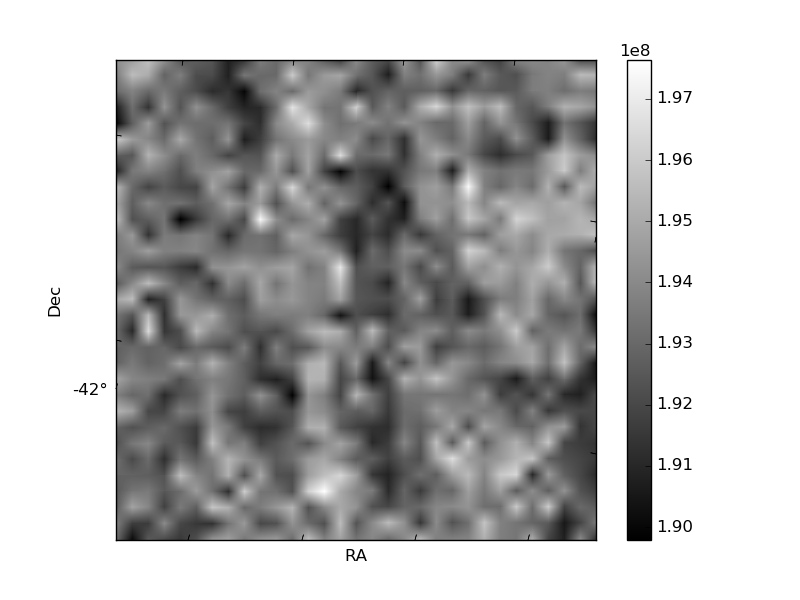
Histogram calculated using DETX and DETY for each event in the final _common_clean file
| Quadrant A |  |
 |
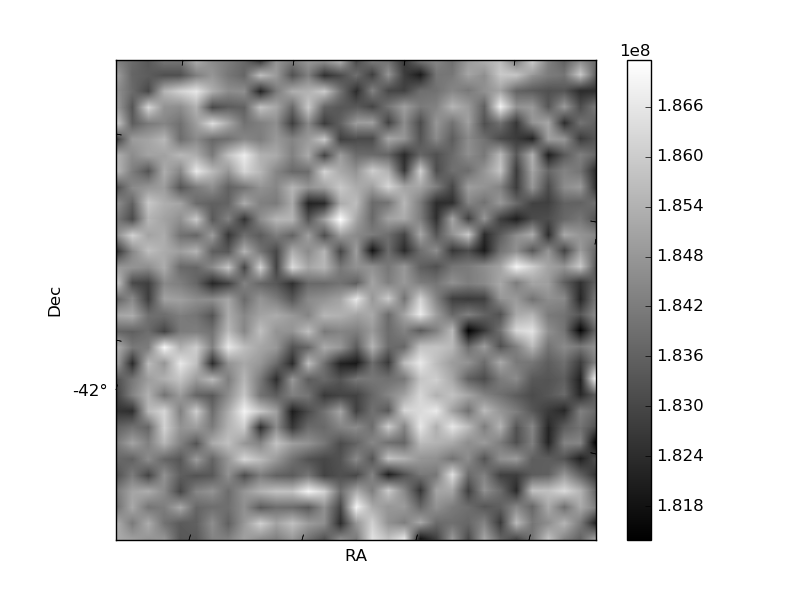
Quadrant B |
|---|---|---|---|
| Quadrant D |  |
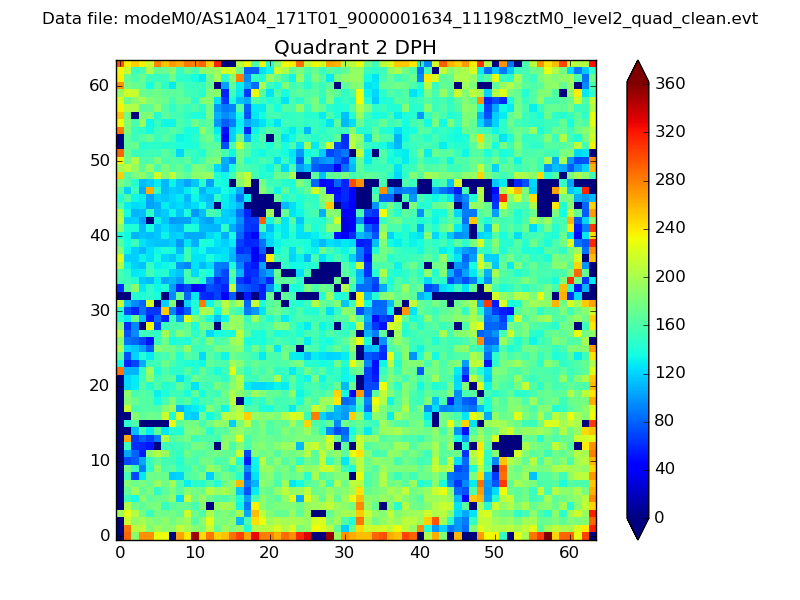 |
Quadrant C |
| Plot type | Count rate plots | Images |
|---|---|---|
| Comparison with Poisson distribution Blue bars denote a histogram of data divided into 1 sec bins. Red curve is a Poisson curve with rate = median count rate of data. |
 |
 |
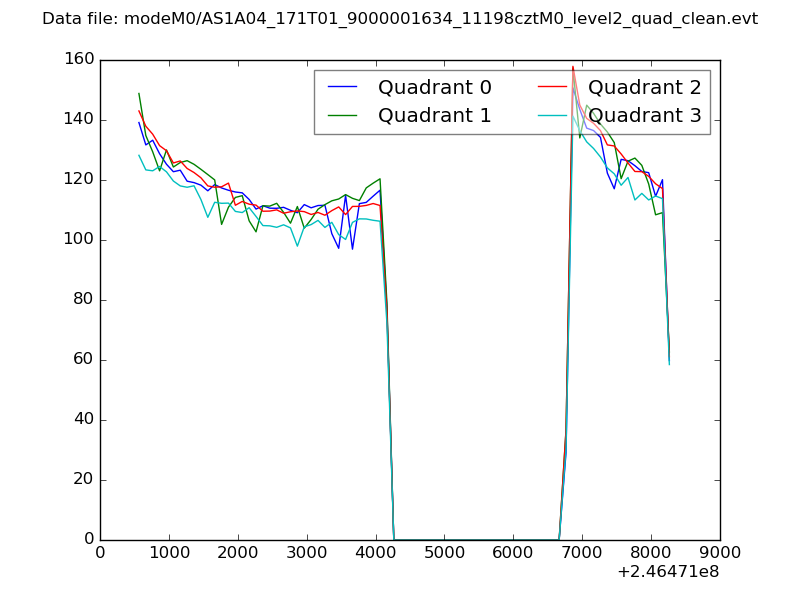
| Quadrant-wise count rates Data is divided into 100 sec bins |
 |
|
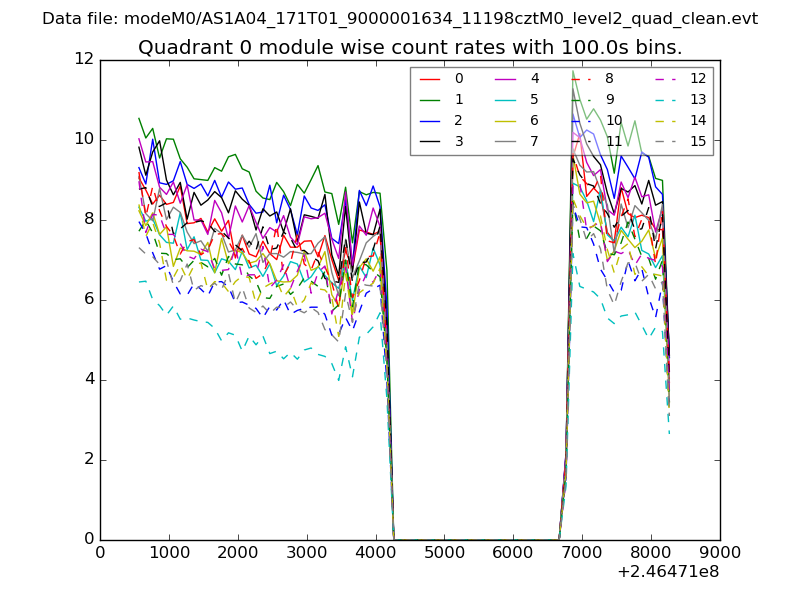
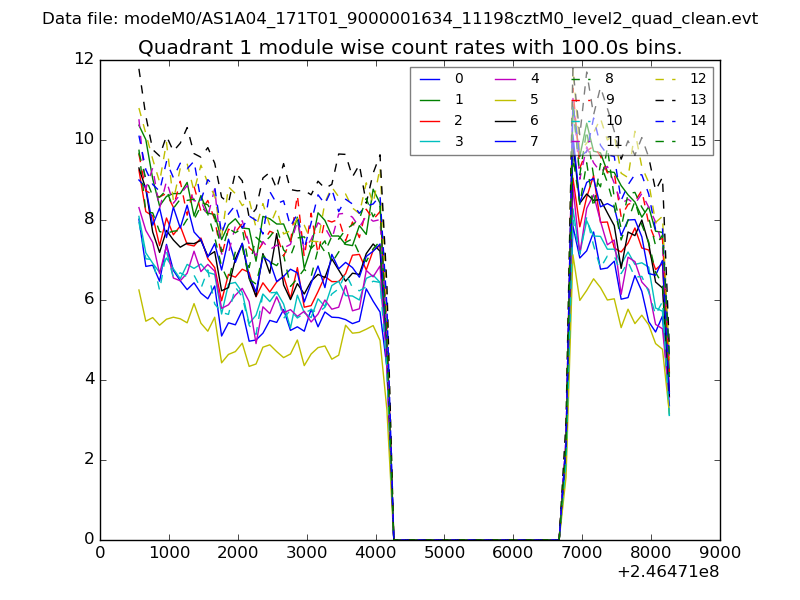
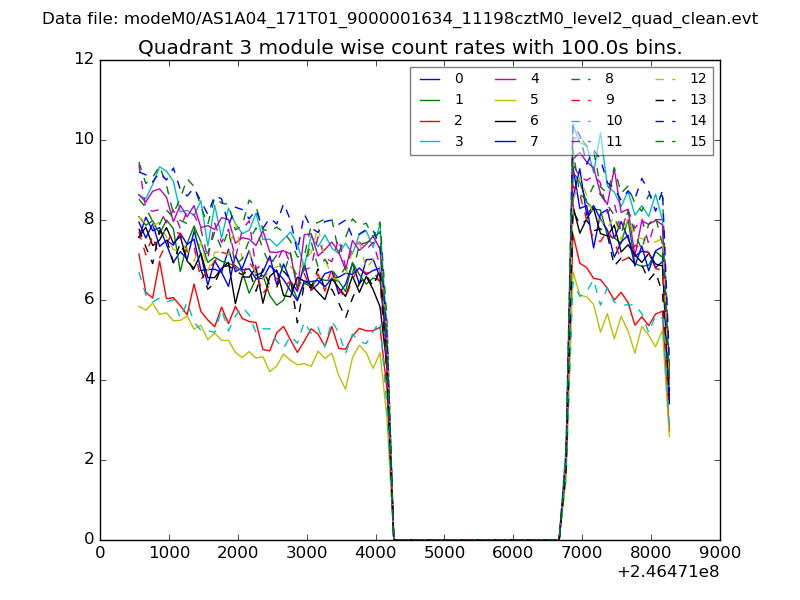
| Module-wise count rates for Quadrant A Data is divided into 100 sec bins |
 |
 |
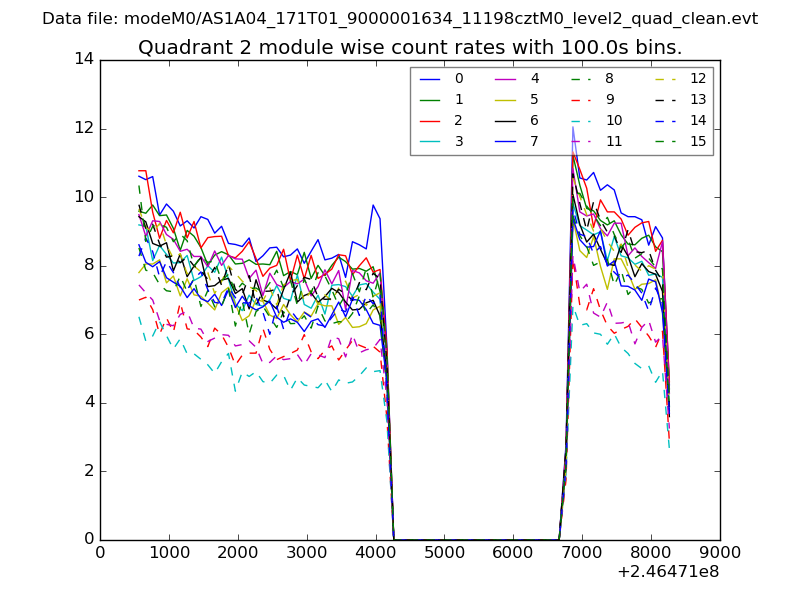
| Module-wise count rates for Quadrant B Data is divided into 100 sec bins |
 |
 |
| Module-wise count rates for Quadrant C Data is divided into 100 sec bins |
 |
 |
| Module-wise count rates for Quadrant D Data is divided into 100 sec bins |
 |
 |
| Parameter | Plot |
|---|---|
| CZT HV Monitor | 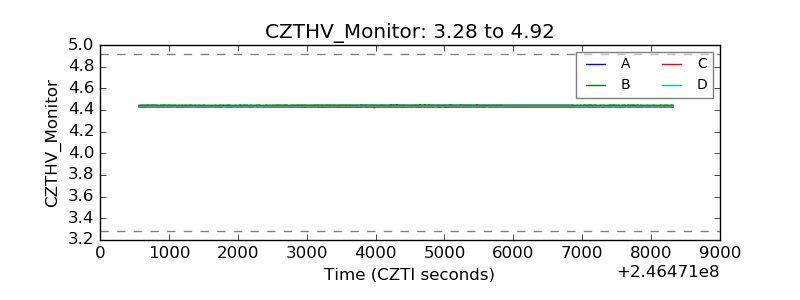 |
| D_VDD | 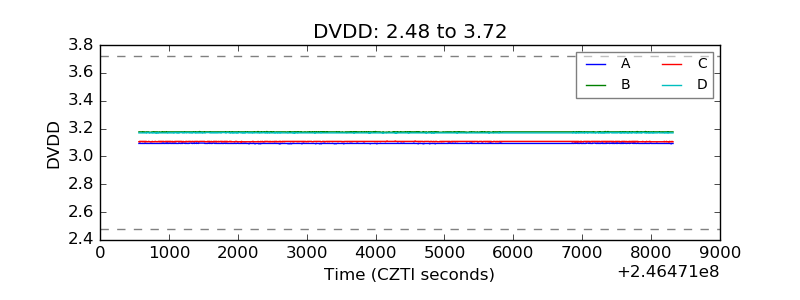 |
| Temperature 1 | 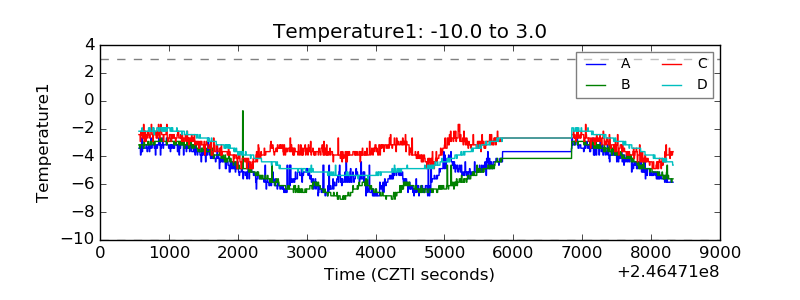 |
| Veto HV Monitor | 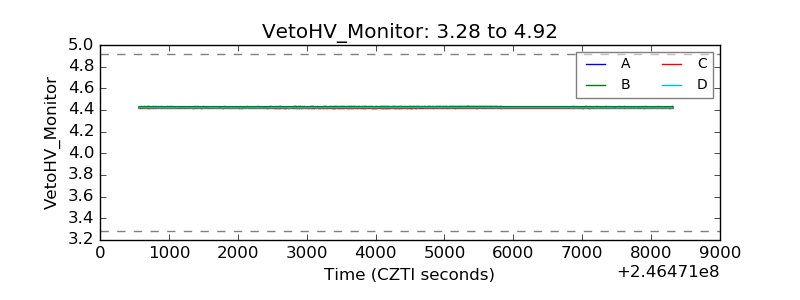 |
| Veto LLD | 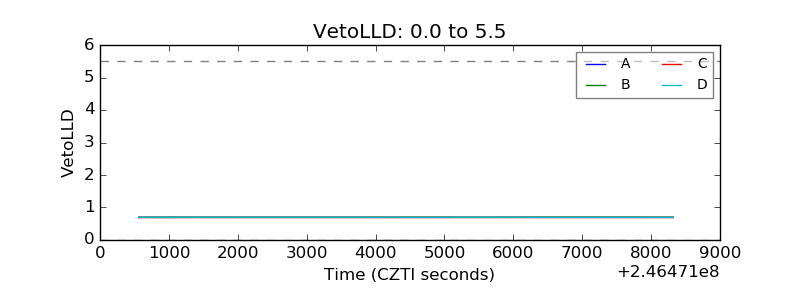 |
| Alpha Counter | 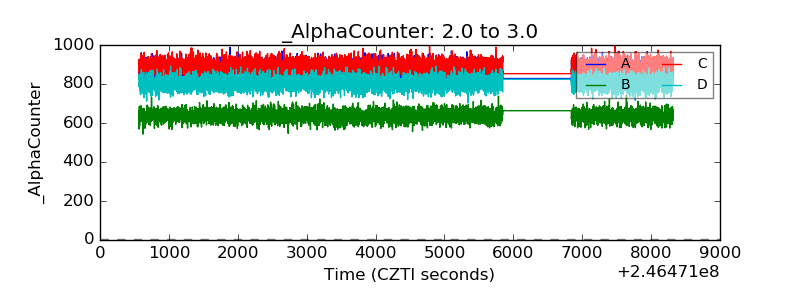 |
| _CPM_Rate | 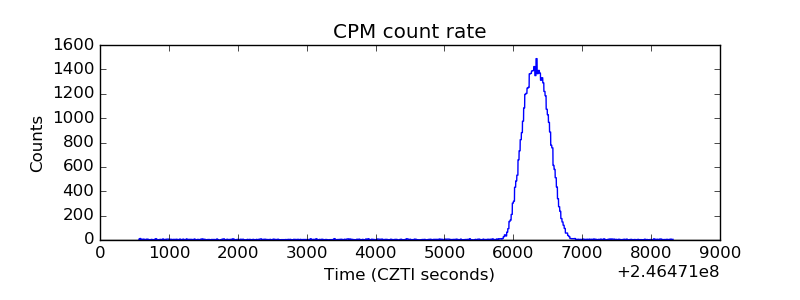 |
| CZT Counter | 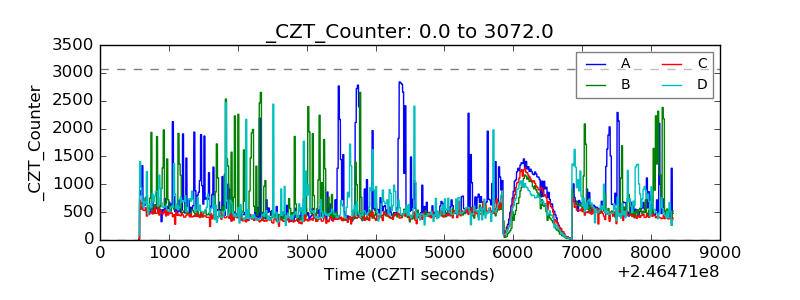 |
| +2.5 Volts monitor |  |
| +5 Volts monitor | 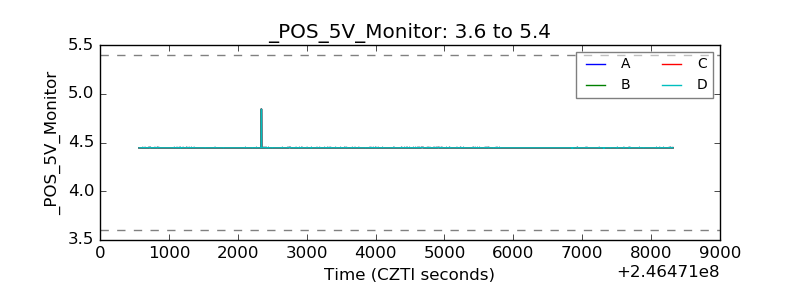 |
| _ROLL_ROT | 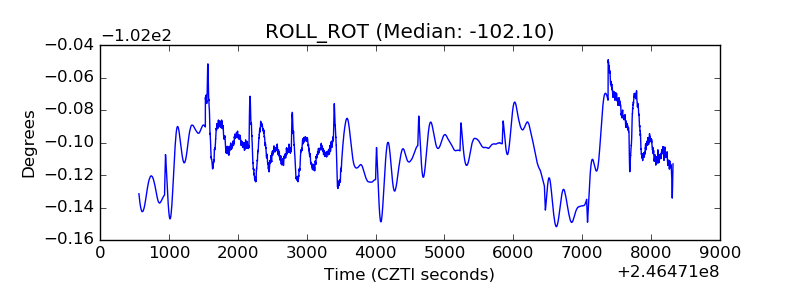 |
| _Roll_DEC | 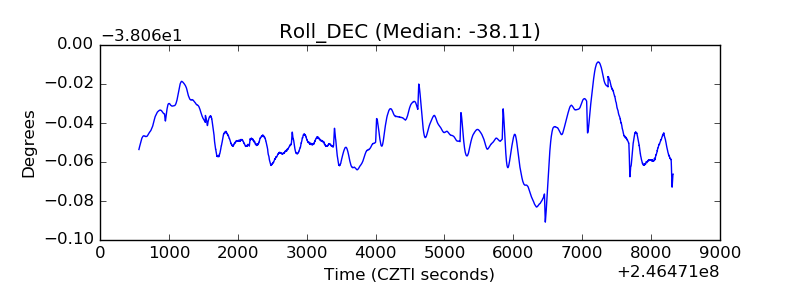 |
| _Roll_RA | 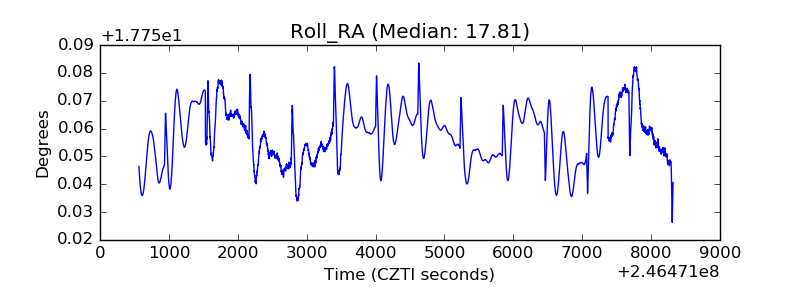 |
| Veto Counter | 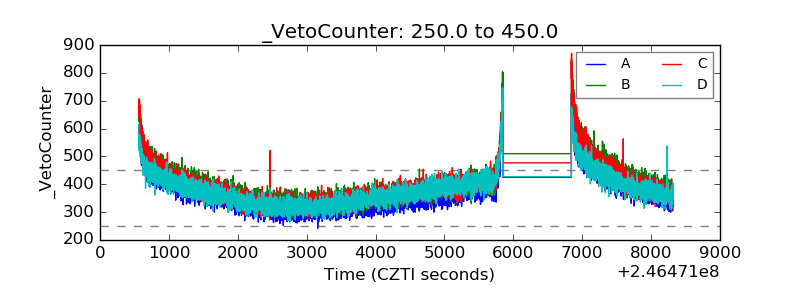 |