| Param | Original file | Final file |
|---|---|---|
| Filename | modeM0/AS1A04_171T01_9000001634_11201cztM0_level2.evt | modeM0/AS1A04_171T01_9000001634_11201cztM0_level2_quad_clean.evt |
| Size (bytes) | 222,439,680 | 32,198,400 |
| Size | 212.1 MB | 30.7 MB |
| Events in quadrant A | 1,717,039 | 199,848 |
| Events in quadrant B | 1,504,008 | 216,119 |
| Events in quadrant C | 1,083,664 | 214,162 |
| Events in quadrant D | 2,280,965 | 185,858 |
| Mode SS | |||
|---|---|---|---|
| Quadrant | BADHDUFLAG | Total packets | Discarded packets |
| A | 0 | 50 | 4 |
| B | 0 | 50 | 4 |
| C | 0 | 50 | 2 |
| D | 0 | 52 | 6 |
| Mode M0 | |||
|---|---|---|---|
| Quadrant | BADHDUFLAG | Total packets | Discarded packets |
| A | 0 | 7223 | 621 |
| B | 0 | 6320 | 444 |
| C | 0 | 5023 | 445 |
| D | 0 | 9719 | 1503 |
| Mode M9 | |||
|---|---|---|---|
| Quadrant | BADHDUFLAG | Total packets | Discarded packets |
| A | 0 | 12 | 0 |
| B | 0 | 12 | 0 |
| C | 0 | 12 | 0 |
| D | 0 | 12 | 0 |
| Quadrant | Total seconds | Saturated seconds | Saturation percentage |
|---|---|---|---|
| A | 2185 | 149 | 6.819222% |
| B | 2202 | 94 | 4.268847% |
| C | 2205 | 7 | 0.317460% |
| D | 2178 | 440 | 20.202020% |
Noise dominated data is calculated using 1-second bins in cleaned event files. If a bin has >2000 counts, and if more than 50% of those come from <1% of pixels, then it is considered to be noise-dominated and hence unusable.
| Quadrant | # 1 sec bins | Bins with >0 counts | Bins with >2000 counts | High rate bins dominated by noise | Noise dominated (total time) | Noise dominated (detector-on time) | Marked lightcurve |
|---|---|---|---|---|---|---|---|
| A | 3573 | 2212 | 99 | 99 | 2.77% | 4.48% | 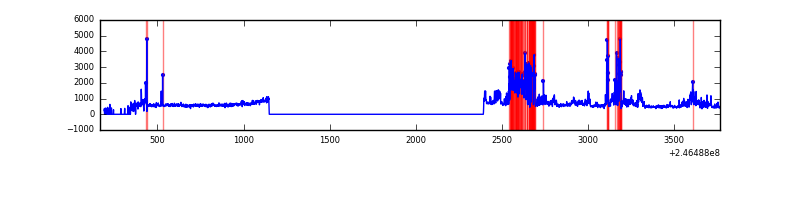 |
| B | 3598 | 2228 | 38 | 38 | 1.06% | 1.71% | 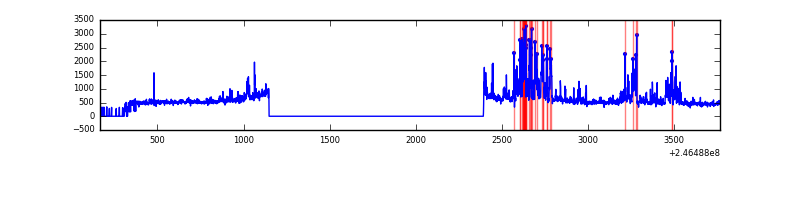 |
| C | 3590 | 2231 | 0 | 0 | 0.00% | 0.00% | 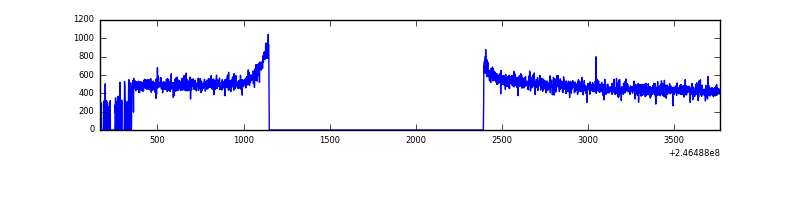 |
| D | 3519 | 2198 | 334 | 334 | 9.49% | 15.20% | 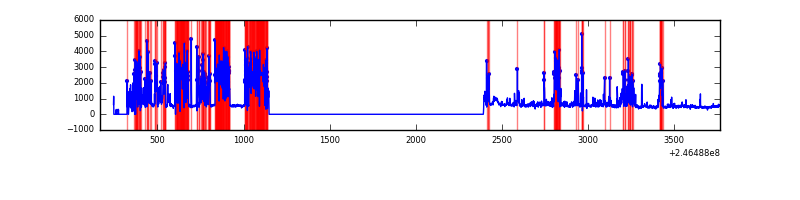 |
Top three noisy pixels from each quadrant. If the there are fewer than three noisy pixels in the level2.evt file, extra rows are filled as -1
| Pixel properties | Quadrant properties | ||||||
|---|---|---|---|---|---|---|---|
| Quadrant | DetID | PixID | Counts | Sigma | Mean | Median | Sigma |
| A | 15 | 239 | 327934 | 5657.57 | 275 | 269 | 57.9 |
| A | 8 | 5 | 200177 | 3451.68 | 275 | 269 | 57.9 |
| A | 8 | 15 | 109059 | 1878.4 | 275 | 269 | 57.9 |
| B | 4 | 239 | 294076 | 5226.59 | 286 | 279 | 56.2 |
| B | 15 | 204 | 25297 | 445.06 | 286 | 279 | 56.2 |
| B | 0 | 214 | 24013 | 422.22 | 286 | 279 | 56.2 |
| C | 13 | 61 | 1969 | 25.85 | 277 | 279 | 65.4 |
| C | 3 | 202 | 676 | 6.07 | 277 | 279 | 65.4 |
| C | 7 | 159 | 654 | 5.73 | 277 | 279 | 65.4 |
| D | 1 | 52 | 937649 | 15993.14 | 239 | 232 | 58.6 |
| D | 10 | 253 | 124464 | 2119.5 | 239 | 232 | 58.6 |
| D | 14 | 34 | 101255 | 1723.54 | 239 | 232 | 58.6 |
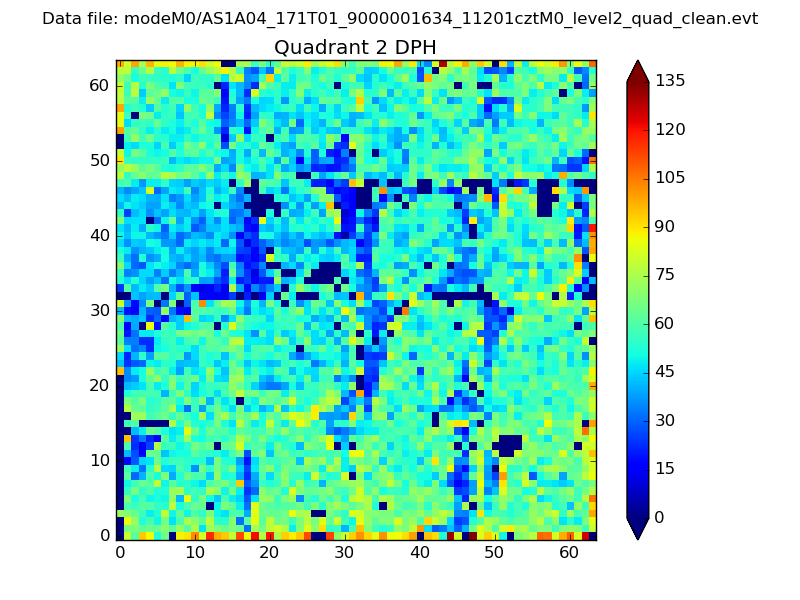
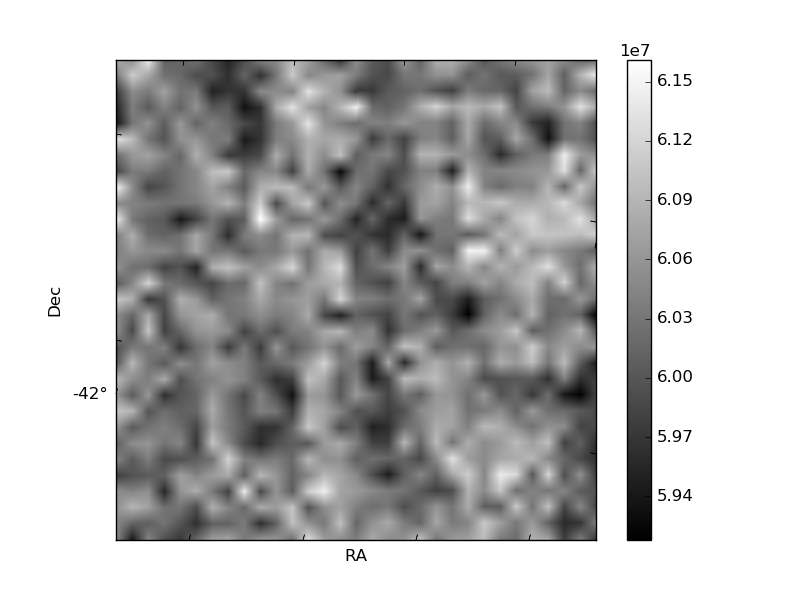
Histogram calculated using DETX and DETY for each event in the final _common_clean file
| Quadrant A | 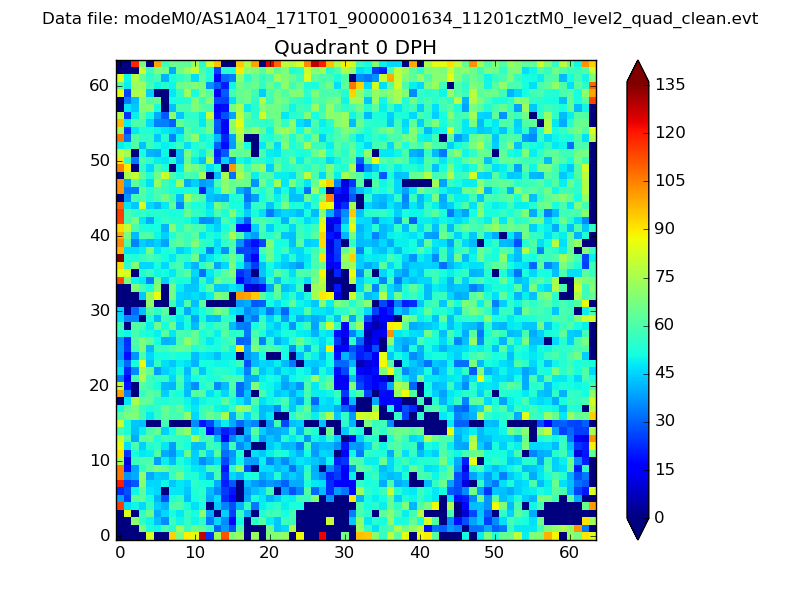 |
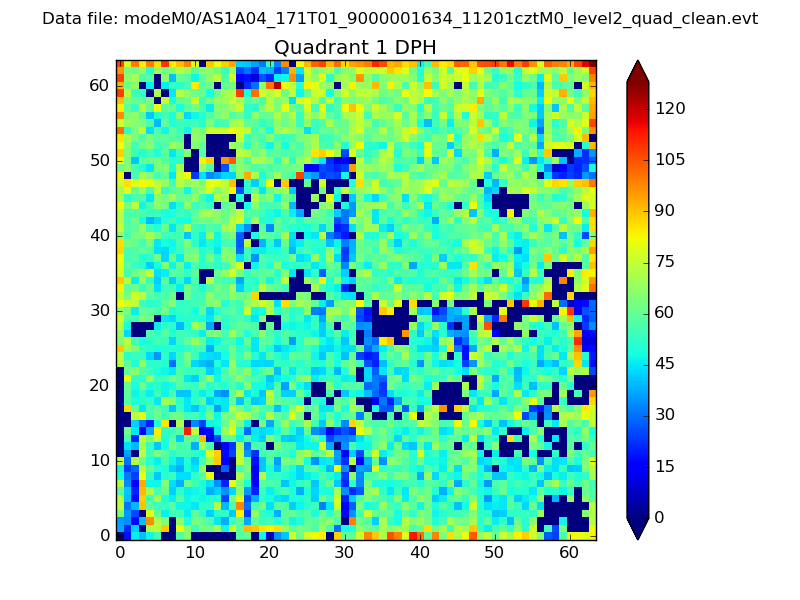 |
Quadrant B |
|---|---|---|---|
| Quadrant D | 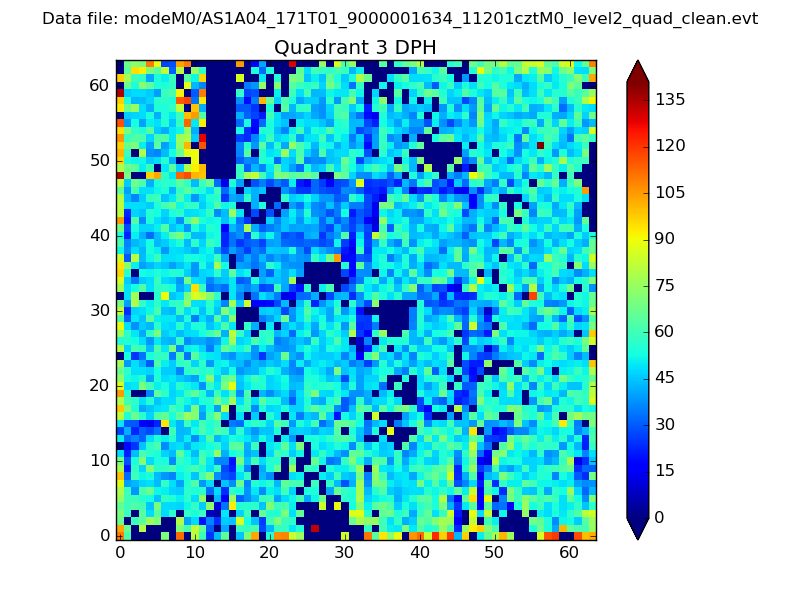 |
 |
Quadrant C |
| Plot type | Count rate plots | Images |
|---|---|---|
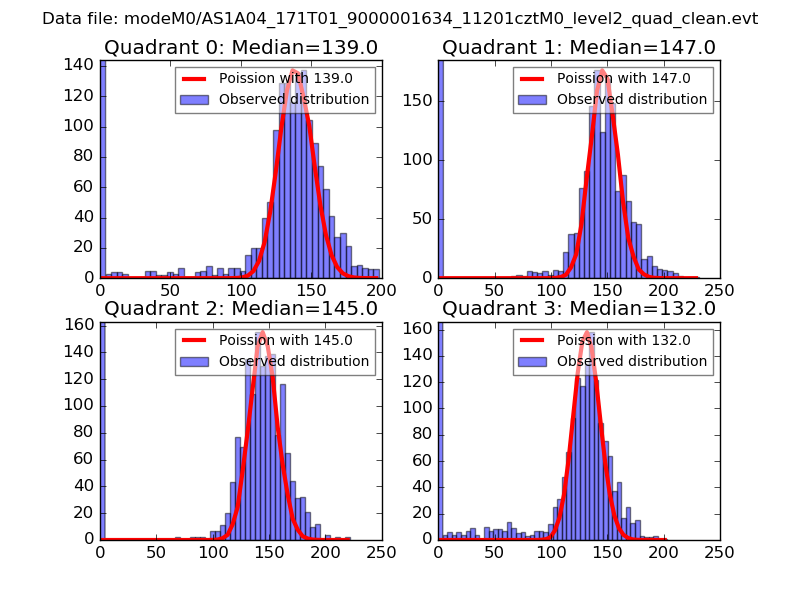
| Comparison with Poisson distribution Blue bars denote a histogram of data divided into 1 sec bins. Red curve is a Poisson curve with rate = median count rate of data. |
 |
 |
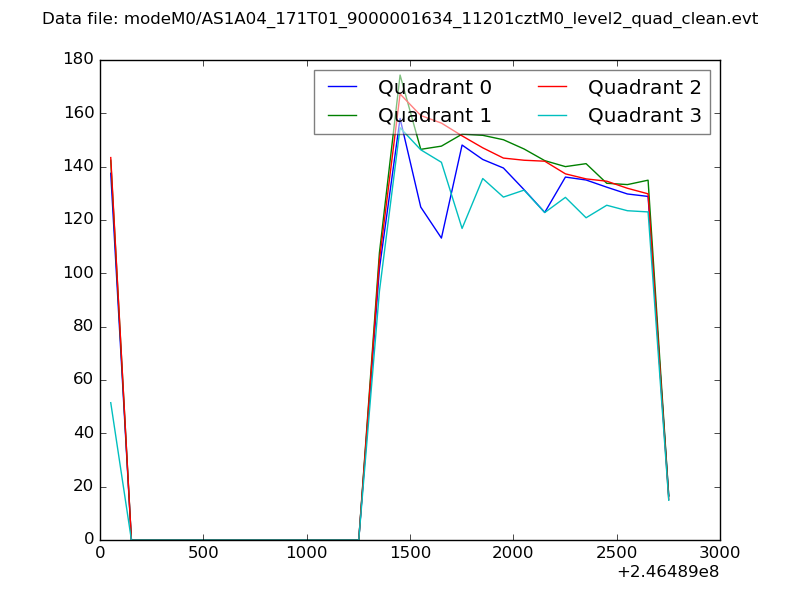
| Quadrant-wise count rates Data is divided into 100 sec bins |
 |
|
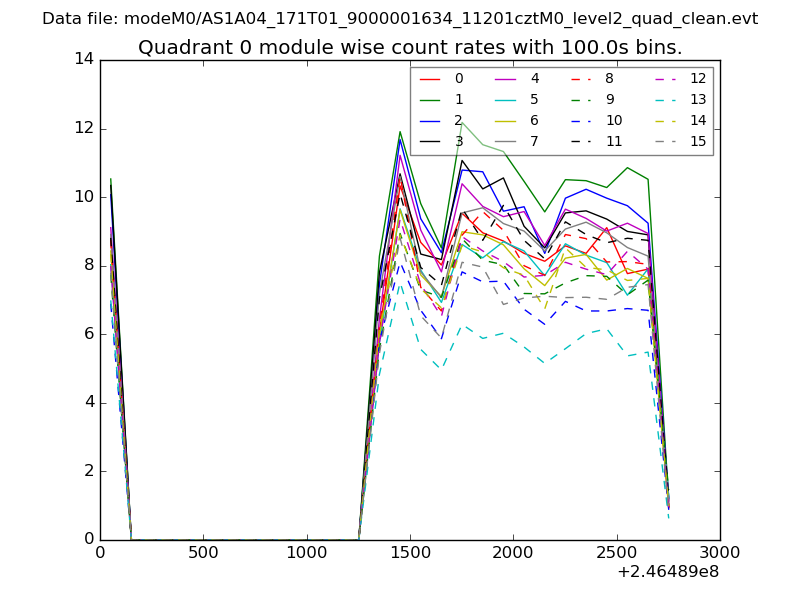
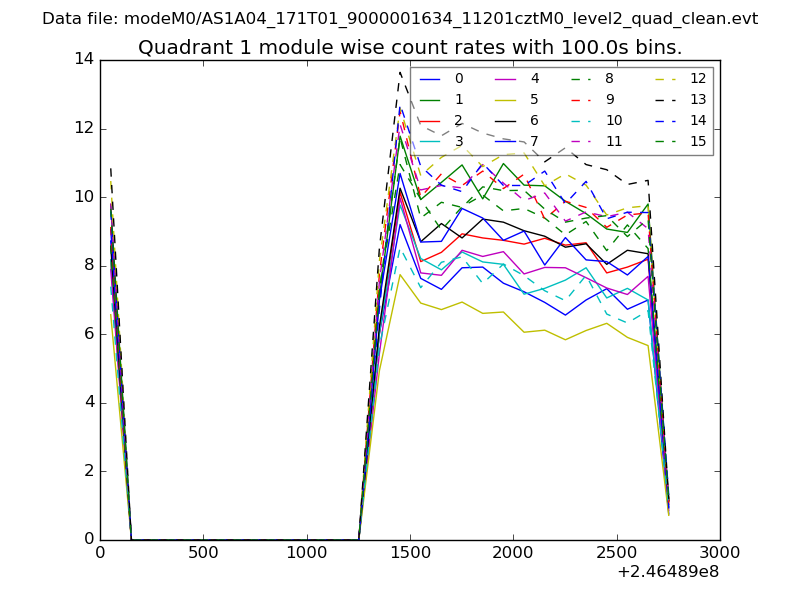
| Module-wise count rates for Quadrant A Data is divided into 100 sec bins |
 |
 |
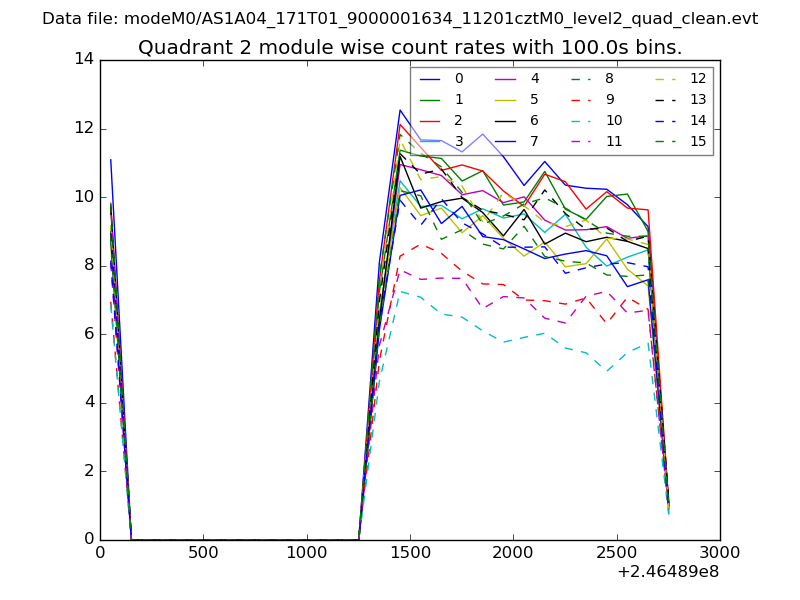
| Module-wise count rates for Quadrant B Data is divided into 100 sec bins |
 |
 |
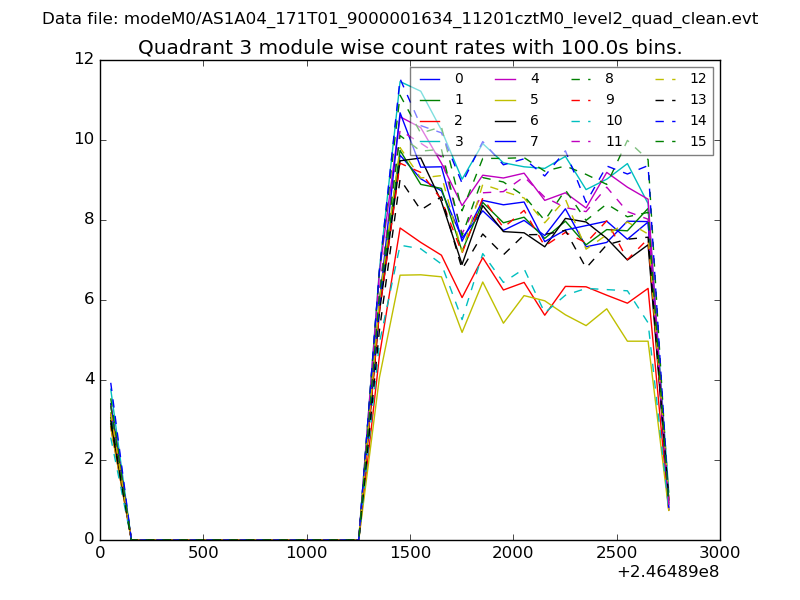
| Module-wise count rates for Quadrant C Data is divided into 100 sec bins |
 |
 |
| Module-wise count rates for Quadrant D Data is divided into 100 sec bins |
 |
 |
| Parameter | Plot |
|---|---|
| CZT HV Monitor | 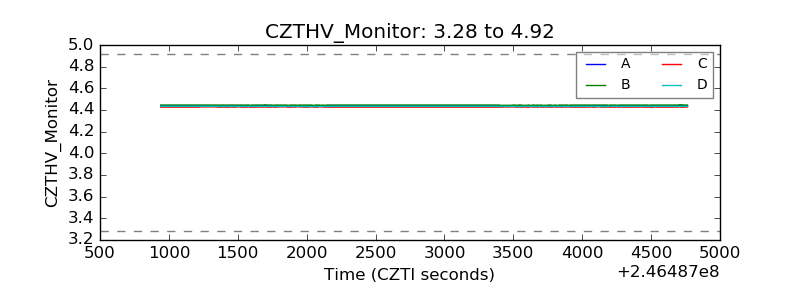 |
| D_VDD | 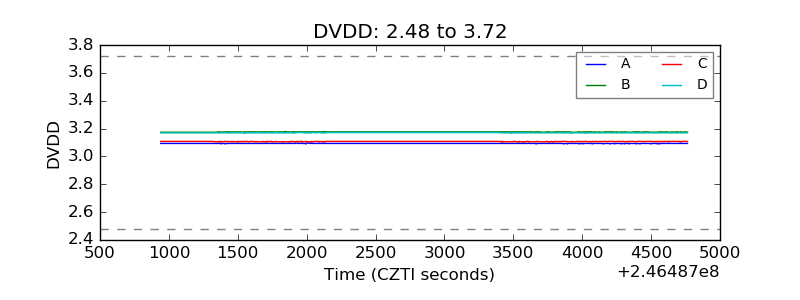 |
| Temperature 1 | 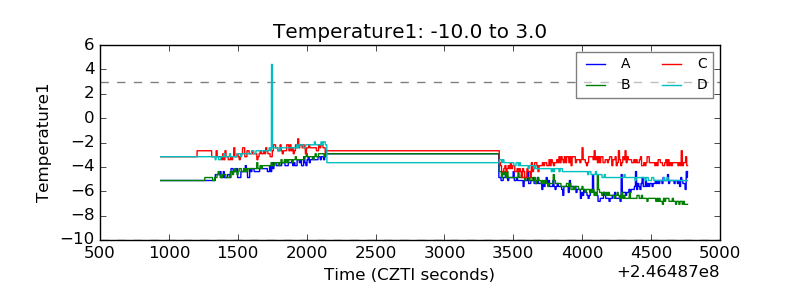 |
| Veto HV Monitor | 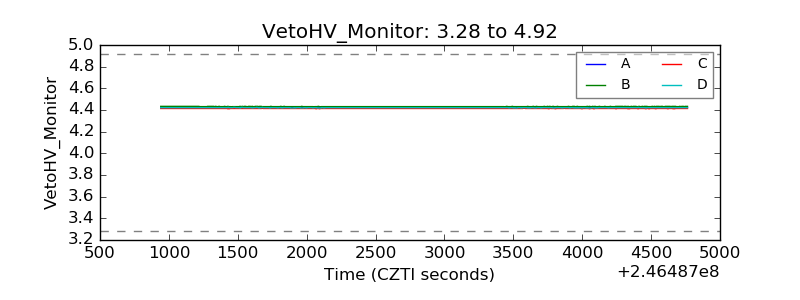 |
| Veto LLD | 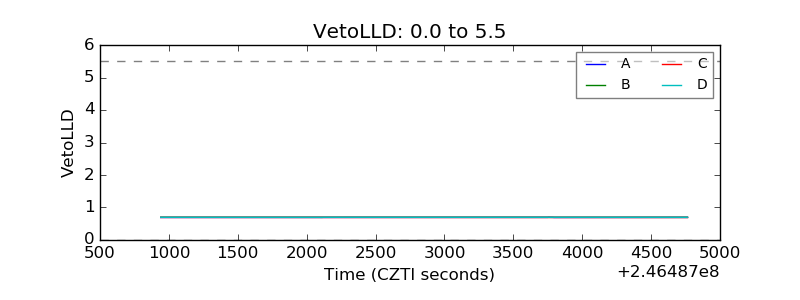 |
| Alpha Counter | 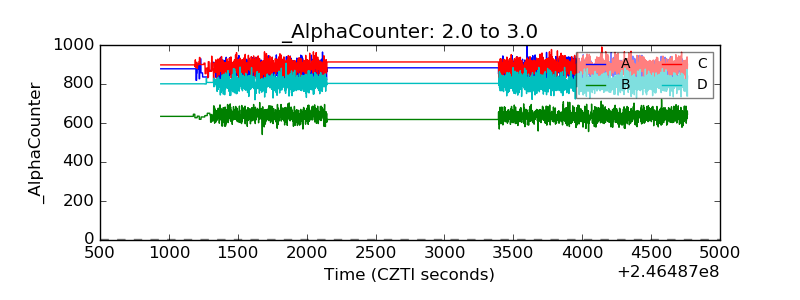 |
| _CPM_Rate | 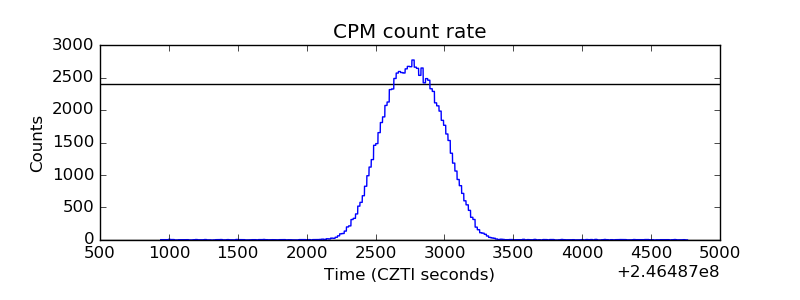 |
| CZT Counter | 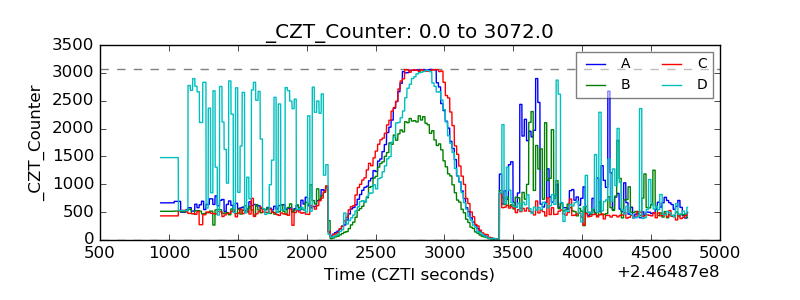 |
| +2.5 Volts monitor |  |
| +5 Volts monitor |  |
| _ROLL_ROT | 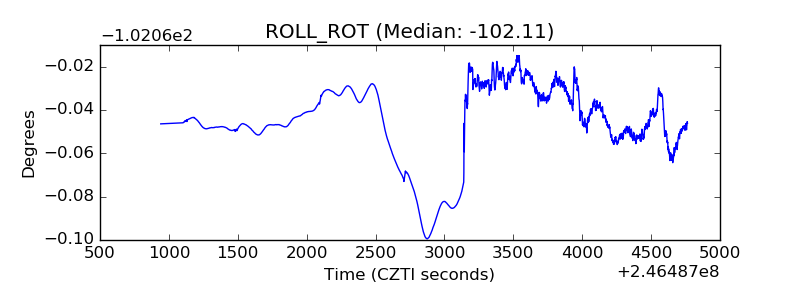 |
| _Roll_DEC | 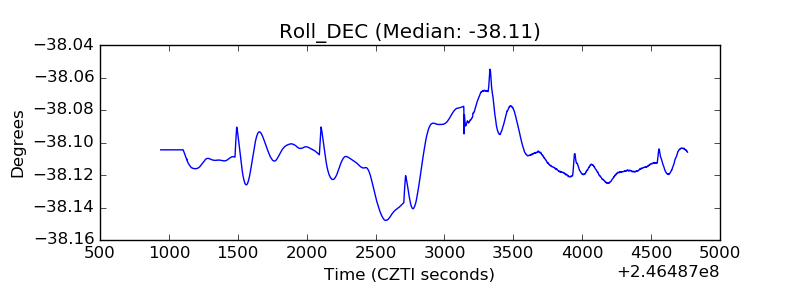 |
| _Roll_RA | 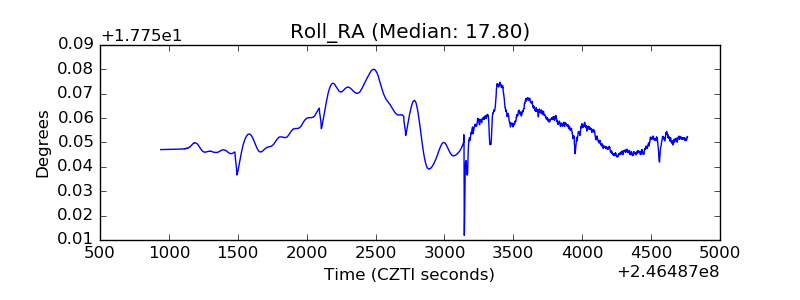 |
| Veto Counter |  |