| Param | Original file | Final file |
|---|---|---|
| Filename | modeM0/AS1A04_171T01_9000001634_11202cztM0_level2.evt | modeM0/AS1A04_171T01_9000001634_11202cztM0_level2_quad_clean.evt |
| Size (bytes) | 868,806,720 | 113,595,840 |
| Size | 828.6 MB | 108.3 MB |
| Events in quadrant A | 7,302,183 | 687,045 |
| Events in quadrant B | 5,652,363 | 732,161 |
| Events in quadrant C | 4,433,304 | 721,192 |
| Events in quadrant D | 8,277,287 | 635,438 |
| Mode SS | |||
|---|---|---|---|
| Quadrant | BADHDUFLAG | Total packets | Discarded packets |
| A | 0 | 196 | 0 |
| B | 0 | 196 | 0 |
| C | 0 | 196 | 0 |
| D | 0 | 196 | 0 |
| Mode M0 | |||
|---|---|---|---|
| Quadrant | BADHDUFLAG | Total packets | Discarded packets |
| A | 0 | 28148 | 3 |
| B | 0 | 23026 | 2 |
| C | 0 | 19529 | 6 |
| D | 0 | 31219 | 27 |
| Mode M9 | |||
|---|---|---|---|
| Quadrant | BADHDUFLAG | Total packets | Discarded packets |
| A | 0 | 25 | 1 |
| B | 0 | 25 | 0 |
| C | 0 | 25 | 0 |
| D | 0 | 25 | 1 |
| Quadrant | Total seconds | Saturated seconds | Saturation percentage |
|---|---|---|---|
| A | 9571 | 552 | 5.767422% |
| B | 9575 | 311 | 3.248042% |
| C | 9574 | 11 | 0.114895% |
| D | 9571 | 1173 | 12.255773% |
Noise dominated data is calculated using 1-second bins in cleaned event files. If a bin has >2000 counts, and if more than 50% of those come from <1% of pixels, then it is considered to be noise-dominated and hence unusable.
| Quadrant | # 1 sec bins | Bins with >0 counts | Bins with >2000 counts | High rate bins dominated by noise | Noise dominated (total time) | Noise dominated (detector-on time) | Marked lightcurve |
|---|---|---|---|---|---|---|---|
| A | 12132 | 9574 | 332 | 332 | 2.74% | 3.47% | 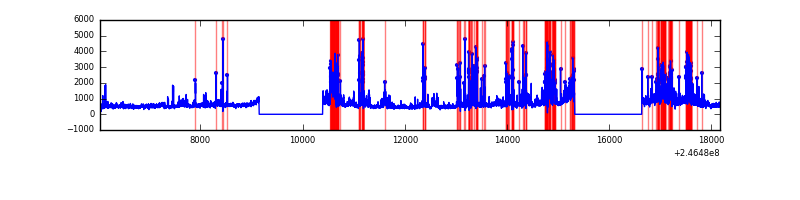 |
| B | 12135 | 9577 | 131 | 131 | 1.08% | 1.37% | 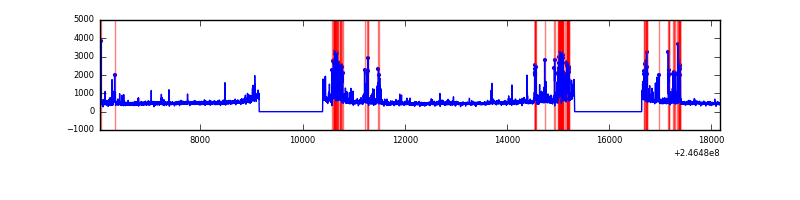 |
| C | 12135 | 9577 | 0 | 0 | 0.00% | 0.00% | 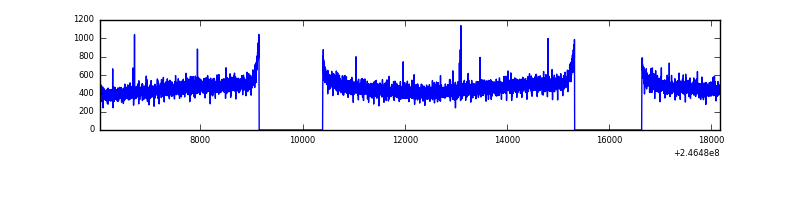 |
| D | 12132 | 9574 | 941 | 941 | 7.76% | 9.83% | 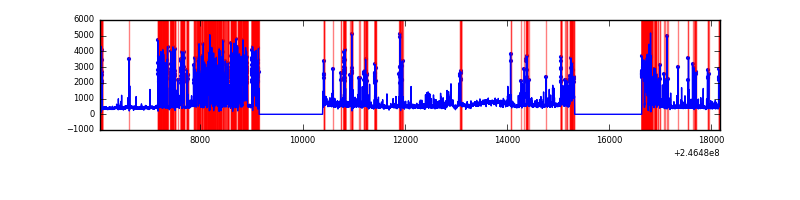 |
Top three noisy pixels from each quadrant. If the there are fewer than three noisy pixels in the level2.evt file, extra rows are filled as -1
| Pixel properties | Quadrant properties | ||||||
|---|---|---|---|---|---|---|---|
| Quadrant | DetID | PixID | Counts | Sigma | Mean | Median | Sigma |
| A | 15 | 239 | 1034741 | 4550.08 | 1123 | 1099 | 227.2 |
| A | 8 | 5 | 908474 | 3994.26 | 1123 | 1099 | 227.2 |
| A | 8 | 15 | 787871 | 3463.36 | 1123 | 1099 | 227.2 |
| B | 4 | 239 | 839634 | 3850.67 | 1158 | 1129 | 217.8 |
| B | 15 | 204 | 75081 | 339.61 | 1158 | 1129 | 217.8 |
| B | 3 | 189 | 59780 | 269.34 | 1158 | 1129 | 217.8 |
| C | 13 | 61 | 8274 | 27.36 | 1135 | 1143 | 260.7 |
| C | 7 | 222 | 5104 | 15.2 | 1135 | 1143 | 260.7 |
| C | 14 | 234 | 3880 | 10.5 | 1135 | 1143 | 260.7 |
| D | 1 | 52 | 2908645 | 11730.78 | 1042 | 1015 | 247.9 |
| D | 13 | 152 | 444255 | 1788.24 | 1042 | 1015 | 247.9 |
| D | 10 | 253 | 285500 | 1147.75 | 1042 | 1015 | 247.9 |
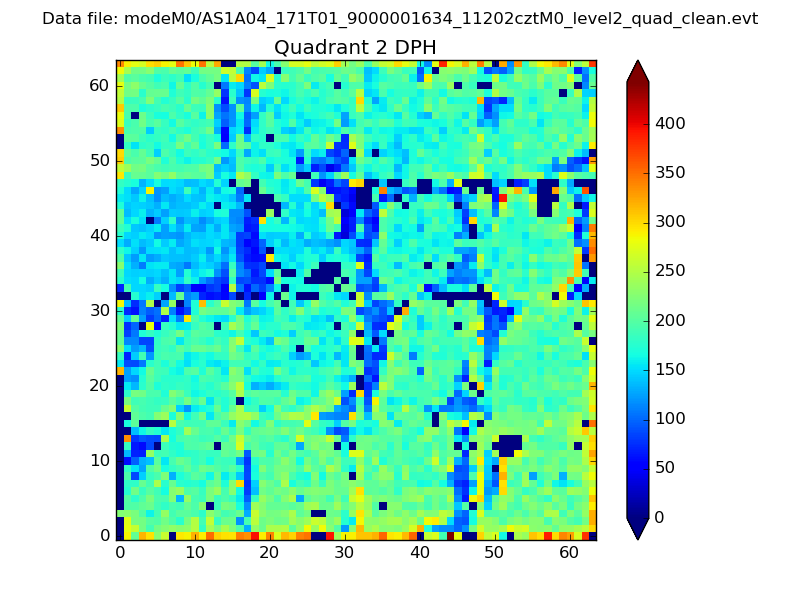
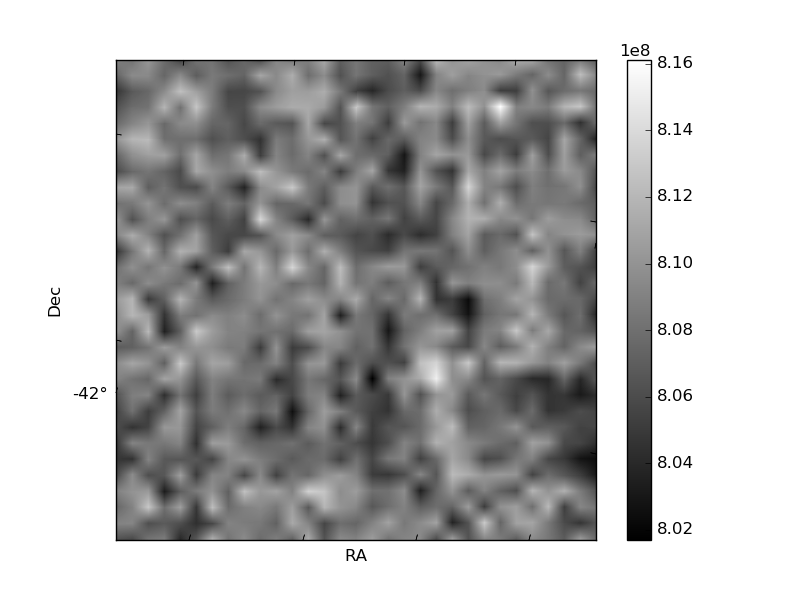
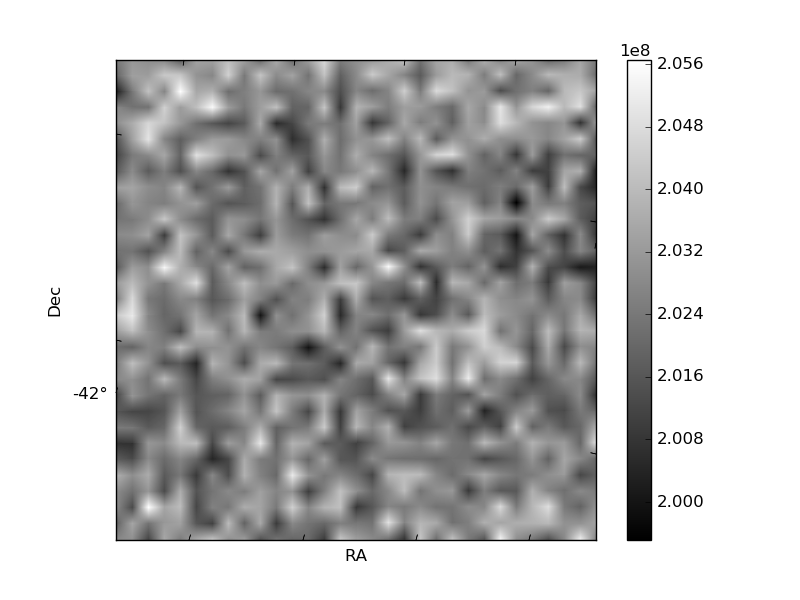
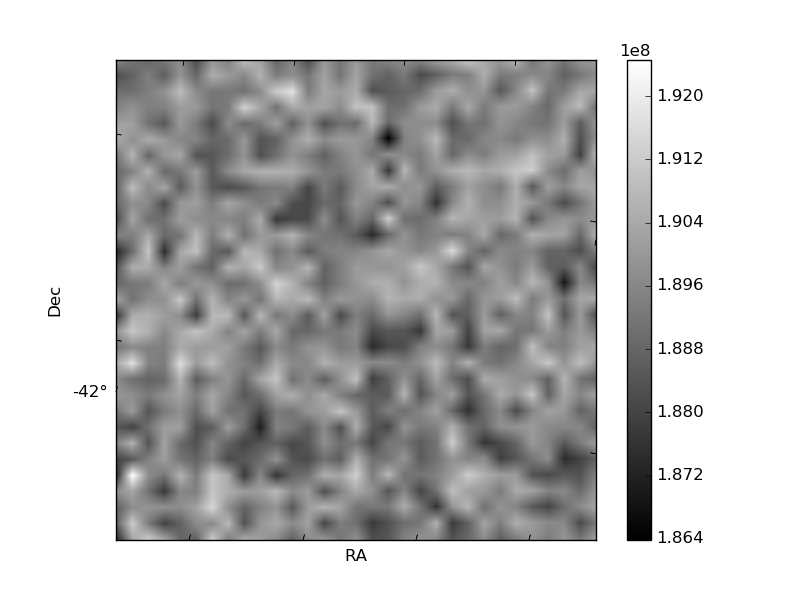
Histogram calculated using DETX and DETY for each event in the final _common_clean file
| Quadrant A | 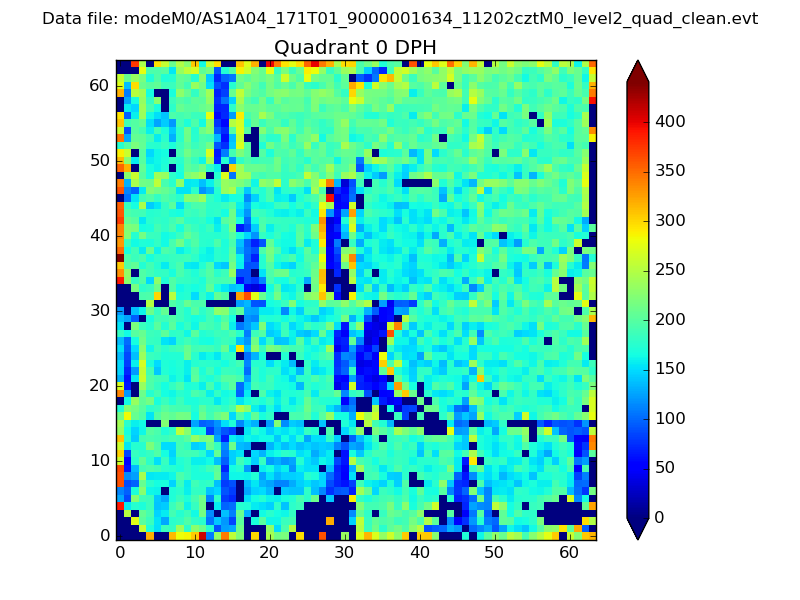 |
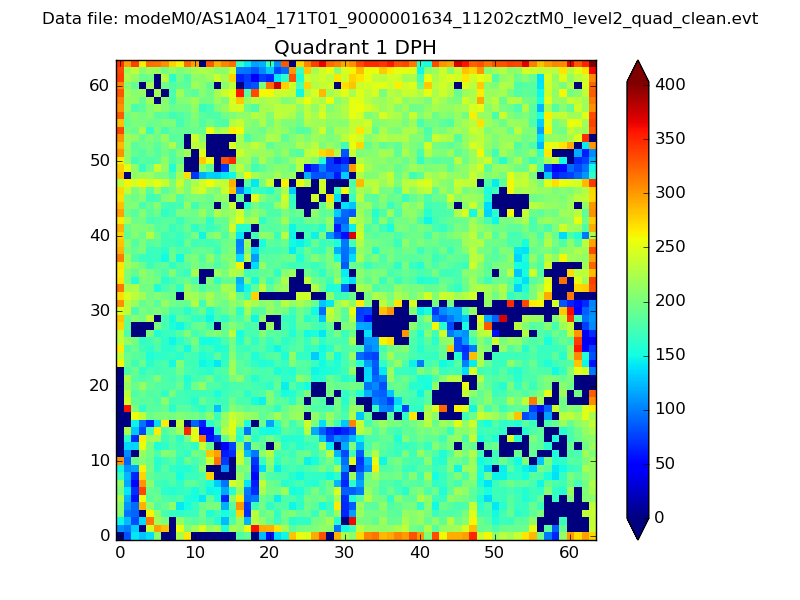 |
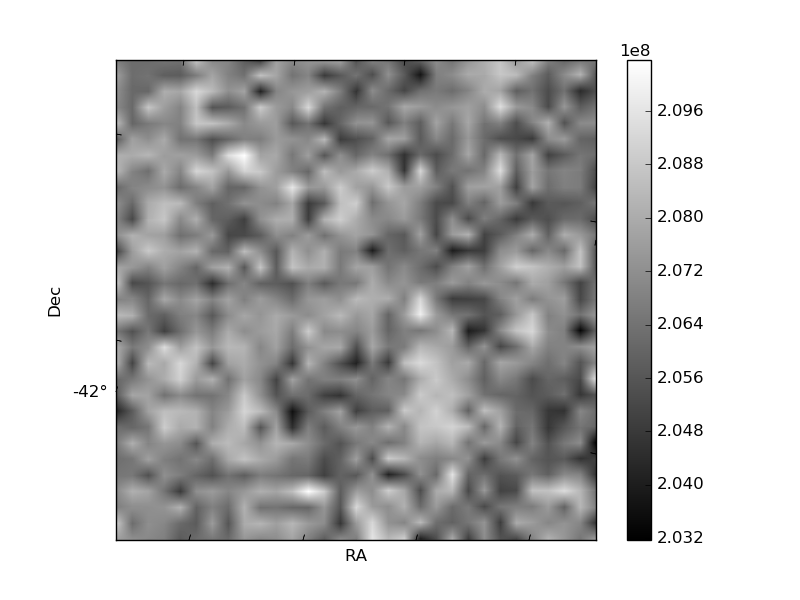
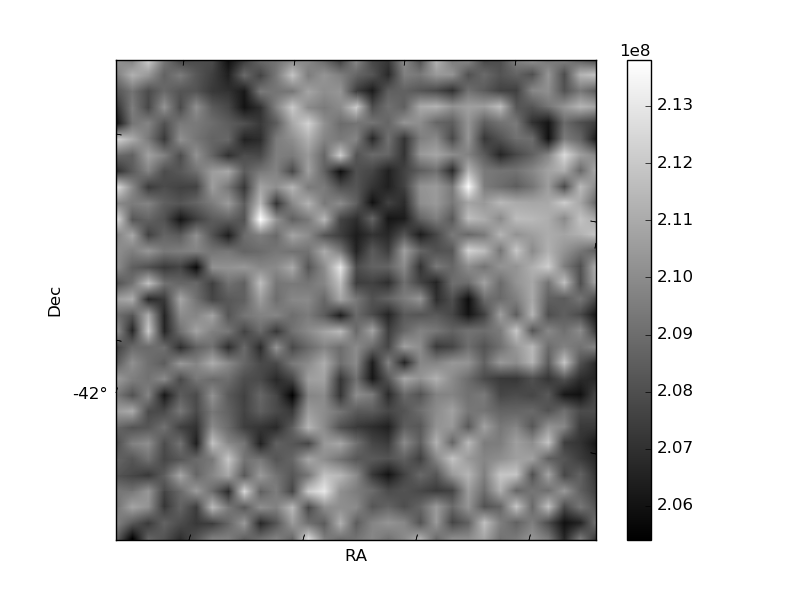
Quadrant B |
|---|---|---|---|
| Quadrant D | 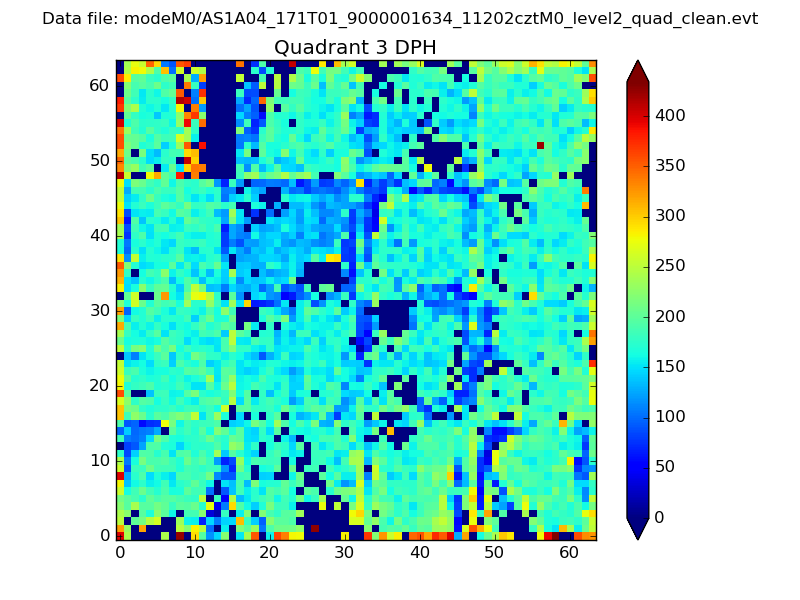 |
 |
Quadrant C |
| Plot type | Count rate plots | Images |
|---|---|---|
| Comparison with Poisson distribution Blue bars denote a histogram of data divided into 1 sec bins. Red curve is a Poisson curve with rate = median count rate of data. |
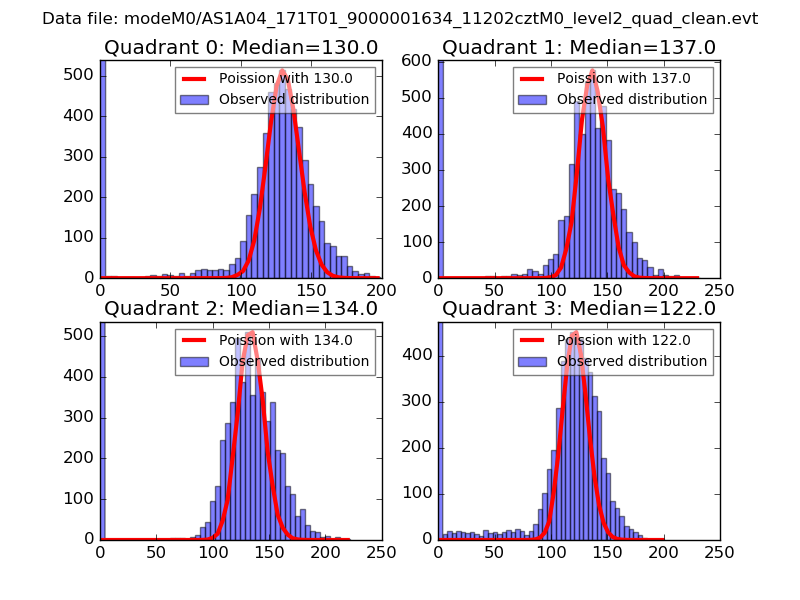 |
 |
| Quadrant-wise count rates Data is divided into 100 sec bins |
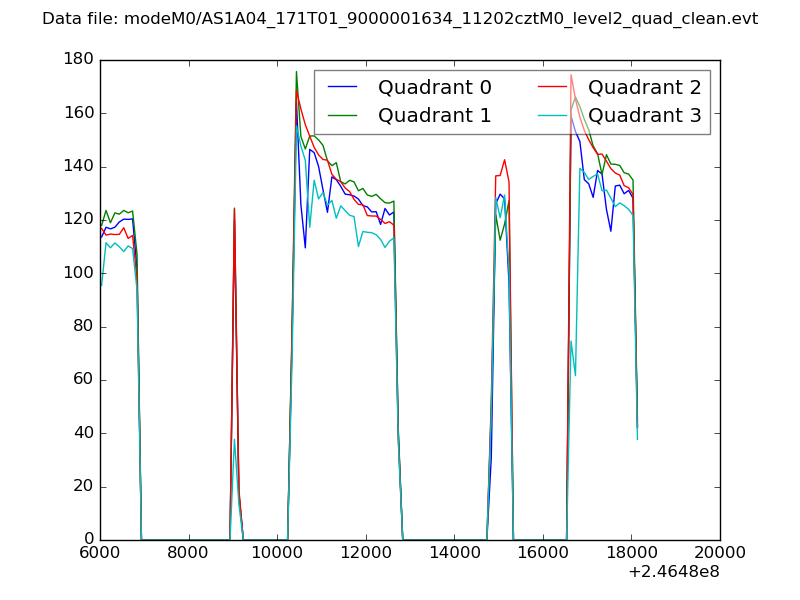 |
|
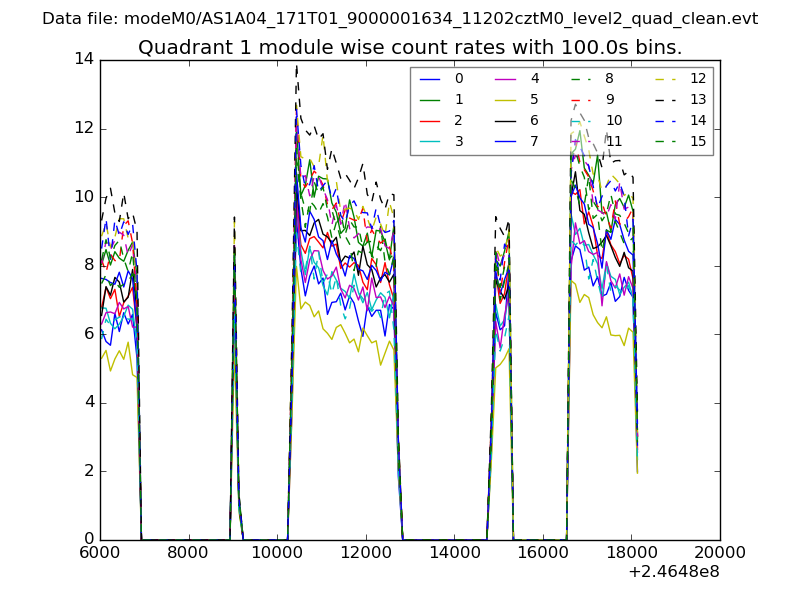
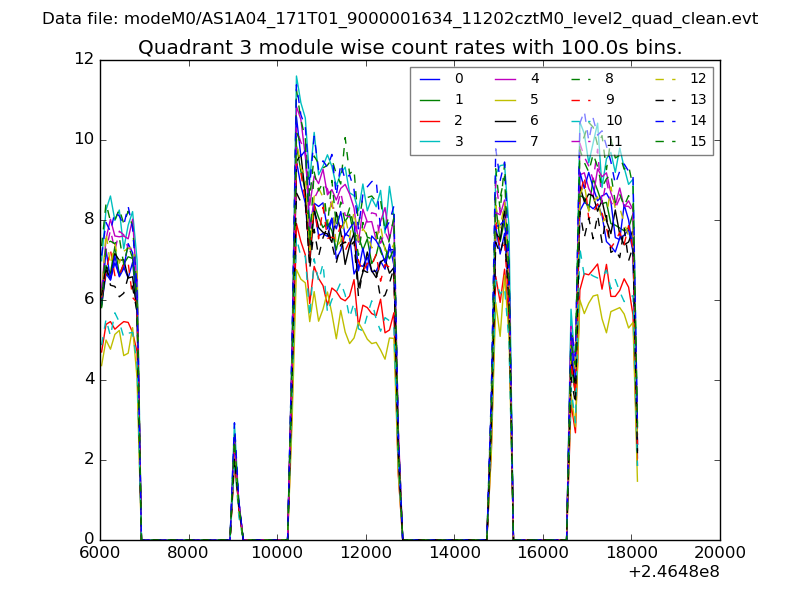
| Module-wise count rates for Quadrant A Data is divided into 100 sec bins |
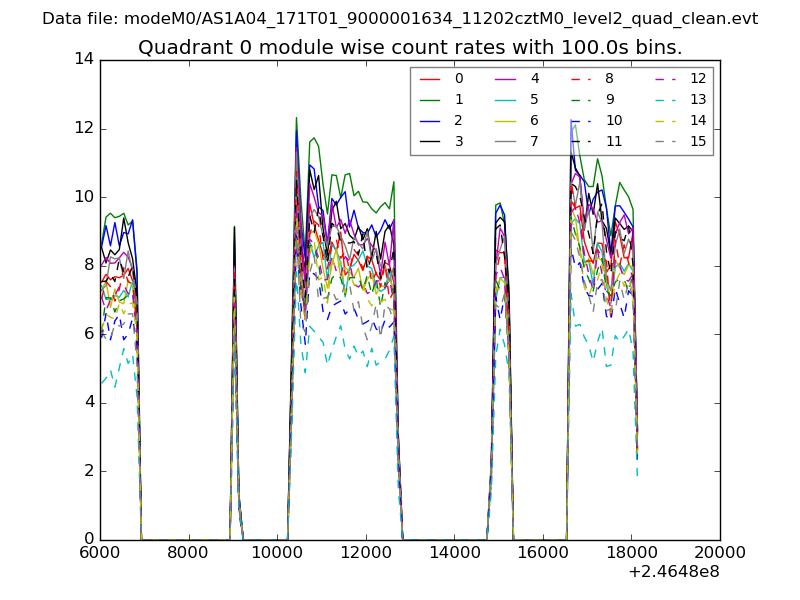 |
 |
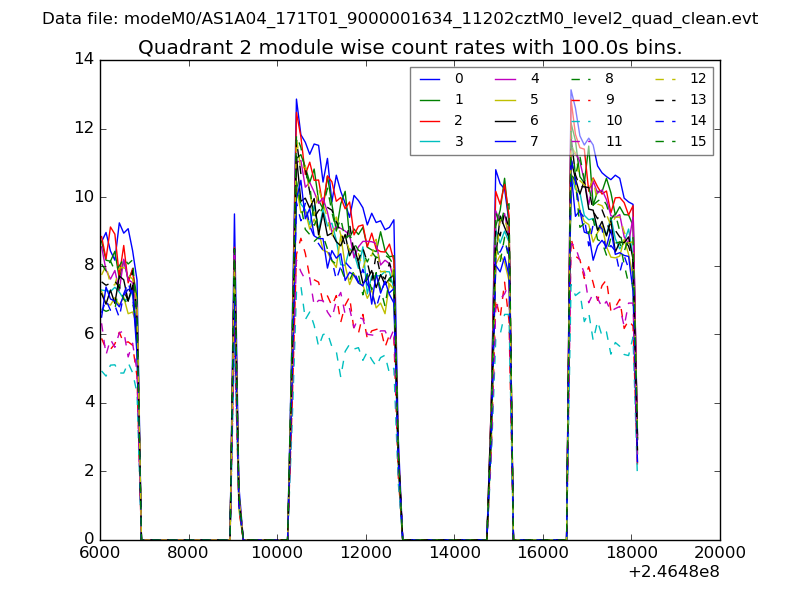
| Module-wise count rates for Quadrant B Data is divided into 100 sec bins |
 |
 |
| Module-wise count rates for Quadrant C Data is divided into 100 sec bins |
 |
 |
| Module-wise count rates for Quadrant D Data is divided into 100 sec bins |
 |
 |
| Parameter | Plot |
|---|---|
| CZT HV Monitor | 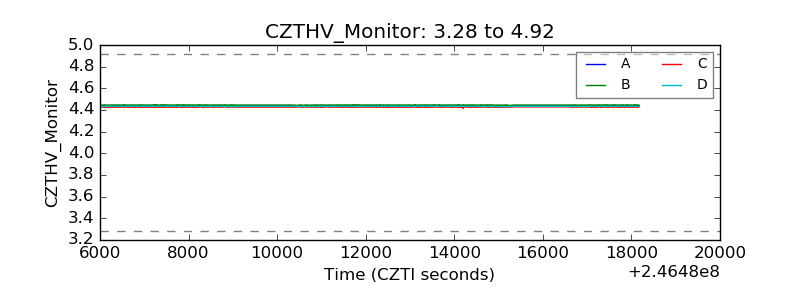 |
| D_VDD | 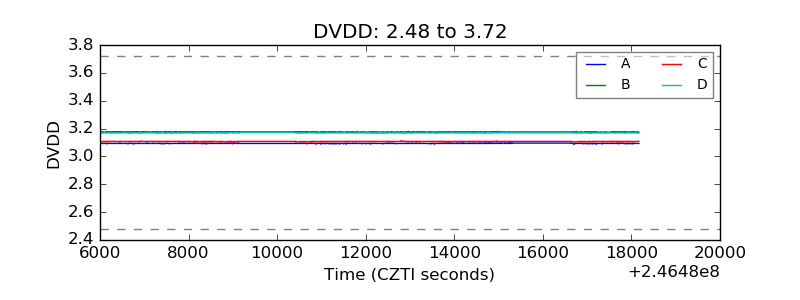 |
| Temperature 1 |  |
| Veto HV Monitor | 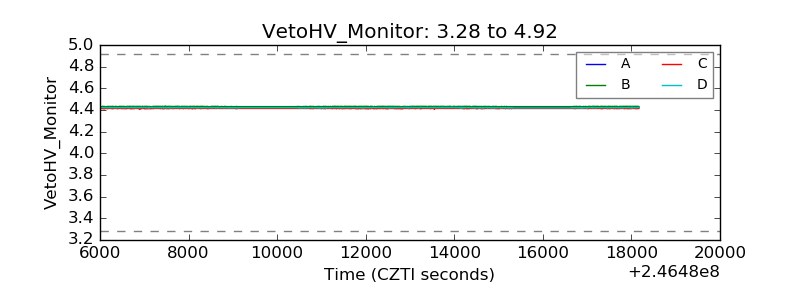 |
| Veto LLD | 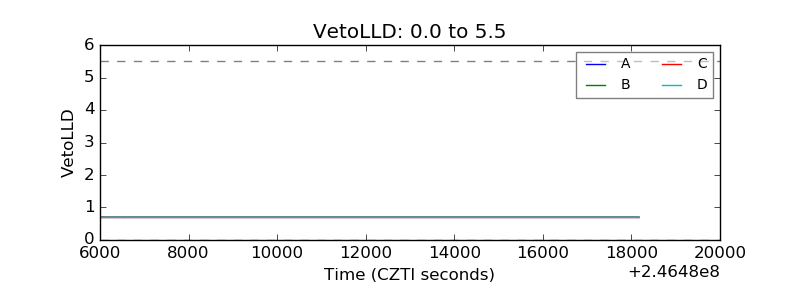 |
| Alpha Counter | 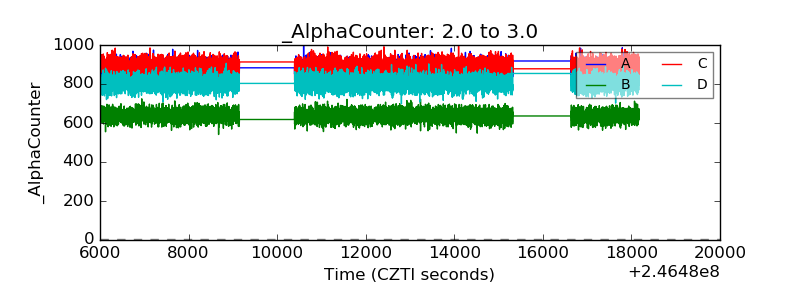 |
| _CPM_Rate | 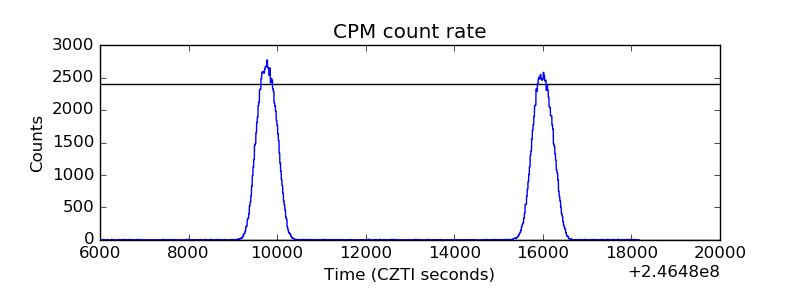 |
| CZT Counter | 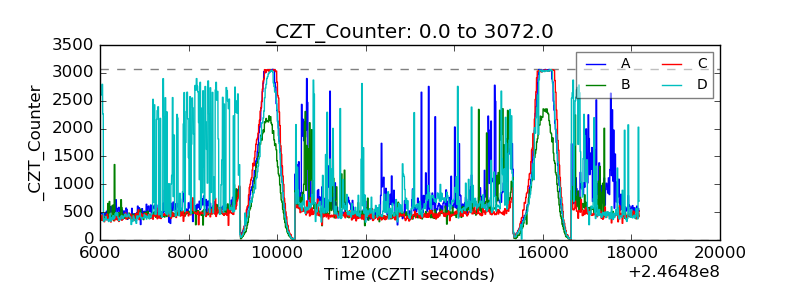 |
| +2.5 Volts monitor | 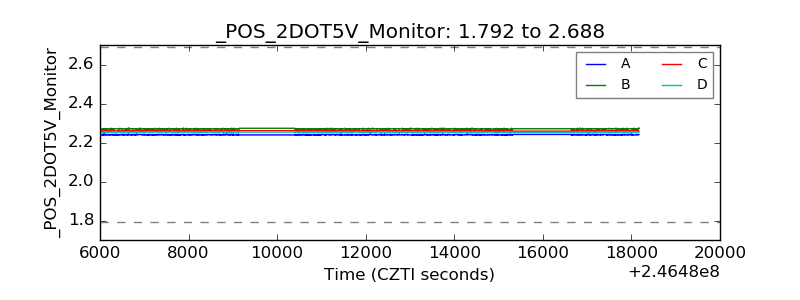 |
| +5 Volts monitor |  |
| _ROLL_ROT | 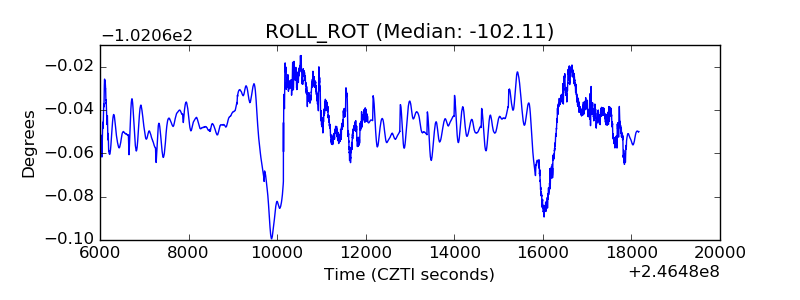 |
| _Roll_DEC | 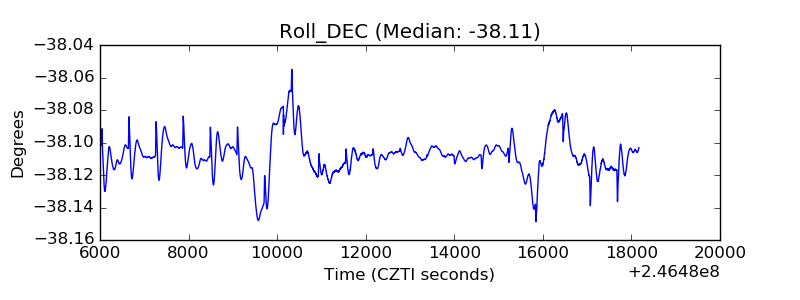 |
| _Roll_RA | 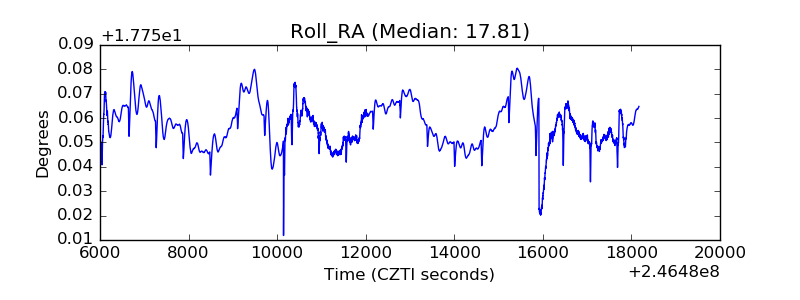 |
| Veto Counter | 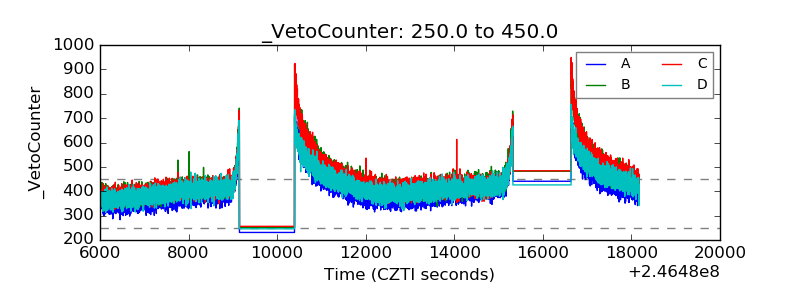 |