| Param | Original file | Final file |
|---|---|---|
| Filename | modeM0/AS1A04_171T01_9000001634_11204cztM0_level2.evt | modeM0/AS1A04_171T01_9000001634_11204cztM0_level2_quad_clean.evt |
| Size (bytes) | 659,134,080 | 81,492,480 |
| Size | 628.6 MB | 77.7 MB |
| Events in quadrant A | 9,653,843 | 413,074 |
| Events in quadrant B | 3,573,741 | 546,463 |
| Events in quadrant C | 2,979,878 | 545,595 |
| Events in quadrant D | 3,320,254 | 514,342 |
| Mode SS | |||
|---|---|---|---|
| Quadrant | BADHDUFLAG | Total packets | Discarded packets |
| A | 0 | 130 | 0 |
| B | 0 | 130 | 0 |
| C | 0 | 130 | 0 |
| D | 0 | 130 | 0 |
| Mode M0 | |||
|---|---|---|---|
| Quadrant | BADHDUFLAG | Total packets | Discarded packets |
| A | 0 | 33233 | 3 |
| B | 0 | 14735 | 2 |
| C | 0 | 13036 | 2 |
| D | 0 | 14162 | 2 |
| Mode M9 | |||
|---|---|---|---|
| Quadrant | BADHDUFLAG | Total packets | Discarded packets |
| A | 0 | 13 | 0 |
| B | 0 | 13 | 0 |
| C | 0 | 13 | 0 |
| D | 0 | 14 | 0 |
| Quadrant | Total seconds | Saturated seconds | Saturation percentage |
|---|---|---|---|
| A | 6412 | 2313 | 36.072988% |
| B | 6412 | 180 | 2.807236% |
| C | 6412 | 8 | 0.124766% |
| D | 6412 | 41 | 0.639426% |
Noise dominated data is calculated using 1-second bins in cleaned event files. If a bin has >2000 counts, and if more than 50% of those come from <1% of pixels, then it is considered to be noise-dominated and hence unusable.
| Quadrant | # 1 sec bins | Bins with >0 counts | Bins with >2000 counts | High rate bins dominated by noise | Noise dominated (total time) | Noise dominated (detector-on time) | Marked lightcurve |
|---|---|---|---|---|---|---|---|
| A | 7657 | 6413 | 1788 | 1788 | 23.35% | 27.88% | 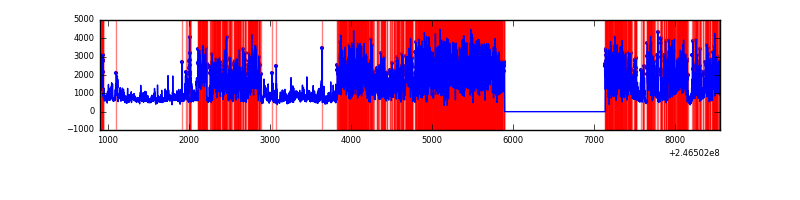 |
| B | 7657 | 6413 | 95 | 95 | 1.24% | 1.48% | 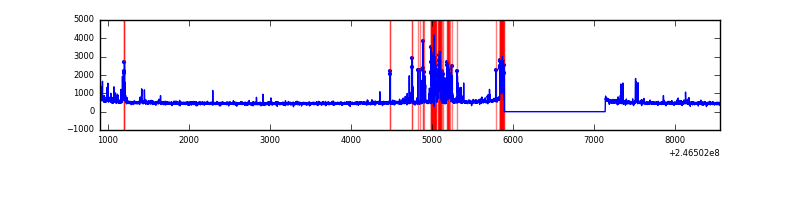 |
| C | 7657 | 6413 | 0 | 0 | 0.00% | 0.00% | 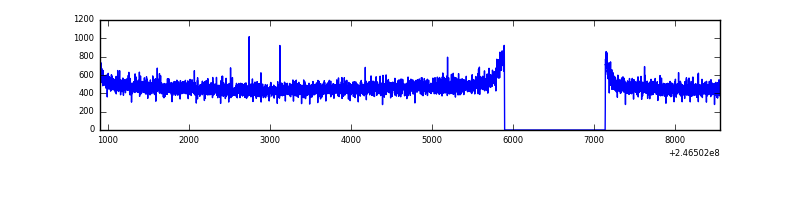 |
| D | 7657 | 6413 | 25 | 25 | 0.33% | 0.39% | 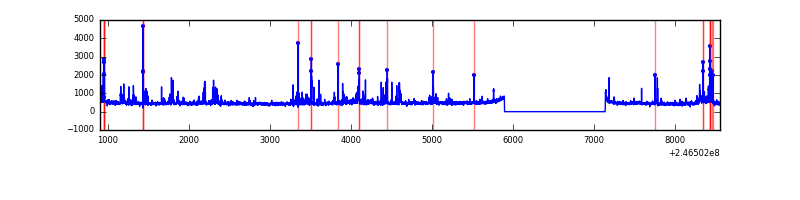 |
Top three noisy pixels from each quadrant. If the there are fewer than three noisy pixels in the level2.evt file, extra rows are filled as -1
| Pixel properties | Quadrant properties | ||||||
|---|---|---|---|---|---|---|---|
| Quadrant | DetID | PixID | Counts | Sigma | Mean | Median | Sigma |
| A | 15 | 239 | 6510137 | 49929.74 | 646 | 634 | 130.4 |
| A | 8 | 15 | 449846 | 3445.58 | 646 | 634 | 130.4 |
| A | 8 | 5 | 132625 | 1012.41 | 646 | 634 | 130.4 |
| B | 4 | 239 | 406153 | 2787.32 | 769 | 749 | 145.4 |
| B | 4 | 80 | 80794 | 550.34 | 769 | 749 | 145.4 |
| B | 4 | 81 | 23560 | 156.84 | 769 | 749 | 145.4 |
| C | 13 | 61 | 5473 | 26.53 | 764 | 768 | 177.4 |
| C | 3 | 202 | 1871 | 6.22 | 764 | 768 | 177.4 |
| C | 7 | 159 | 1684 | 5.16 | 764 | 768 | 177.4 |
| D | 2 | 136 | 108916 | 608.44 | 746 | 726 | 177.8 |
| D | 14 | 34 | 100127 | 559.01 | 746 | 726 | 177.8 |
| D | 2 | 14 | 65877 | 366.4 | 746 | 726 | 177.8 |
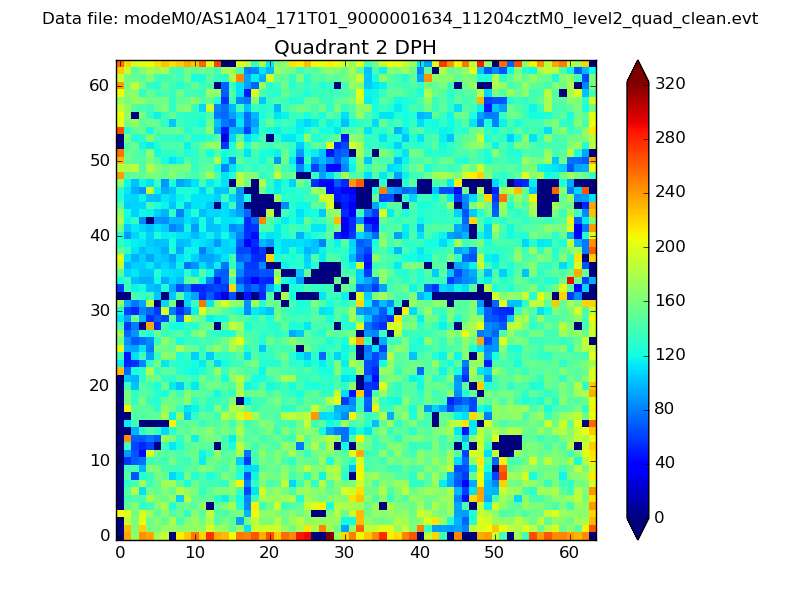
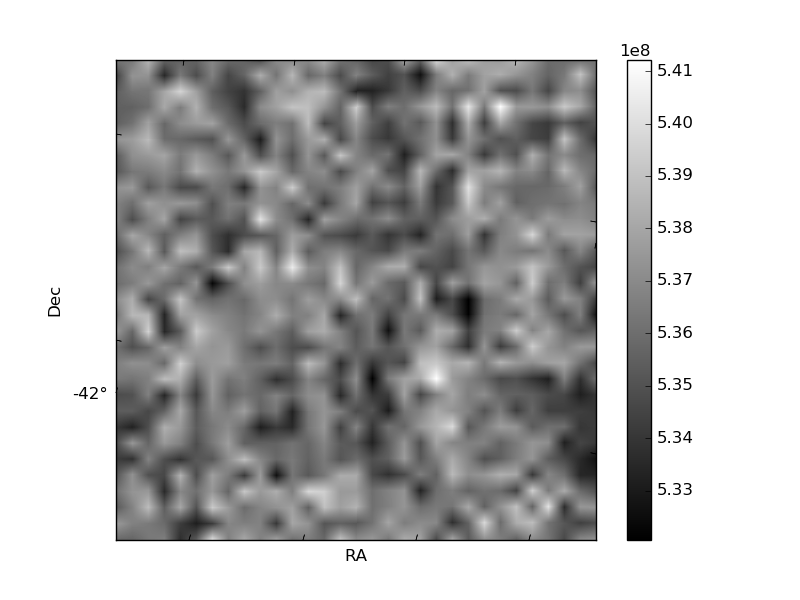
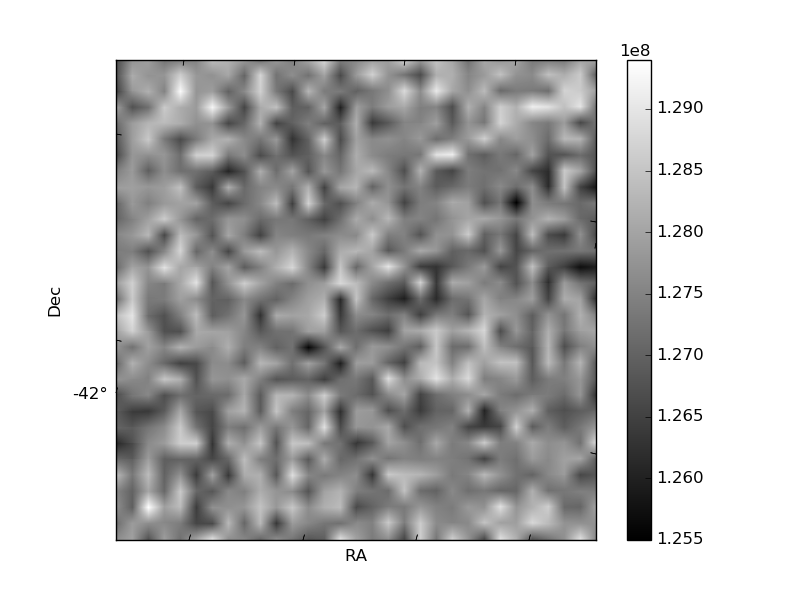
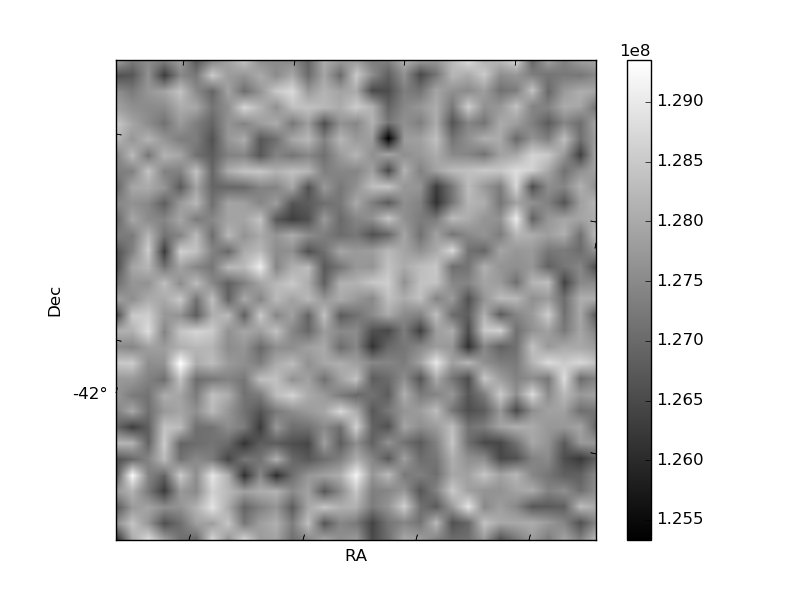
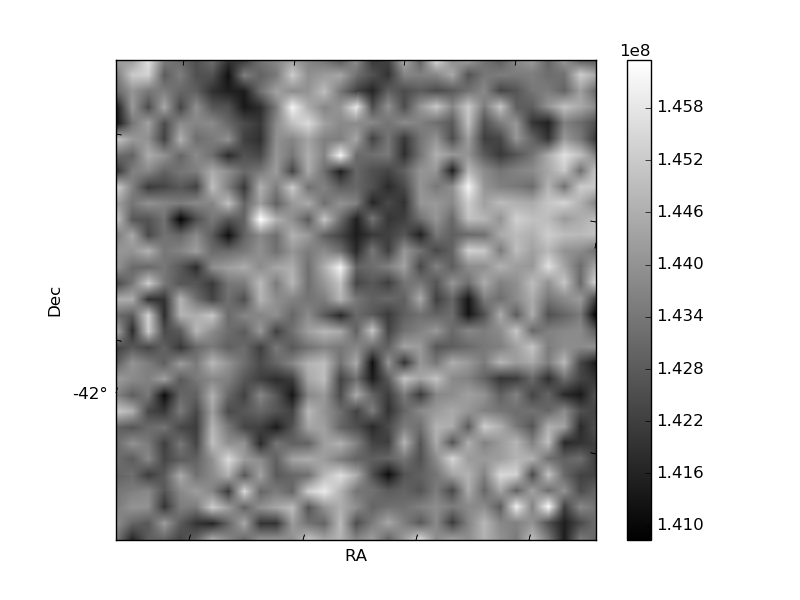
Histogram calculated using DETX and DETY for each event in the final _common_clean file
| Quadrant A | 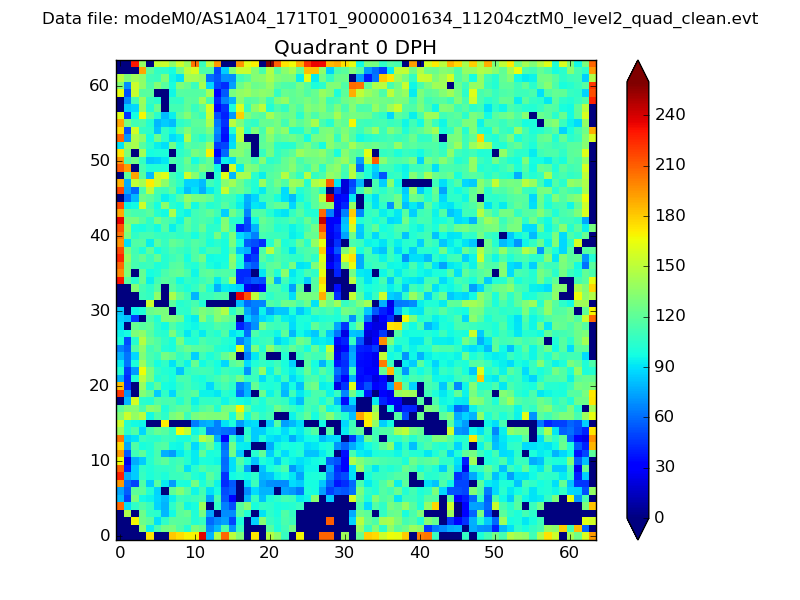 |
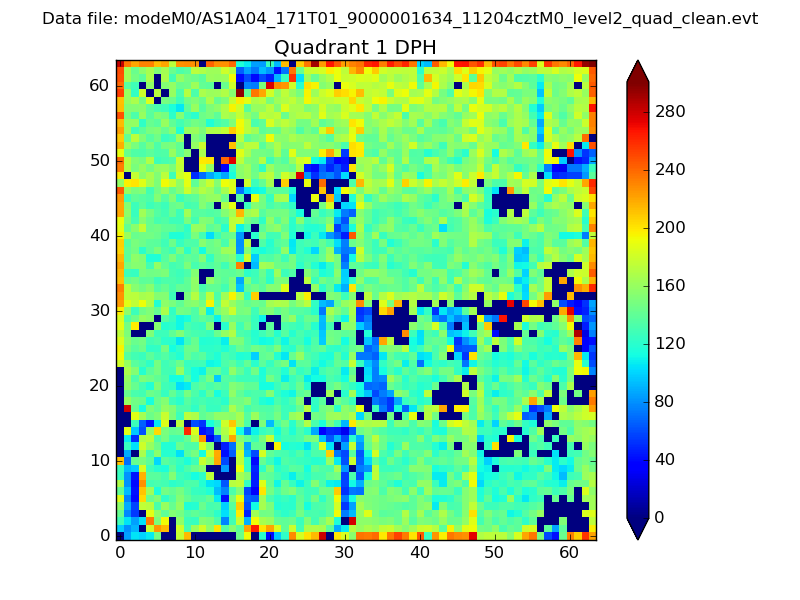 |
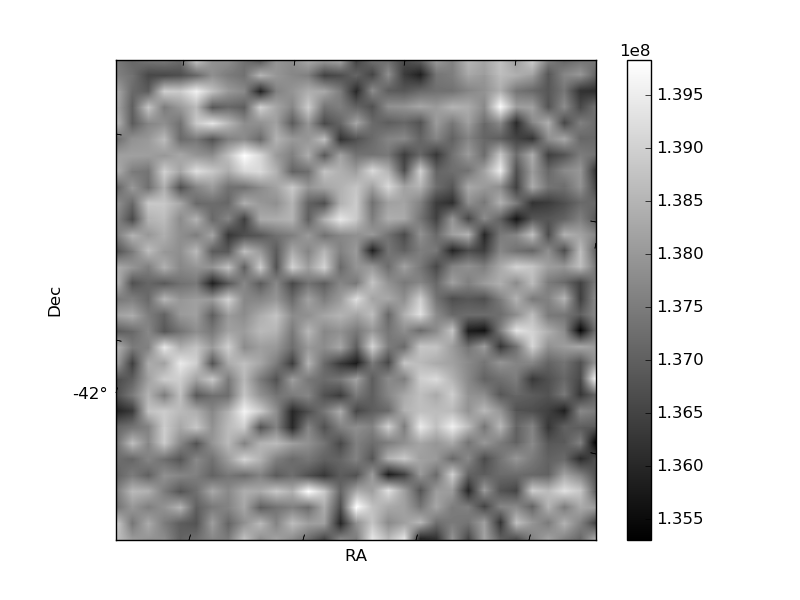
Quadrant B |
|---|---|---|---|
| Quadrant D | 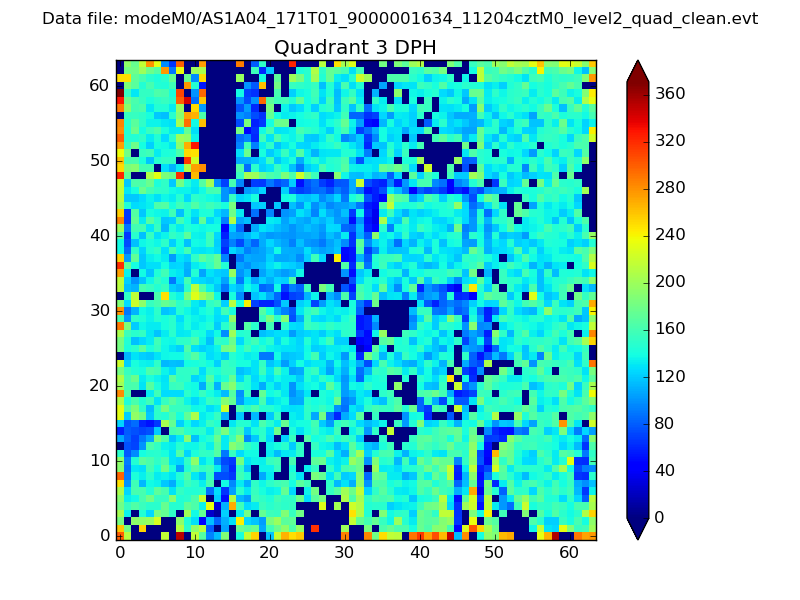 |
 |
Quadrant C |
| Plot type | Count rate plots | Images |
|---|---|---|
| Comparison with Poisson distribution Blue bars denote a histogram of data divided into 1 sec bins. Red curve is a Poisson curve with rate = median count rate of data. |
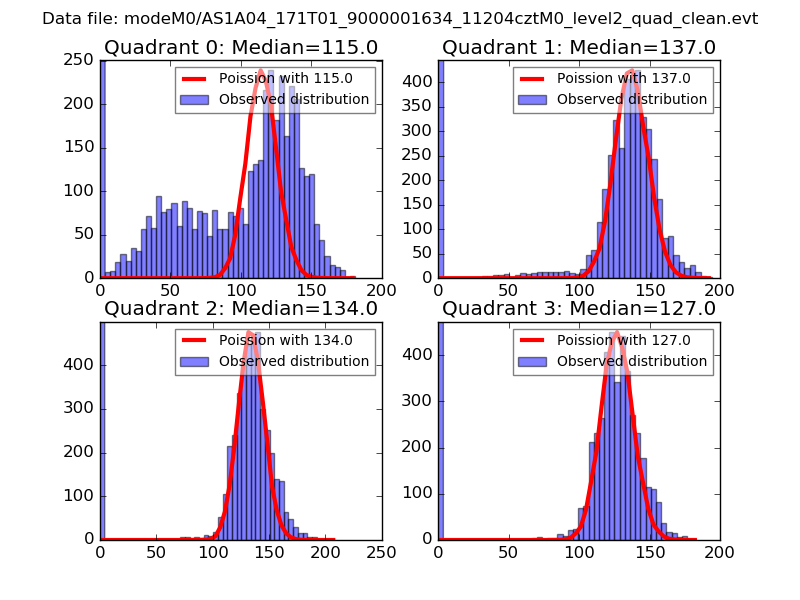 |
 |
| Quadrant-wise count rates Data is divided into 100 sec bins |
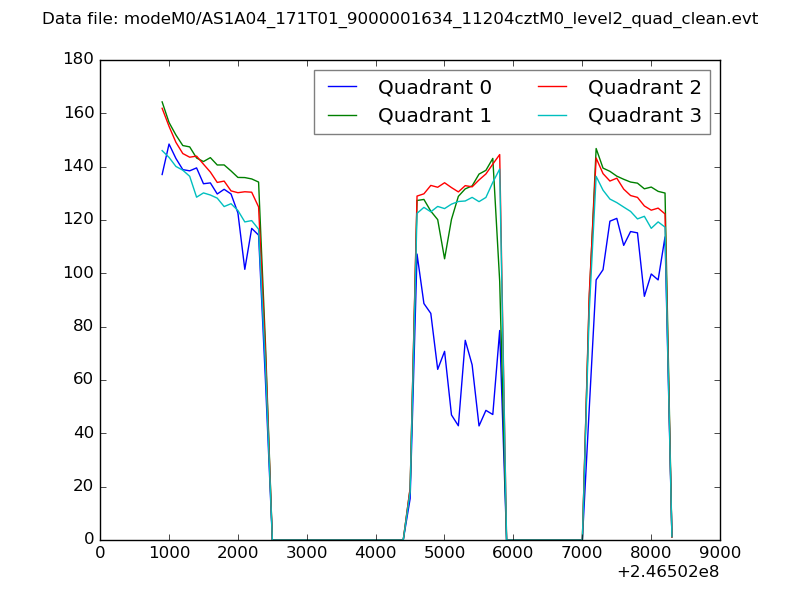 |
|
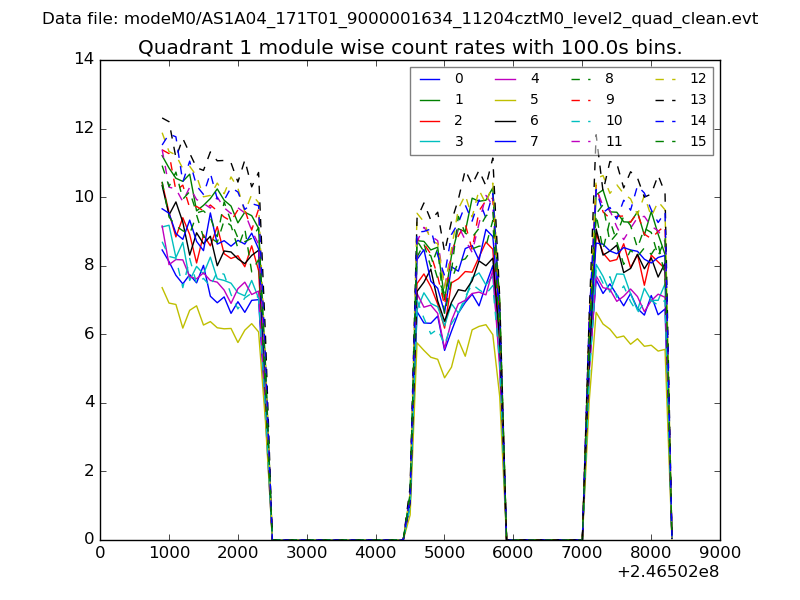
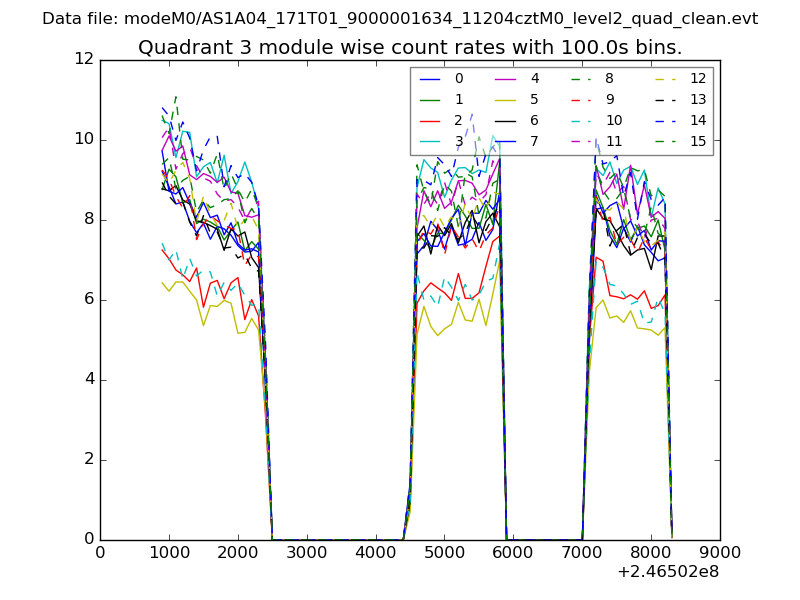
| Module-wise count rates for Quadrant A Data is divided into 100 sec bins |
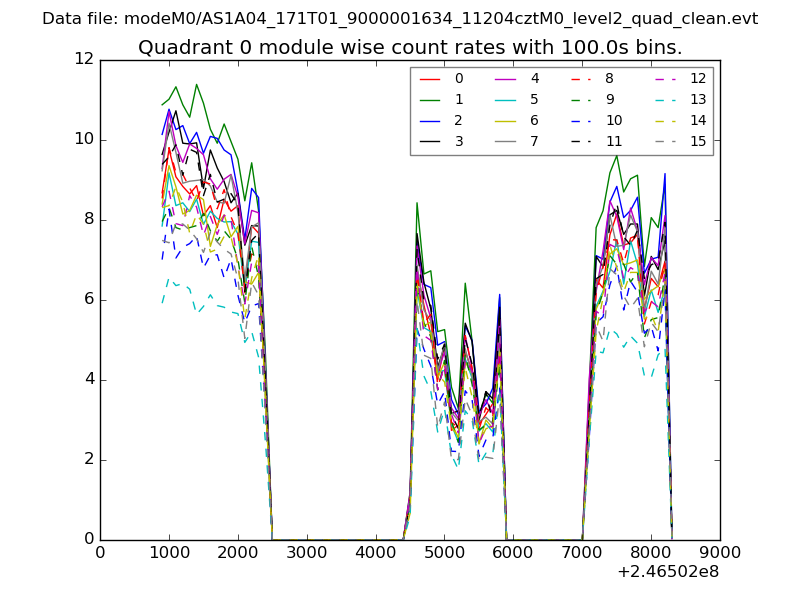 |
 |
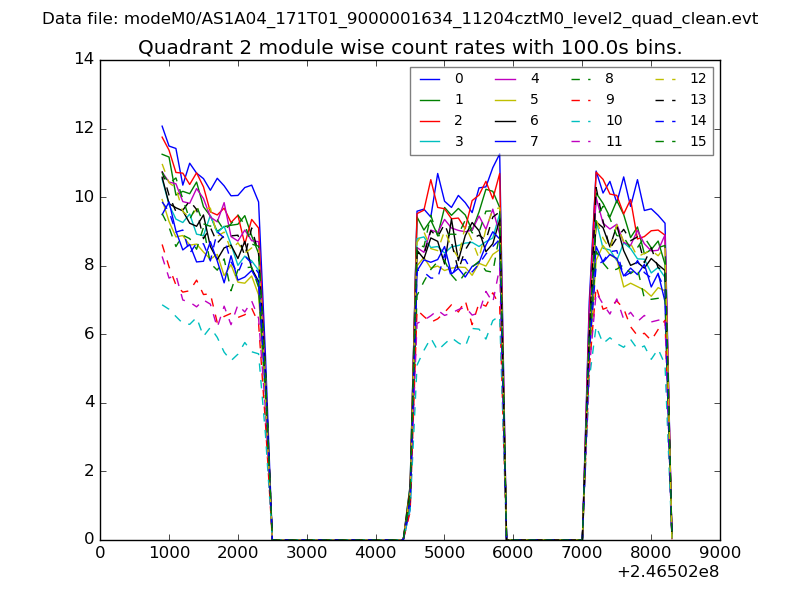
| Module-wise count rates for Quadrant B Data is divided into 100 sec bins |
 |
 |
| Module-wise count rates for Quadrant C Data is divided into 100 sec bins |
 |
 |
| Module-wise count rates for Quadrant D Data is divided into 100 sec bins |
 |
 |
| Parameter | Plot |
|---|---|
| CZT HV Monitor | 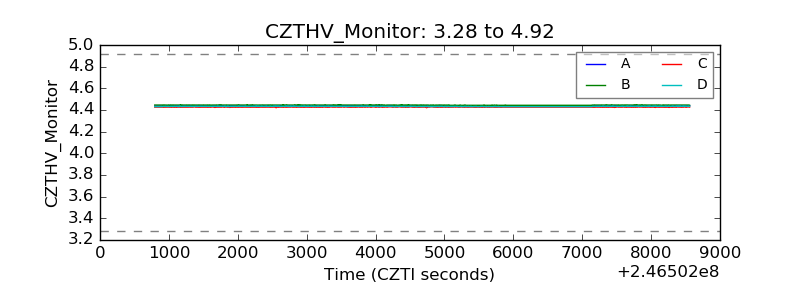 |
| D_VDD | 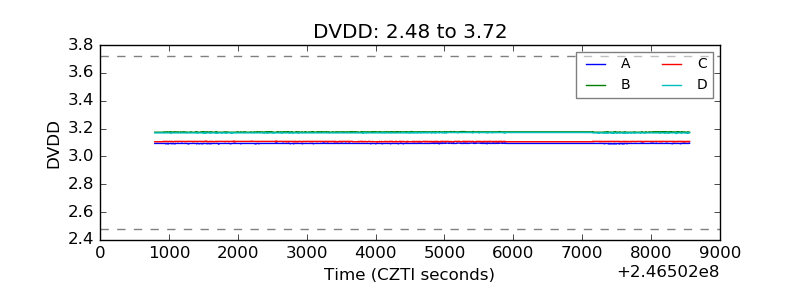 |
| Temperature 1 |  |
| Veto HV Monitor | 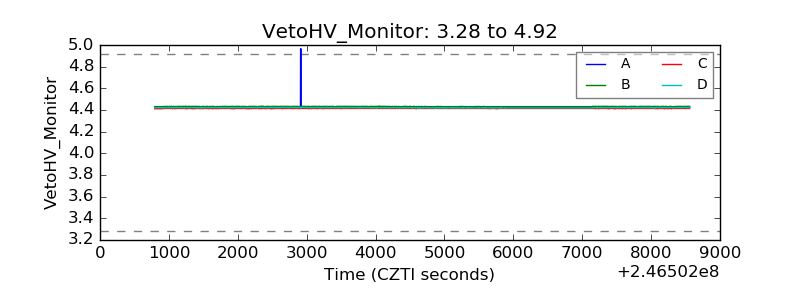 |
| Veto LLD | 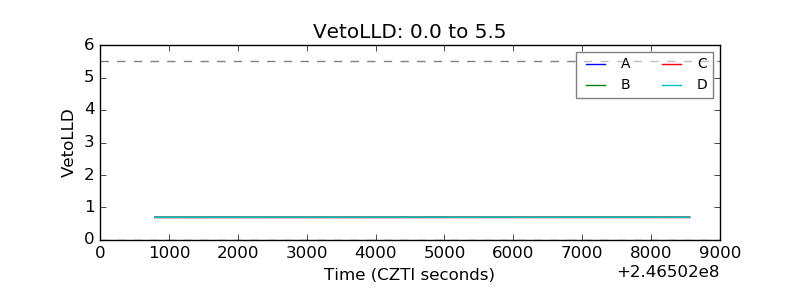 |
| Alpha Counter | 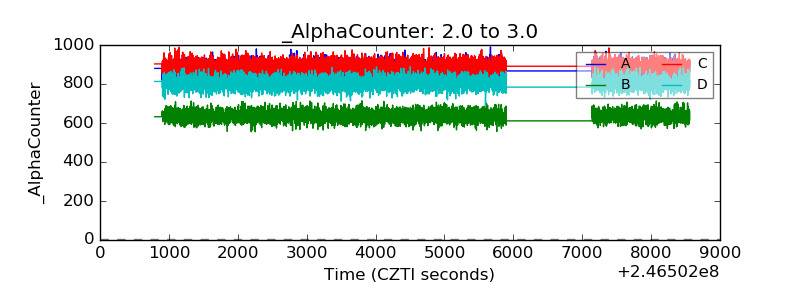 |
| _CPM_Rate | 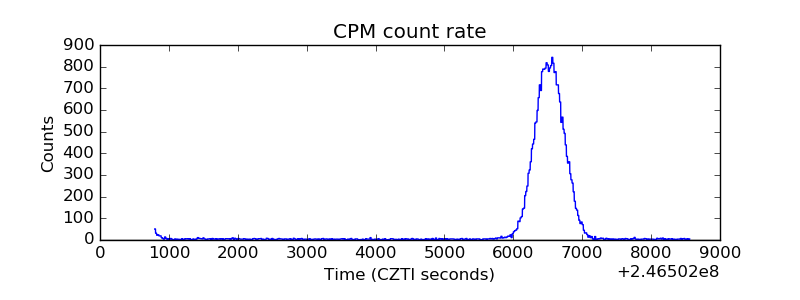 |
| CZT Counter | 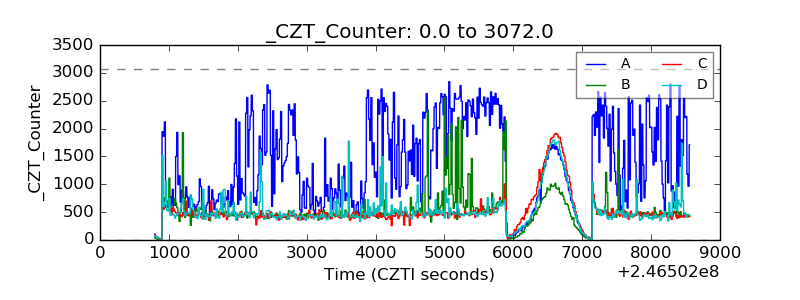 |
| +2.5 Volts monitor |  |
| +5 Volts monitor |  |
| _ROLL_ROT | 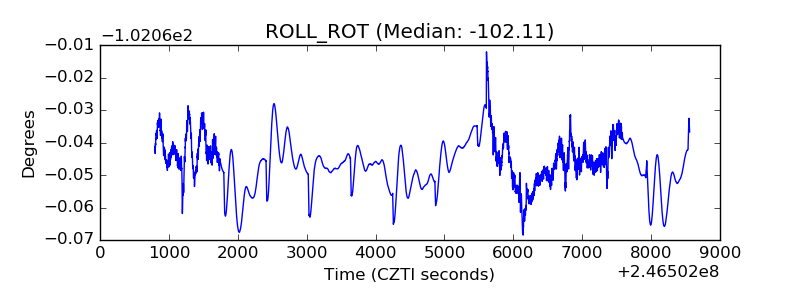 |
| _Roll_DEC | 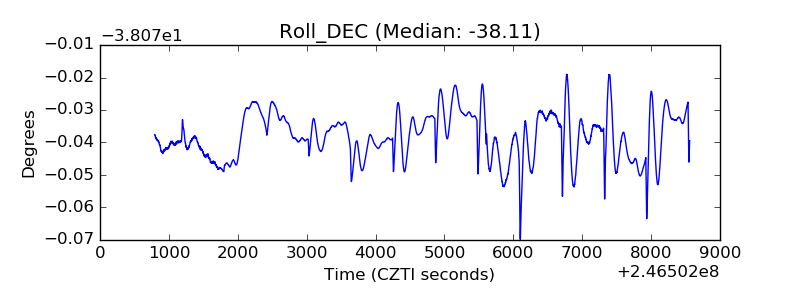 |
| _Roll_RA | 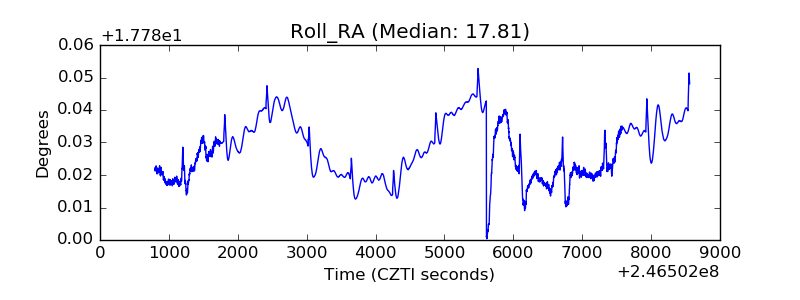 |
| Veto Counter | 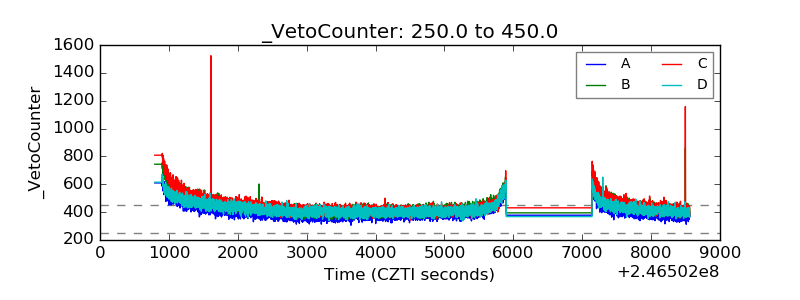 |