| Param | Original file | Final file |
|---|---|---|
| Filename | modeM0/AS1A04_171T01_9000001634_11205cztM0_level2.evt | modeM0/AS1A04_171T01_9000001634_11205cztM0_level2_quad_clean.evt |
| Size (bytes) | 582,157,440 | 82,707,840 |
| Size | 555.2 MB | 78.9 MB |
| Events in quadrant A | 6,779,412 | 477,580 |
| Events in quadrant B | 3,644,079 | 529,796 |
| Events in quadrant C | 3,127,496 | 524,690 |
| Events in quadrant D | 3,618,880 | 498,347 |
| Mode SS | |||
|---|---|---|---|
| Quadrant | BADHDUFLAG | Total packets | Discarded packets |
| A | 0 | 142 | 0 |
| B | 0 | 142 | 0 |
| C | 0 | 142 | 0 |
| D | 0 | 142 | 2 |
| Mode M0 | |||
|---|---|---|---|
| Quadrant | BADHDUFLAG | Total packets | Discarded packets |
| A | 0 | 25309 | 646 |
| B | 0 | 15410 | 190 |
| C | 0 | 14133 | 154 |
| D | 0 | 15670 | 146 |
| Mode M9 | |||
|---|---|---|---|
| Quadrant | BADHDUFLAG | Total packets | Discarded packets |
| A | 0 | 21 | 0 |
| B | 0 | 21 | 0 |
| C | 0 | 21 | 0 |
| D | 0 | 21 | 0 |
| Quadrant | Total seconds | Saturated seconds | Saturation percentage |
|---|---|---|---|
| A | 6778 | 1056 | 15.579817% |
| B | 6794 | 163 | 2.399176% |
| C | 6795 | 58 | 0.853569% |
| D | 6801 | 132 | 1.940891% |
Noise dominated data is calculated using 1-second bins in cleaned event files. If a bin has >2000 counts, and if more than 50% of those come from <1% of pixels, then it is considered to be noise-dominated and hence unusable.
| Quadrant | # 1 sec bins | Bins with >0 counts | Bins with >2000 counts | High rate bins dominated by noise | Noise dominated (total time) | Noise dominated (detector-on time) | Marked lightcurve |
|---|---|---|---|---|---|---|---|
| A | 8968 | 6795 | 777 | 777 | 8.66% | 11.43% | 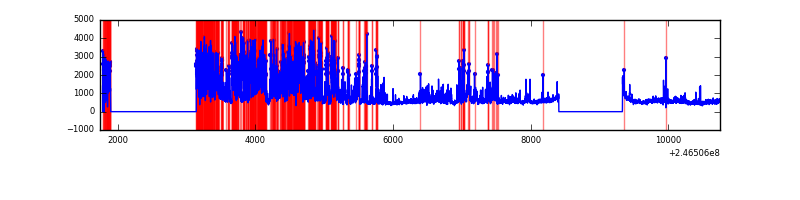 |
| B | 8990 | 6808 | 38 | 38 | 0.42% | 0.56% | 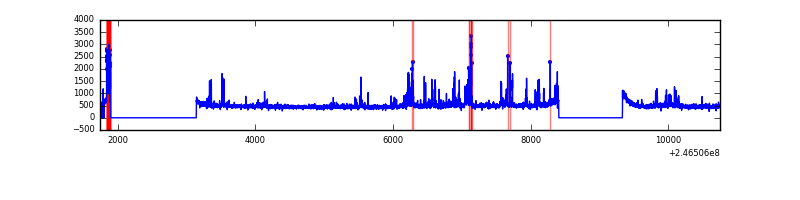 |
| C | 8986 | 6807 | 1 | 1 | 0.01% | 0.01% | 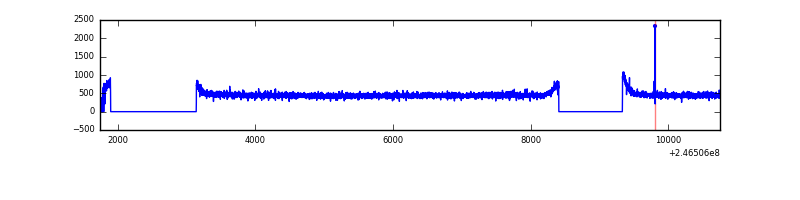 |
| D | 9006 | 6814 | 76 | 76 | 0.84% | 1.12% | 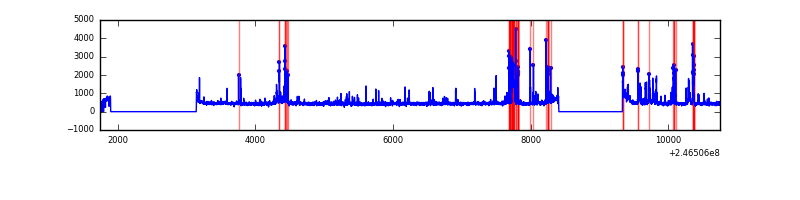 |
Top three noisy pixels from each quadrant. If the there are fewer than three noisy pixels in the level2.evt file, extra rows are filled as -1
| Pixel properties | Quadrant properties | ||||||
|---|---|---|---|---|---|---|---|
| Quadrant | DetID | PixID | Counts | Sigma | Mean | Median | Sigma |
| A | 15 | 239 | 3306405 | 21291.68 | 759 | 745 | 155.3 |
| A | 8 | 15 | 321398 | 2065.32 | 759 | 745 | 155.3 |
| A | 8 | 5 | 158970 | 1019.12 | 759 | 745 | 155.3 |
| B | 4 | 239 | 324576 | 2089.77 | 810 | 788 | 154.9 |
| B | 4 | 80 | 42307 | 267.97 | 810 | 788 | 154.9 |
| B | 4 | 81 | 40443 | 255.94 | 810 | 788 | 154.9 |
| C | 13 | 61 | 5778 | 26.69 | 801 | 804 | 186.4 |
| C | 14 | 234 | 4907 | 22.02 | 801 | 804 | 186.4 |
| C | 3 | 202 | 1960 | 6.2 | 801 | 804 | 186.4 |
| D | 2 | 14 | 284061 | 1511.77 | 785 | 763 | 187.4 |
| D | 2 | 136 | 218815 | 1163.6 | 785 | 763 | 187.4 |
| D | 13 | 152 | 50204 | 263.83 | 785 | 763 | 187.4 |
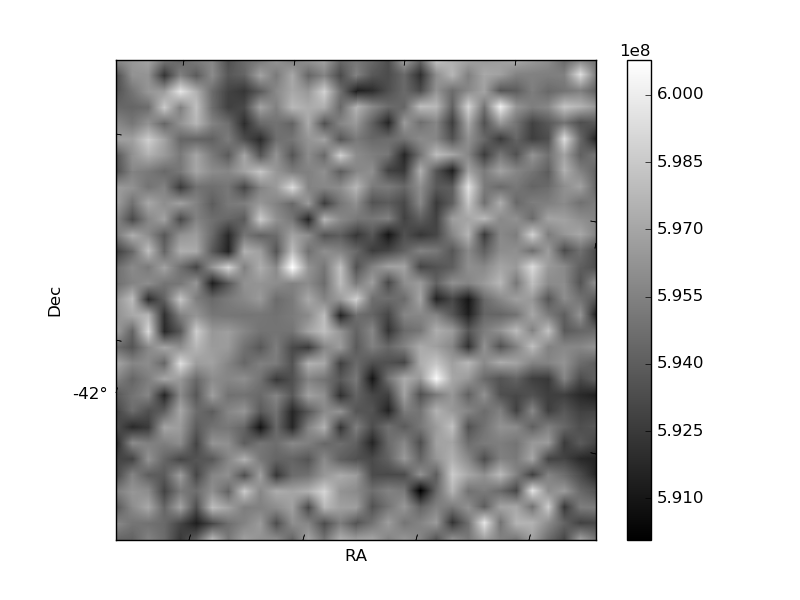
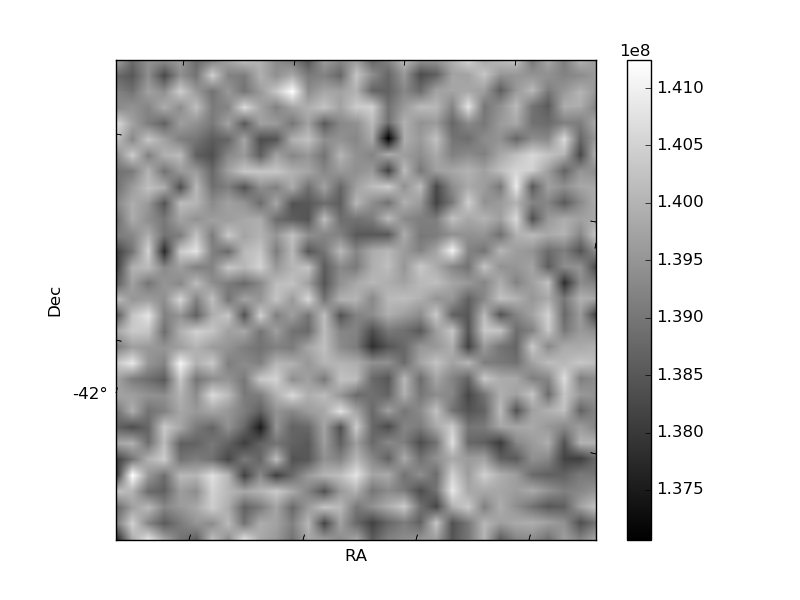
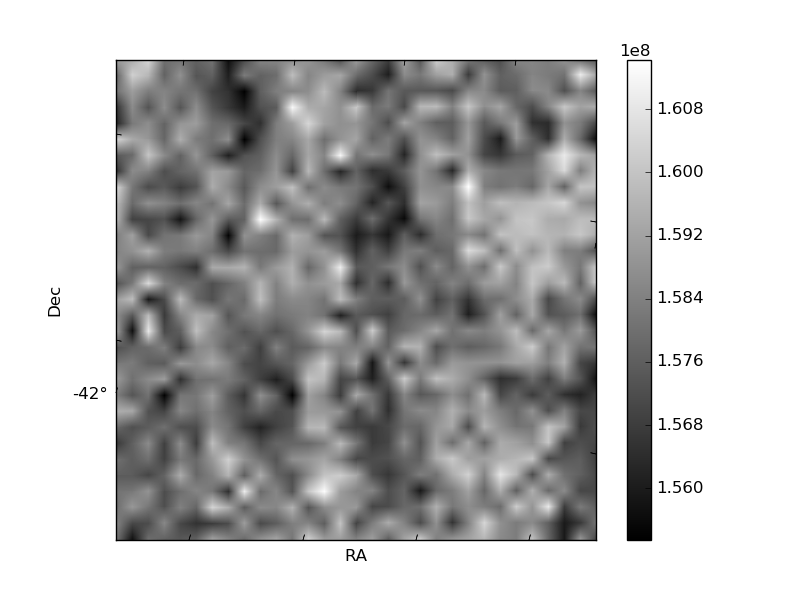
Histogram calculated using DETX and DETY for each event in the final _common_clean file
| Quadrant A | 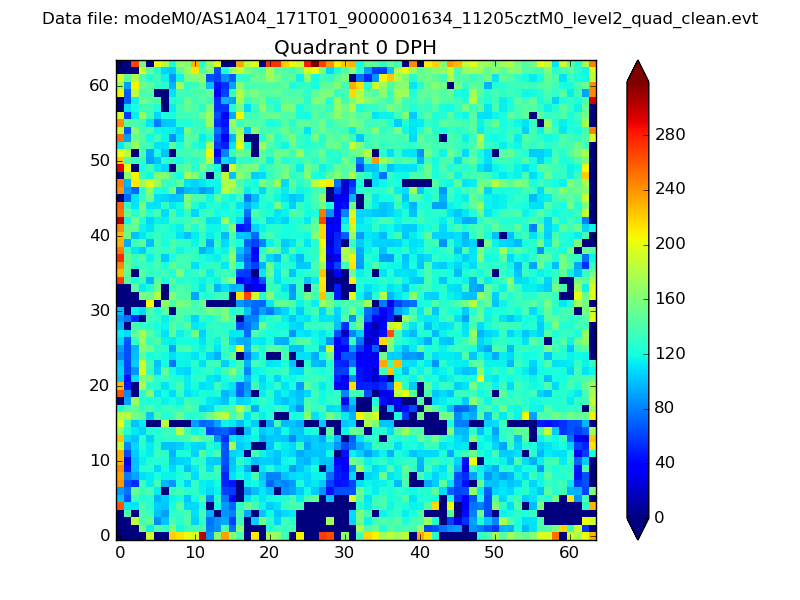 |
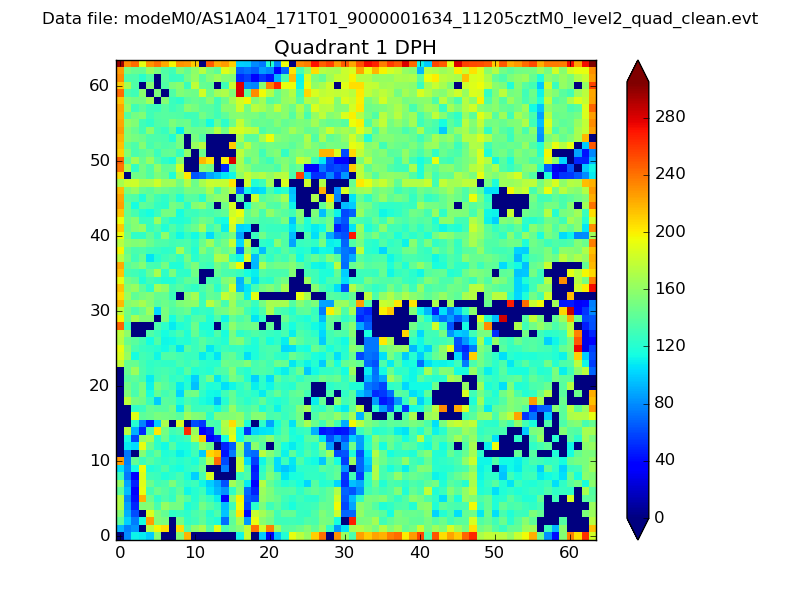 |
Quadrant B |
|---|---|---|---|
| Quadrant D | 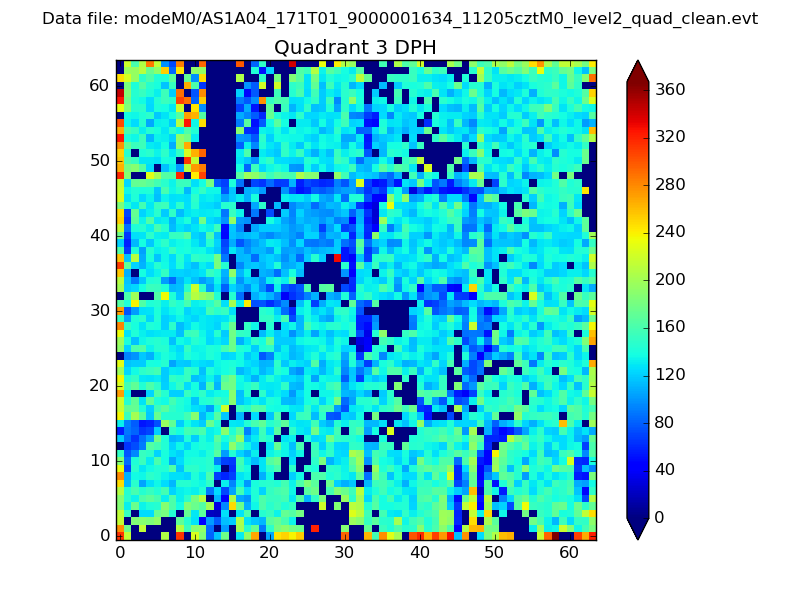 |
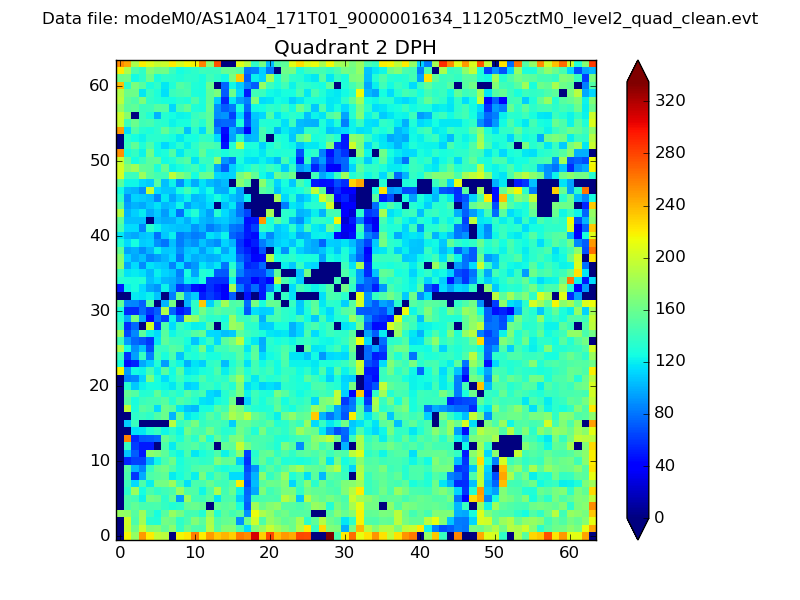 |
Quadrant C |
| Plot type | Count rate plots | Images |
|---|---|---|
| Comparison with Poisson distribution Blue bars denote a histogram of data divided into 1 sec bins. Red curve is a Poisson curve with rate = median count rate of data. |
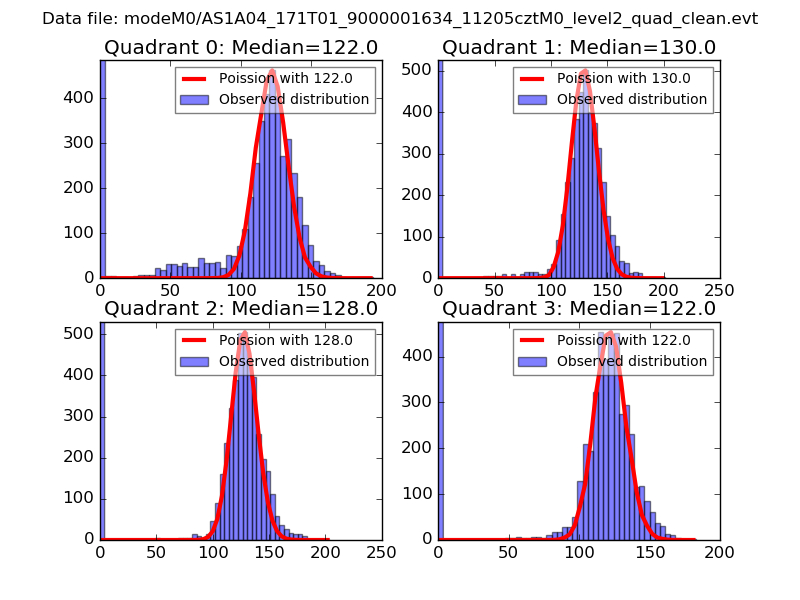 |
 |
| Quadrant-wise count rates Data is divided into 100 sec bins |
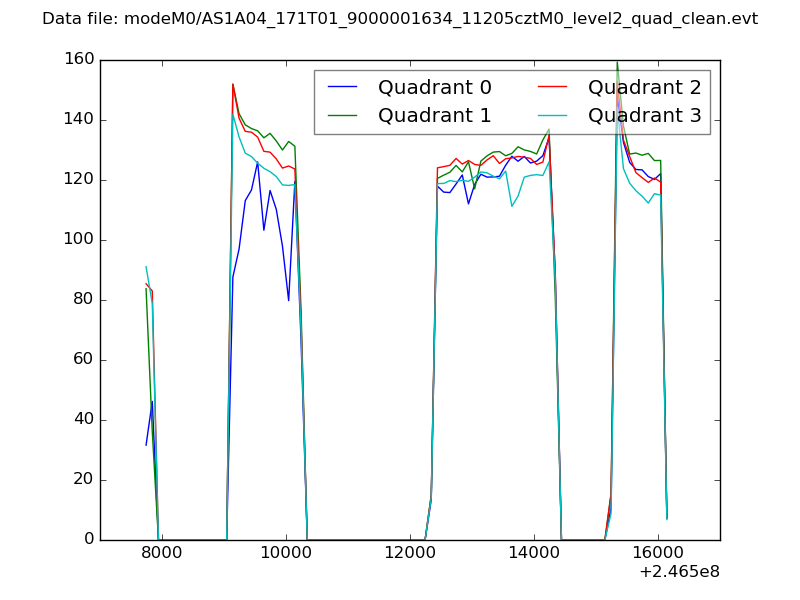 |
|
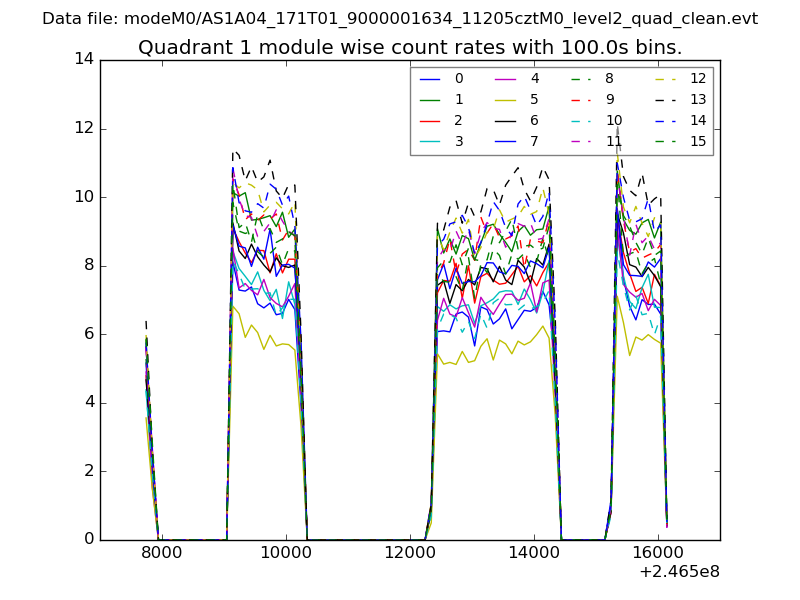
| Module-wise count rates for Quadrant A Data is divided into 100 sec bins |
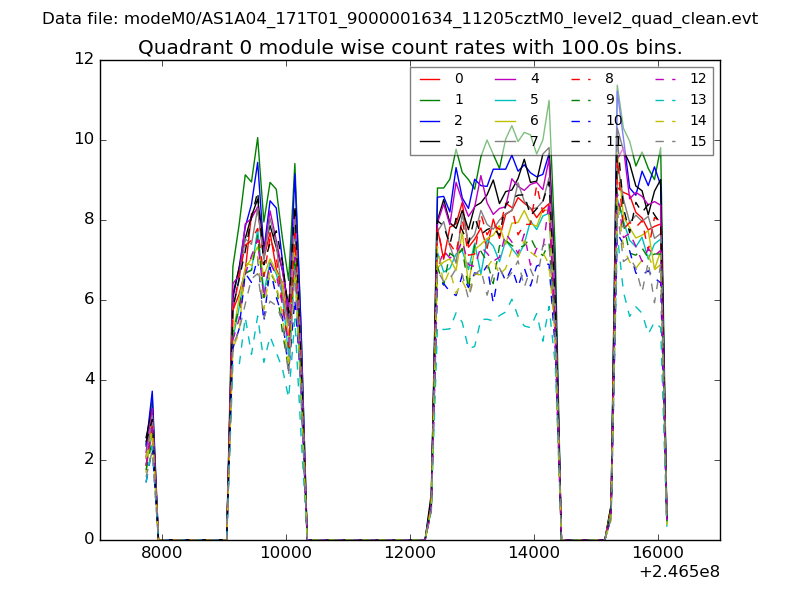 |
 |
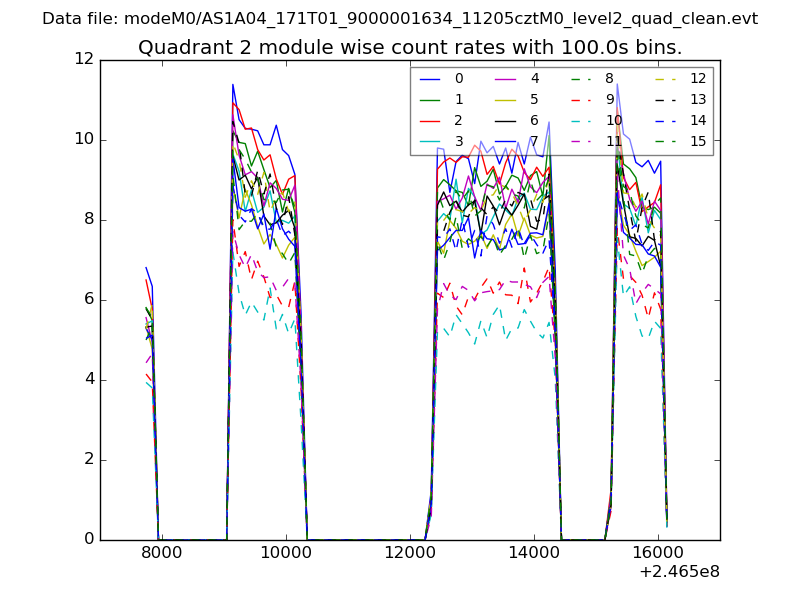
| Module-wise count rates for Quadrant B Data is divided into 100 sec bins |
 |
 |
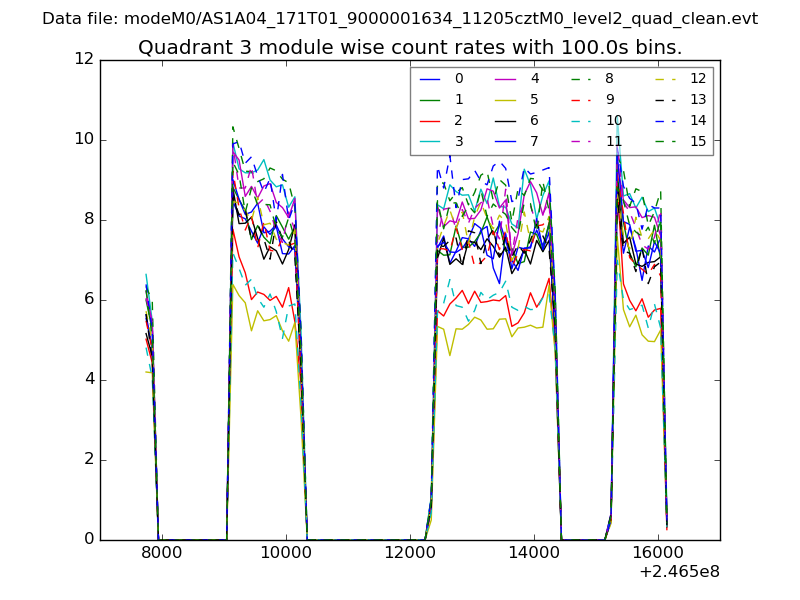
| Module-wise count rates for Quadrant C Data is divided into 100 sec bins |
 |
 |
| Module-wise count rates for Quadrant D Data is divided into 100 sec bins |
 |
 |
| Parameter | Plot |
|---|---|
| CZT HV Monitor | 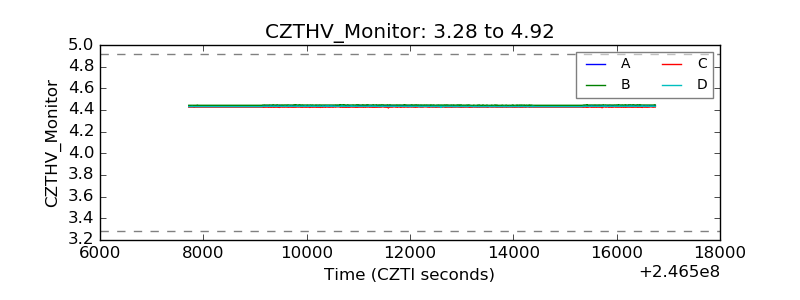 |
| D_VDD |  |
| Temperature 1 |  |
| Veto HV Monitor | 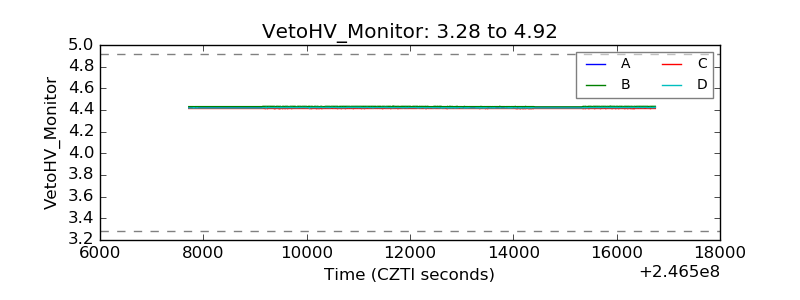 |
| Veto LLD | 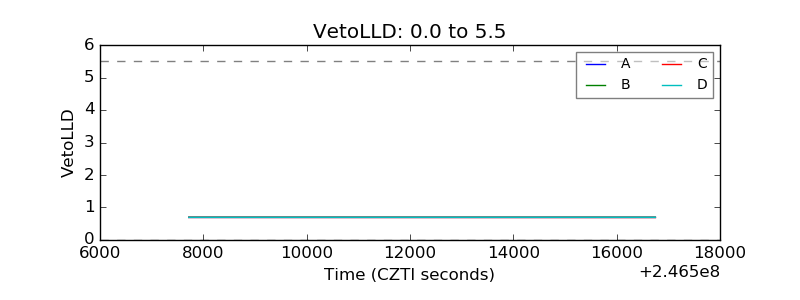 |
| Alpha Counter | 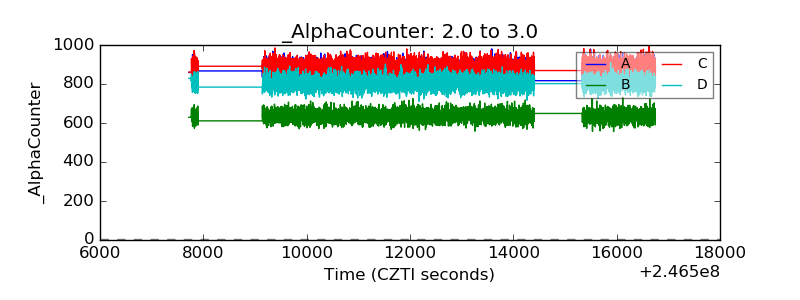 |
| _CPM_Rate | 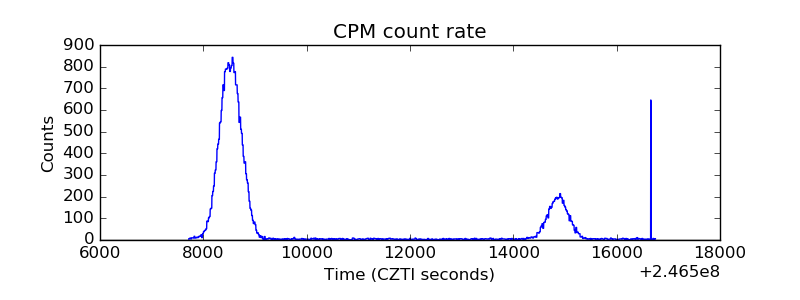 |
| CZT Counter | 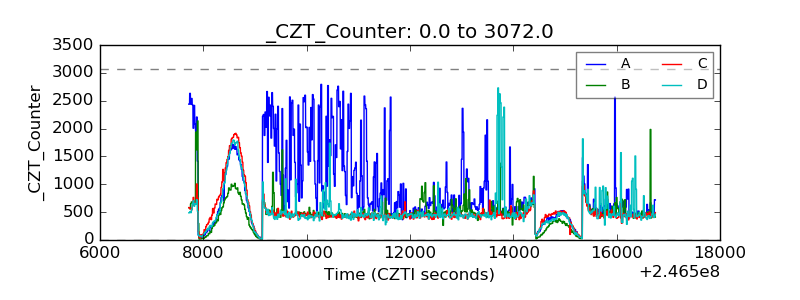 |
| +2.5 Volts monitor |  |
| +5 Volts monitor |  |
| _ROLL_ROT | 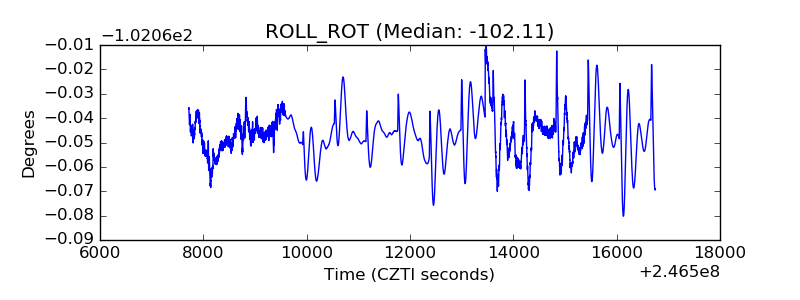 |
| _Roll_DEC | 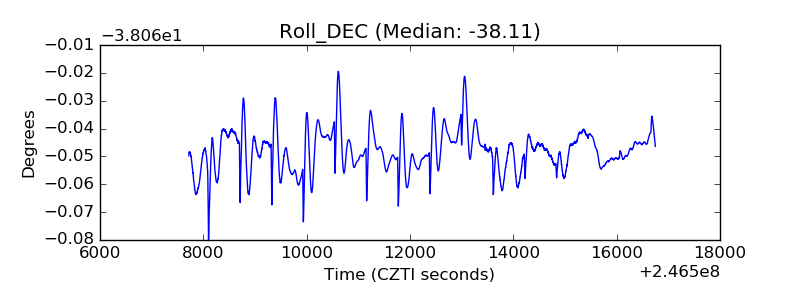 |
| _Roll_RA | 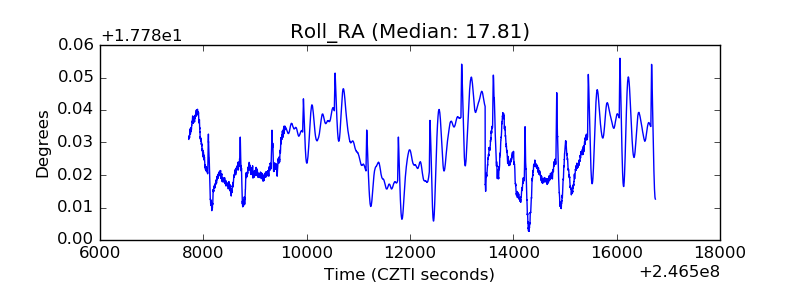 |
| Veto Counter | 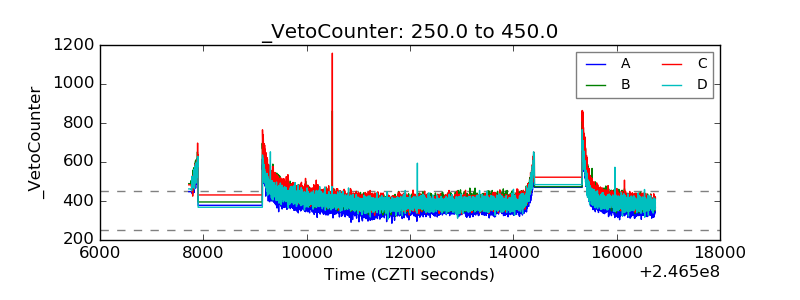 |