| Param | Original file | Final file |
|---|---|---|
| Filename | modeM0/AS1A04_171T01_9000001634_11206cztM0_level2.evt | modeM0/AS1A04_171T01_9000001634_11206cztM0_level2_quad_clean.evt |
| Size (bytes) | 668,341,440 | 61,721,280 |
| Size | 637.4 MB | 58.9 MB |
| Events in quadrant A | 9,589,045 | 237,484 |
| Events in quadrant B | 3,874,142 | 399,309 |
| Events in quadrant C | 2,862,044 | 403,363 |
| Events in quadrant D | 3,484,553 | 383,783 |
| Mode SS | |||
|---|---|---|---|
| Quadrant | BADHDUFLAG | Total packets | Discarded packets |
| A | 0 | 130 | 0 |
| B | 0 | 130 | 0 |
| C | 0 | 130 | 0 |
| D | 0 | 130 | 0 |
| Mode M0 | |||
|---|---|---|---|
| Quadrant | BADHDUFLAG | Total packets | Discarded packets |
| A | 0 | 32856 | 52 |
| B | 0 | 15704 | 46 |
| C | 0 | 13108 | 26 |
| D | 0 | 14632 | 40 |
| Mode M9 | |||
|---|---|---|---|
| Quadrant | BADHDUFLAG | Total packets | Discarded packets |
| A | 0 | 5 | 0 |
| B | 0 | 5 | 0 |
| C | 0 | 5 | 0 |
| D | 0 | 5 | 0 |
| Quadrant | Total seconds | Saturated seconds | Saturation percentage |
|---|---|---|---|
| A | 6354 | 2710 | 42.650299% |
| B | 6354 | 269 | 4.233554% |
| C | 6359 | 79 | 1.242334% |
| D | 6356 | 152 | 2.391441% |
Noise dominated data is calculated using 1-second bins in cleaned event files. If a bin has >2000 counts, and if more than 50% of those come from <1% of pixels, then it is considered to be noise-dominated and hence unusable.
| Quadrant | # 1 sec bins | Bins with >0 counts | Bins with >2000 counts | High rate bins dominated by noise | Noise dominated (total time) | Noise dominated (detector-on time) | Marked lightcurve |
|---|---|---|---|---|---|---|---|
| A | 6926 | 6365 | 2320 | 2320 | 33.50% | 36.45% | 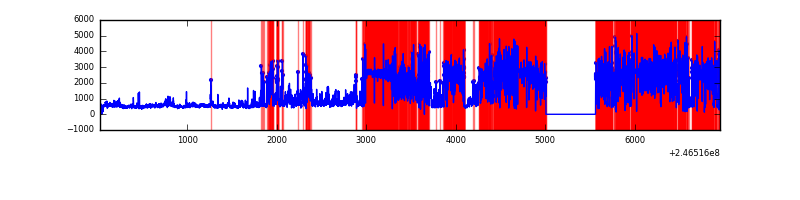 |
| B | 6924 | 6362 | 101 | 101 | 1.46% | 1.59% | 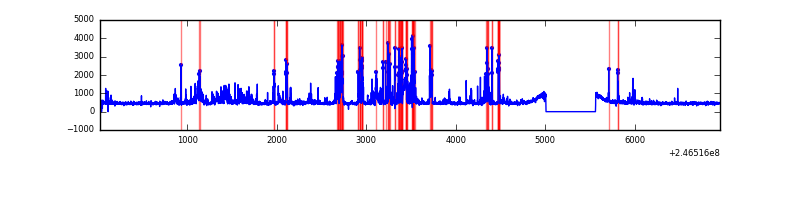 |
| C | 6927 | 6365 | 0 | 0 | 0.00% | 0.00% | 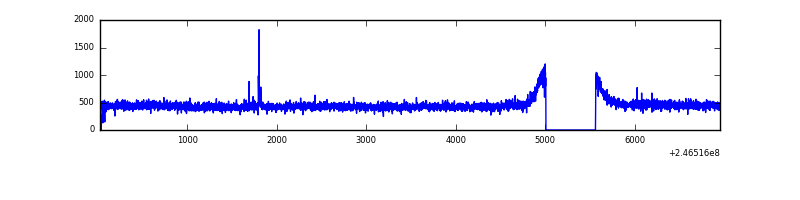 |
| D | 6927 | 6369 | 60 | 60 | 0.87% | 0.94% | 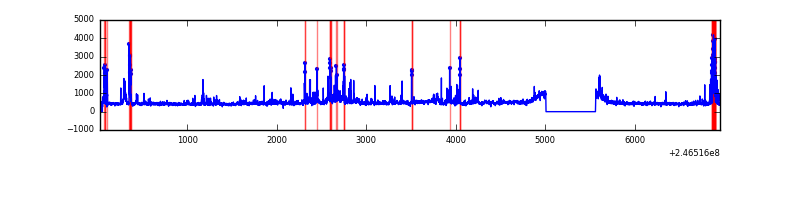 |
Top three noisy pixels from each quadrant. If the there are fewer than three noisy pixels in the level2.evt file, extra rows are filled as -1
| Pixel properties | Quadrant properties | ||||||
|---|---|---|---|---|---|---|---|
| Quadrant | DetID | PixID | Counts | Sigma | Mean | Median | Sigma |
| A | 15 | 239 | 7087246 | 63736.11 | 537 | 525 | 111.2 |
| A | 8 | 15 | 328488 | 2949.61 | 537 | 525 | 111.2 |
| A | 8 | 5 | 62652 | 558.75 | 537 | 525 | 111.2 |
| B | 4 | 239 | 866887 | 6026.0 | 741 | 721 | 143.7 |
| B | 4 | 80 | 40174 | 274.48 | 741 | 721 | 143.7 |
| B | 15 | 204 | 27511 | 186.38 | 741 | 721 | 143.7 |
| C | 12 | 4 | 14361 | 79.86 | 730 | 732 | 170.7 |
| C | 13 | 61 | 5420 | 27.47 | 730 | 732 | 170.7 |
| C | 14 | 67 | 1870 | 6.67 | 730 | 732 | 170.7 |
| D | 2 | 136 | 236593 | 1368.35 | 719 | 698 | 172.4 |
| D | 8 | 195 | 176742 | 1021.17 | 719 | 698 | 172.4 |
| D | 14 | 34 | 74370 | 427.35 | 719 | 698 | 172.4 |
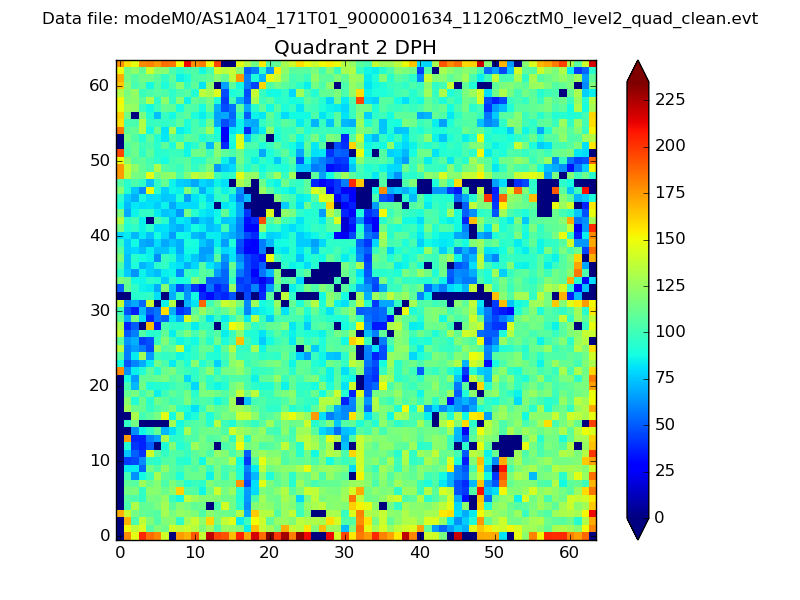
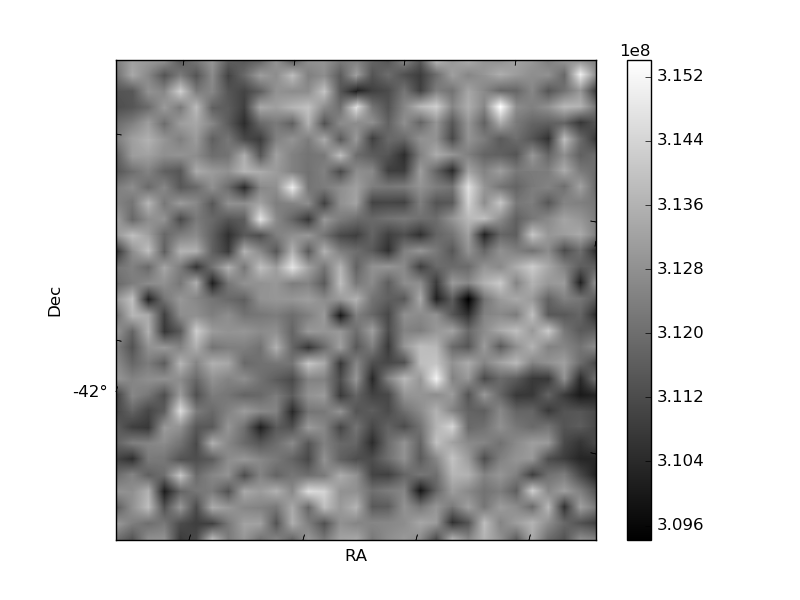
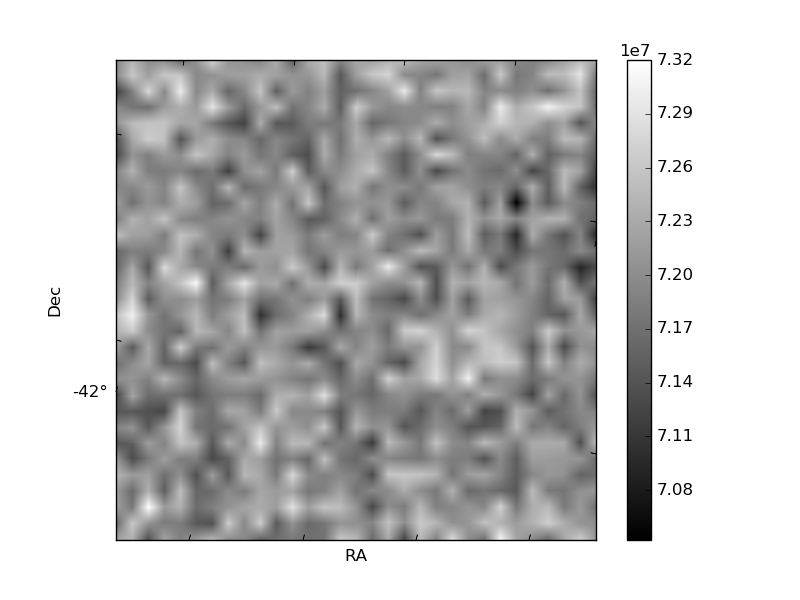
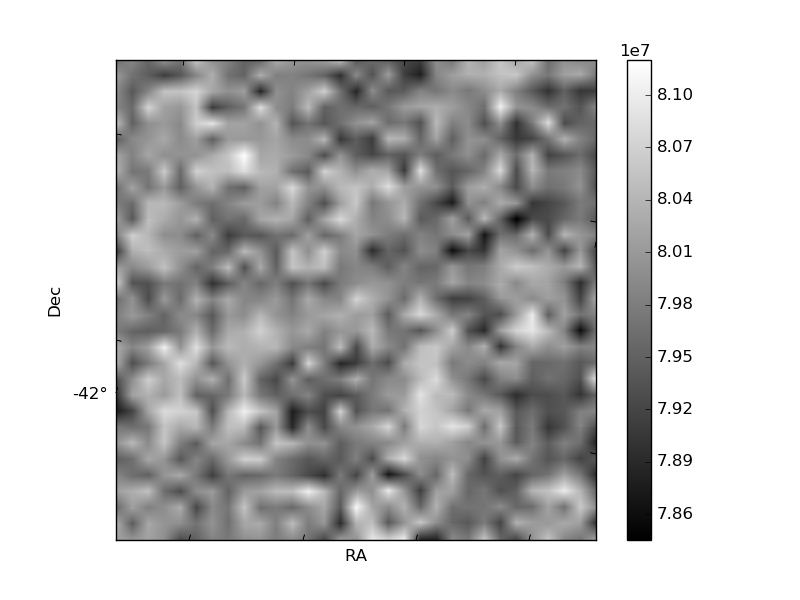
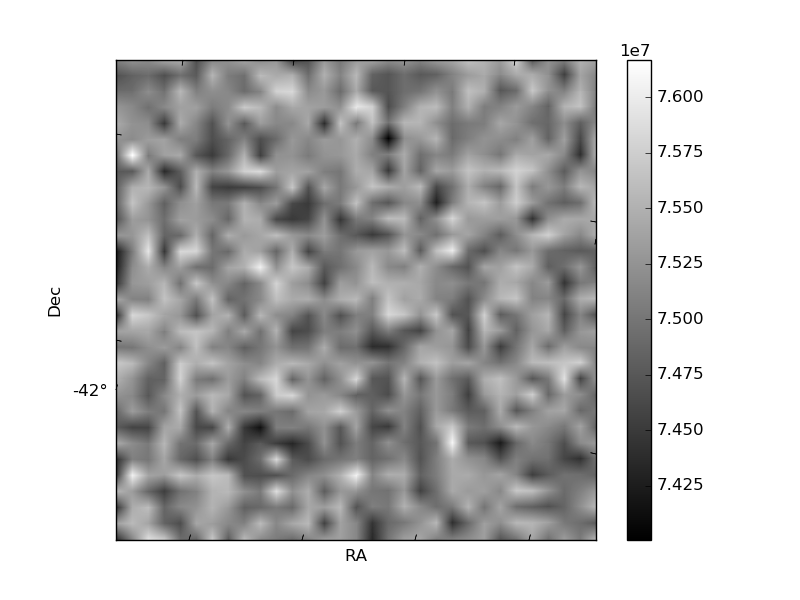
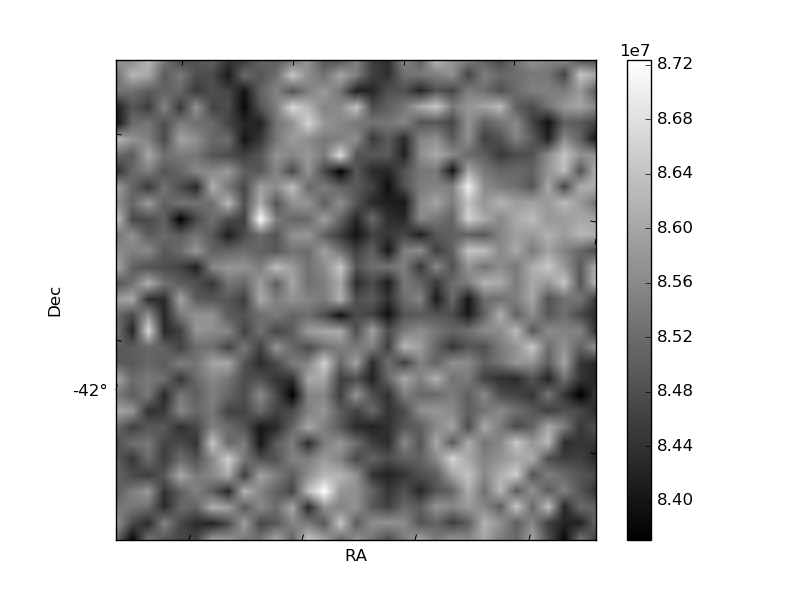
Histogram calculated using DETX and DETY for each event in the final _common_clean file
| Quadrant A | 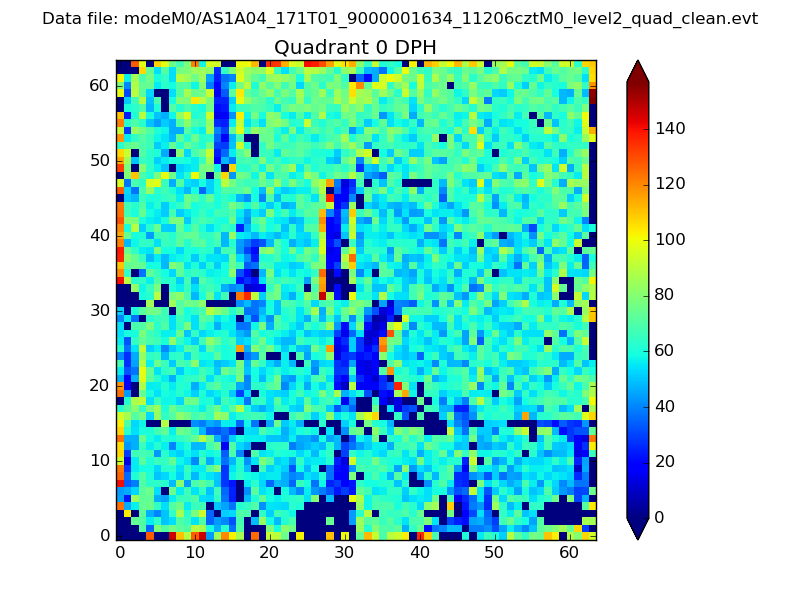 |
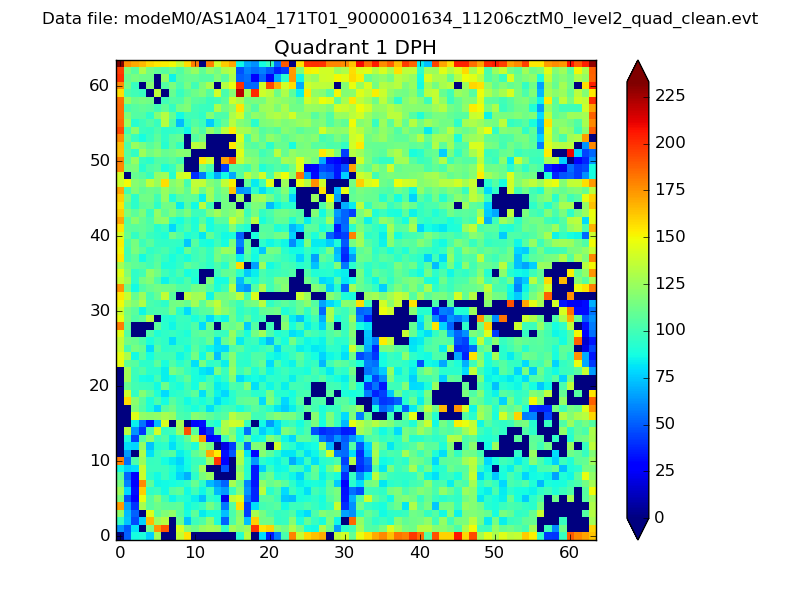 |
Quadrant B |
|---|---|---|---|
| Quadrant D | 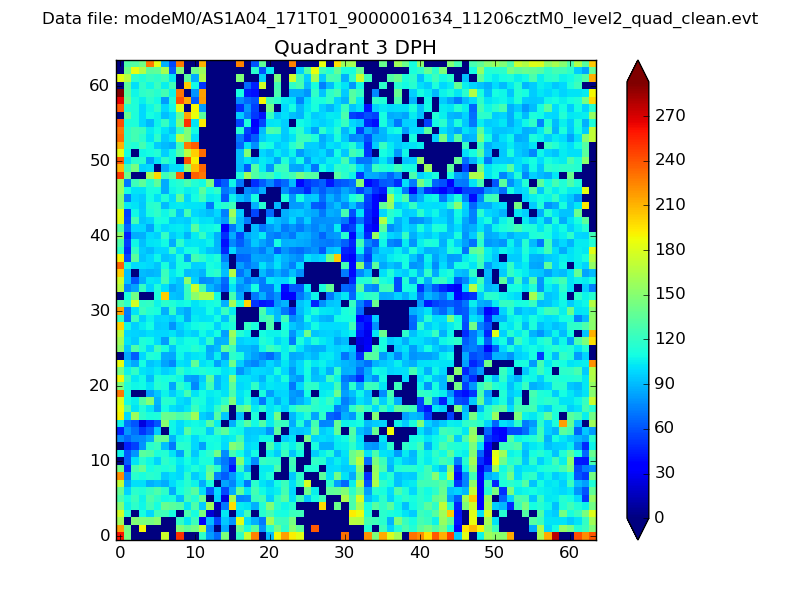 |
 |
Quadrant C |
| Plot type | Count rate plots | Images |
|---|---|---|
| Comparison with Poisson distribution Blue bars denote a histogram of data divided into 1 sec bins. Red curve is a Poisson curve with rate = median count rate of data. |
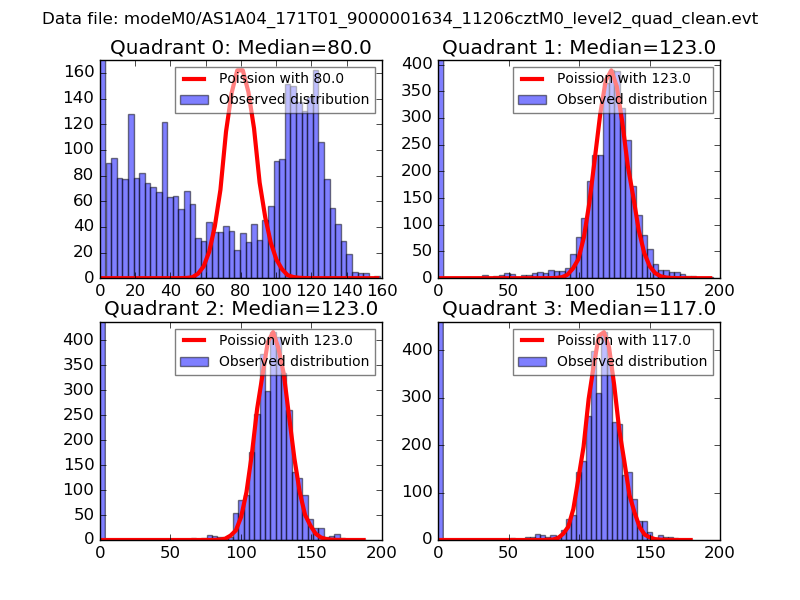 |
 |
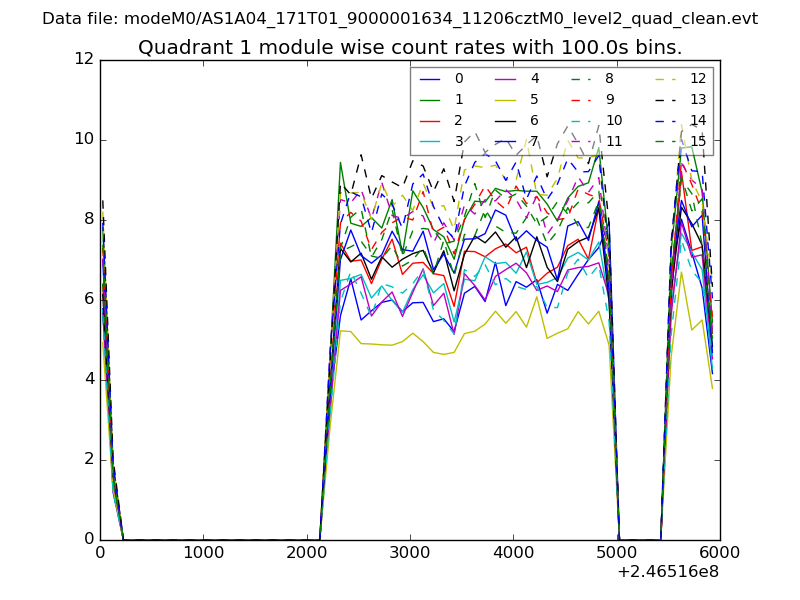
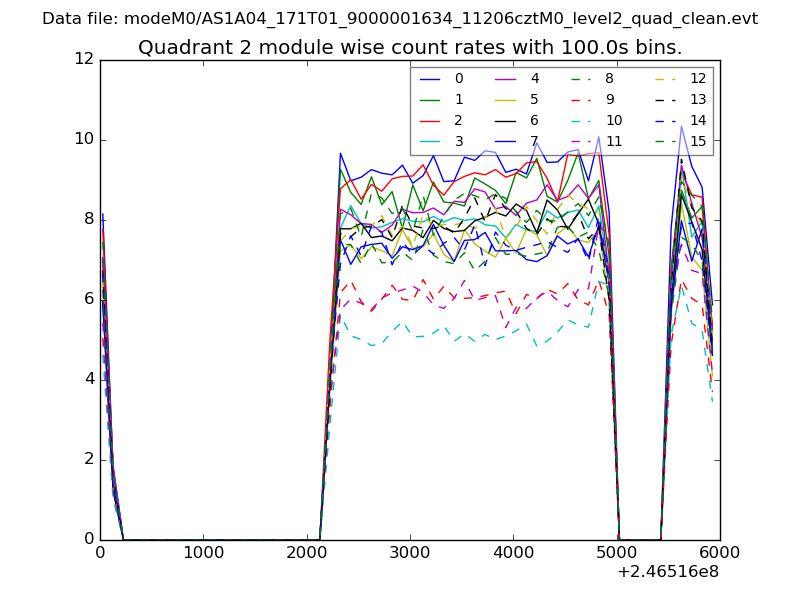
| Quadrant-wise count rates Data is divided into 100 sec bins |
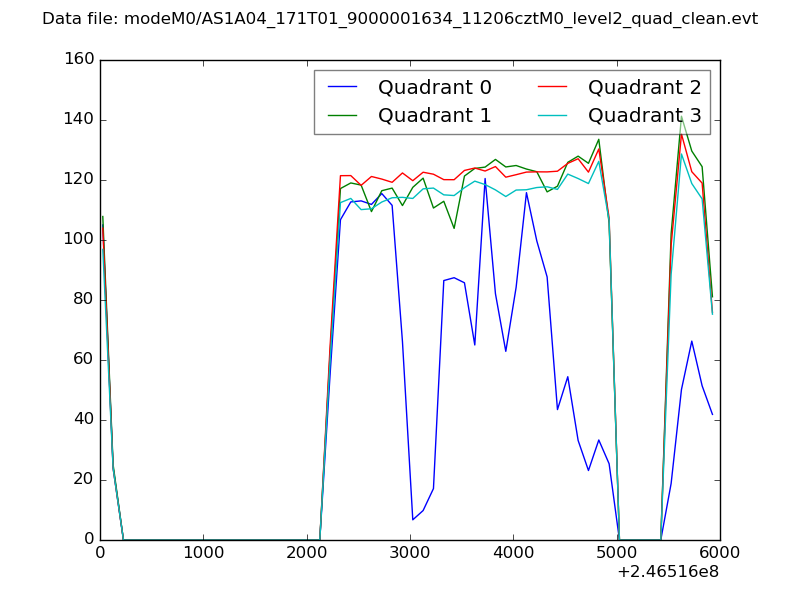 |
|
| Module-wise count rates for Quadrant A Data is divided into 100 sec bins |
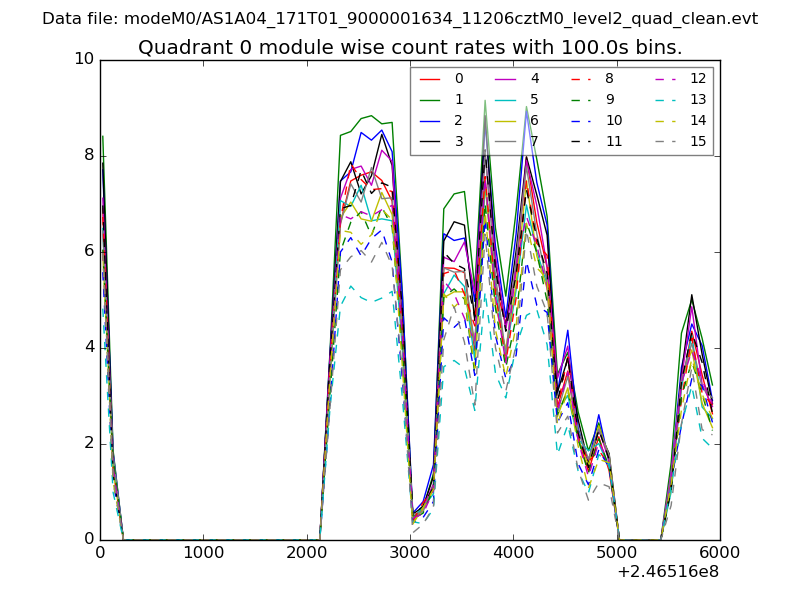 |
 |
| Module-wise count rates for Quadrant B Data is divided into 100 sec bins |
 |
 |
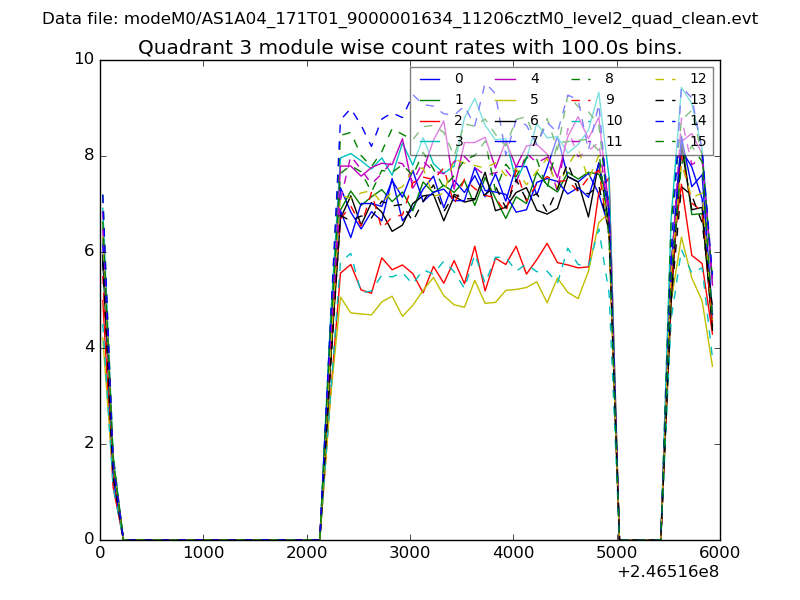
| Module-wise count rates for Quadrant C Data is divided into 100 sec bins |
 |
 |
| Module-wise count rates for Quadrant D Data is divided into 100 sec bins |
 |
 |
| Parameter | Plot |
|---|---|
| CZT HV Monitor | 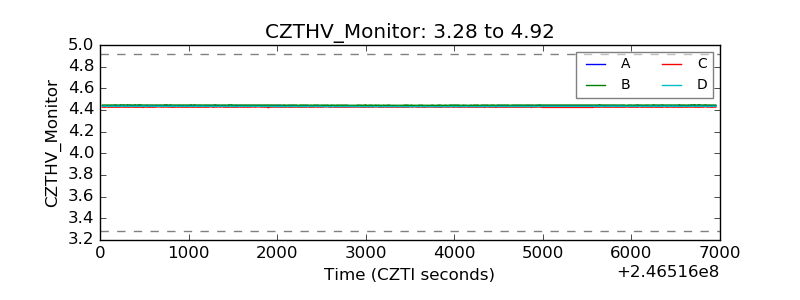 |
| D_VDD | 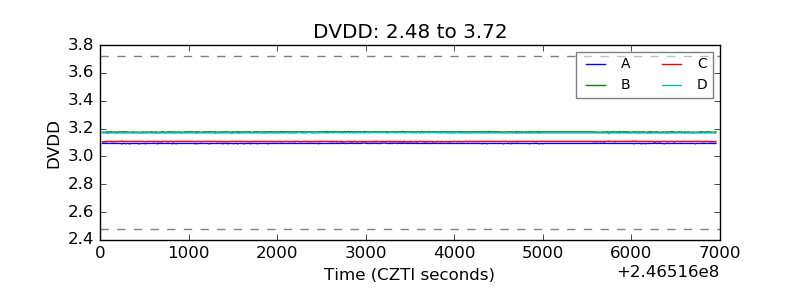 |
| Temperature 1 |  |
| Veto HV Monitor | 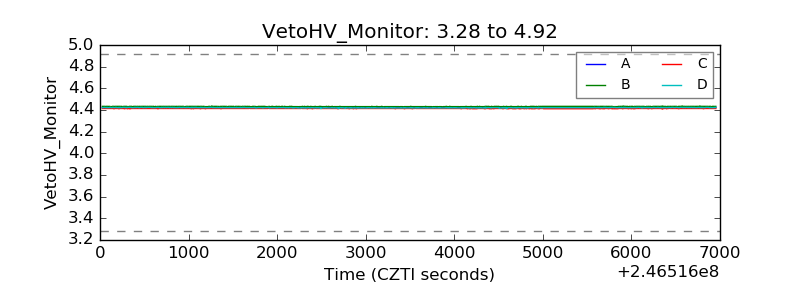 |
| Veto LLD | 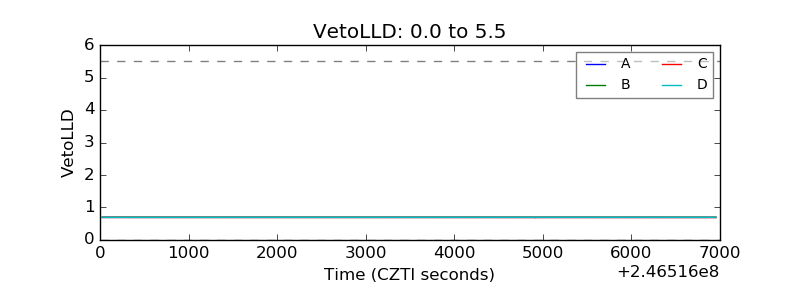 |
| Alpha Counter | 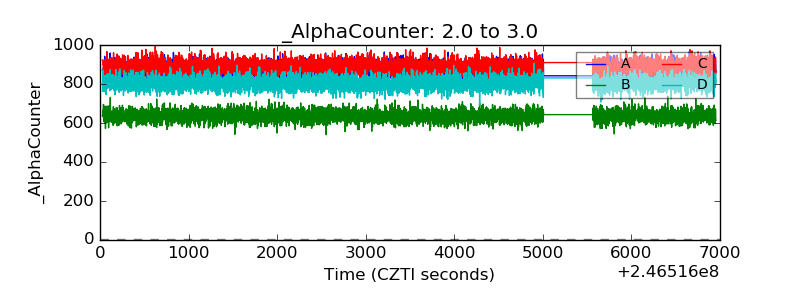 |
| _CPM_Rate | 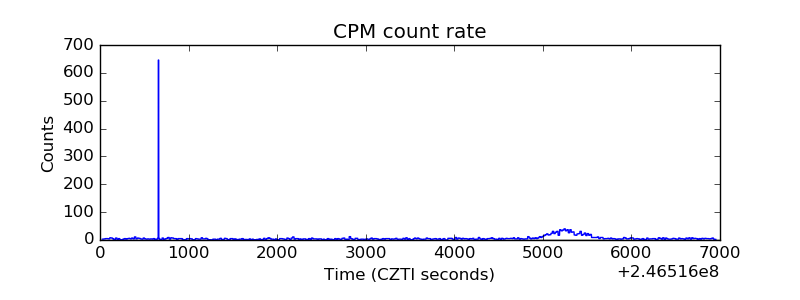 |
| CZT Counter | 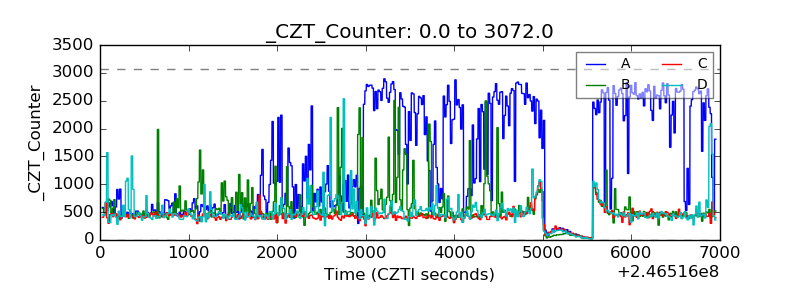 |
| +2.5 Volts monitor | 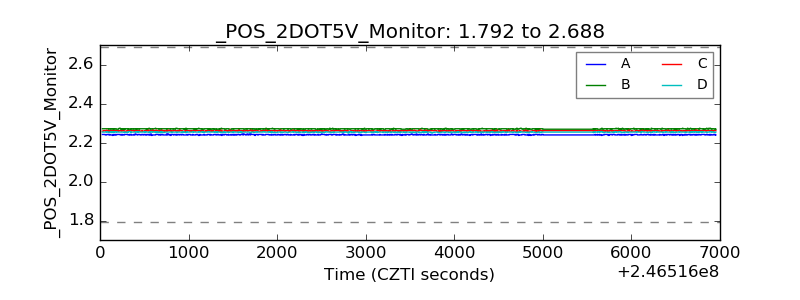 |
| +5 Volts monitor |  |
| _ROLL_ROT | 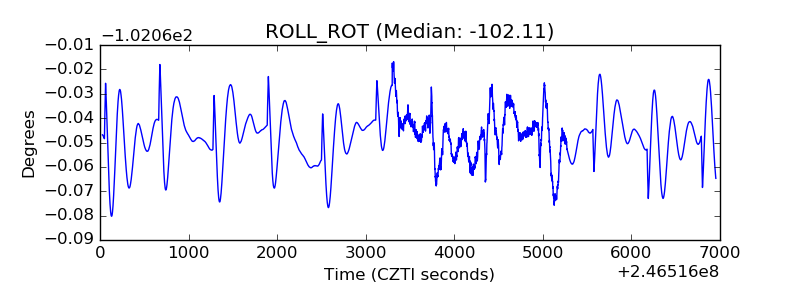 |
| _Roll_DEC | 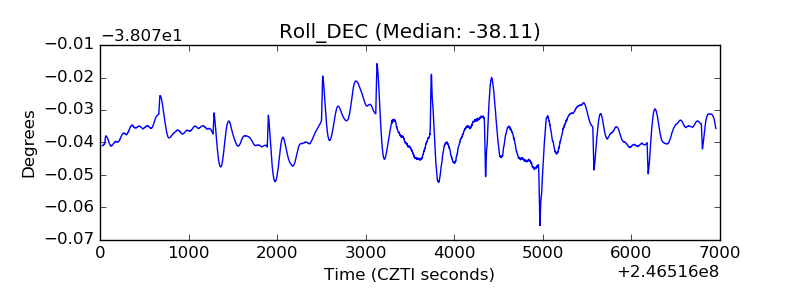 |
| _Roll_RA | 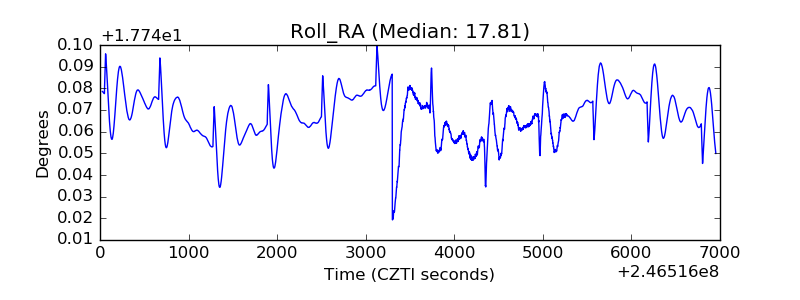 |
| Veto Counter | 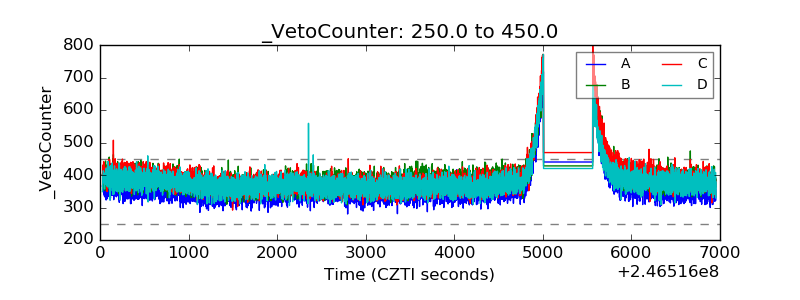 |