| Param | Original file | Final file |
|---|---|---|
| Filename | modeM0/AS1G08_075T01_9000001636cztM0_level2.fits | modeM0/AS1G08_075T01_9000001636cztM0_level2_quad_clean.evt |
| Size (bytes) | 415,166,400 | 353,776,320 |
| Size | 395.9 MB | 337.4 MB |
| Events in quadrant A | 2,443,606 | 1,952,758 |
| Events in quadrant B | 2,441,552 | 1,993,012 |
| Events in quadrant C | 2,498,106 | 1,950,976 |
| Events in quadrant D | 2,098,665 | 1,726,305 |
| Mode M0 | |||
|---|---|---|---|
| Quadrant | BADHDUFLAG | Total packets | Discarded packets |
| A | 0 | 131021 | 0 |
| B | 0 | 103096 | 0 |
| C | 0 | 92457 | 0 |
| D | 0 | 115002 | 0 |
| Mode M9 | |||
|---|---|---|---|
| Quadrant | BADHDUFLAG | Total packets | Discarded packets |
| A | 0 | 84 | 0 |
| B | 0 | 82 | 0 |
| C | 0 | 83 | 0 |
| D | 0 | 84 | 0 |
| Mode SS | |||
|---|---|---|---|
| Quadrant | BADHDUFLAG | Total packets | Discarded packets |
| A | 0 | 922 | 0 |
| B | 0 | 918 | 0 |
| C | 0 | 920 | 0 |
| D | 0 | 920 | 0 |
| Quadrant | Total seconds | Saturated seconds | Saturation percentage |
|---|---|---|---|
| A | 44934 | 2174 | 4.838207% |
| B | 45020 | 1045 | 2.321191% |
| C | 45009 | 260 | 0.577662% |
| D | 45005 | 1727 | 3.837351% |
Noise dominated data is calculated using 1-second bins in cleaned event files. If a bin has >2000 counts, and if more than 50% of those come from <1% of pixels, then it is considered to be noise-dominated and hence unusable.
| Quadrant | # 1 sec bins | Bins with >0 counts | Bins with >2000 counts | High rate bins dominated by noise | Noise dominated (total time) | Noise dominated (detector-on time) | Marked lightcurve |
|---|---|---|---|---|---|---|---|
| A | 54998 | 45063 | 0 | 0 | 0.00% | 0.00% |  |
| B | 54998 | 45132 | 0 | 0 | 0.00% | 0.00% |  |
| C | 54998 | 45131 | 0 | 0 | 0.00% | 0.00% | 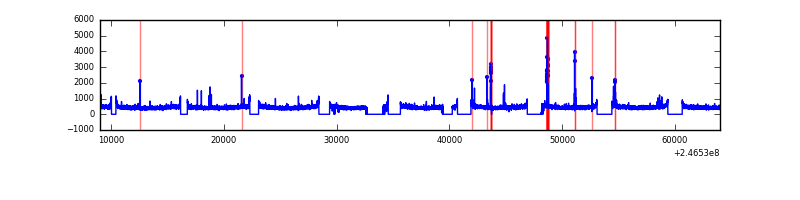 |
| D | 54998 | 45099 | 0 | 0 | 0.00% | 0.00% |  |
Top three noisy pixels from each quadrant. If the there are fewer than three noisy pixels in the level2.evt file, extra rows are filled as -1
| Pixel properties | Quadrant properties | ||||||
|---|---|---|---|---|---|---|---|
| Quadrant | DetID | PixID | Counts | Sigma | Mean | Median | Sigma |
| A | 0 | 29 | 2426 | 11.28 | 636 | 595 | 162.3 |
| A | 7 | 110 | 1989 | 8.59 | 636 | 595 | 162.3 |
| A | 0 | 30 | 1844 | 7.7 | 636 | 595 | 162.3 |
| B | 2 | 9 | 2095 | 11.67 | 642 | 611 | 127.2 |
| B | 3 | 17 | 1648 | 8.15 | 642 | 611 | 127.2 |
| B | 12 | 226 | 1601 | 7.79 | 642 | 611 | 127.2 |
| C | 1 | 81 | 1955 | 7.77 | 659 | 613 | 172.6 |
| C | 1 | 80 | 1906 | 7.49 | 659 | 613 | 172.6 |
| C | 2 | 191 | 1747 | 6.57 | 659 | 613 | 172.6 |
| D | 6 | 231 | 1602 | 6.62 | 598 | 543 | 160.0 |
| D | 3 | 14 | 1548 | 6.28 | 598 | 543 | 160.0 |
| D | 7 | 5 | 1489 | 5.91 | 598 | 543 | 160.0 |
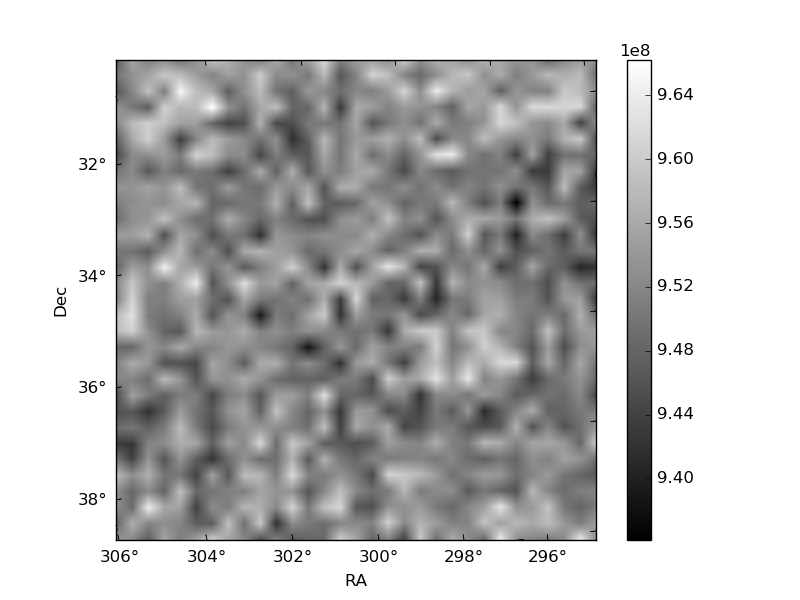
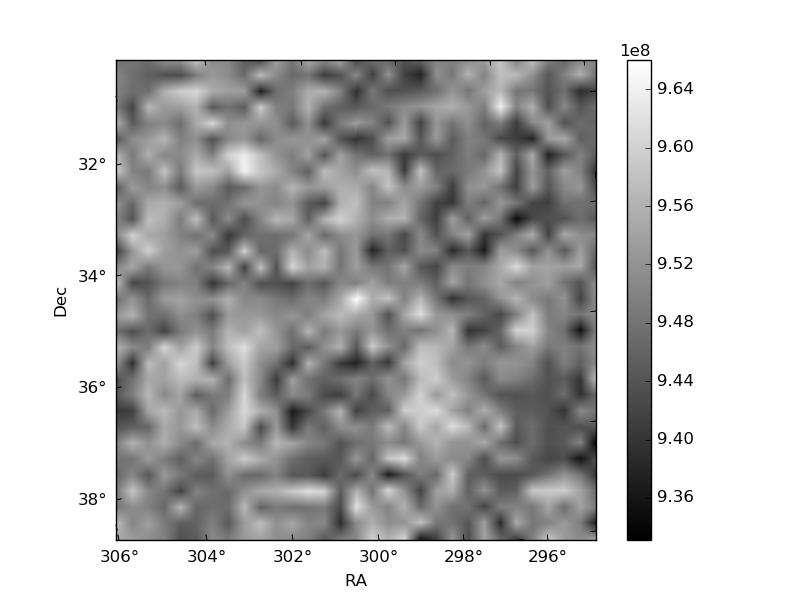
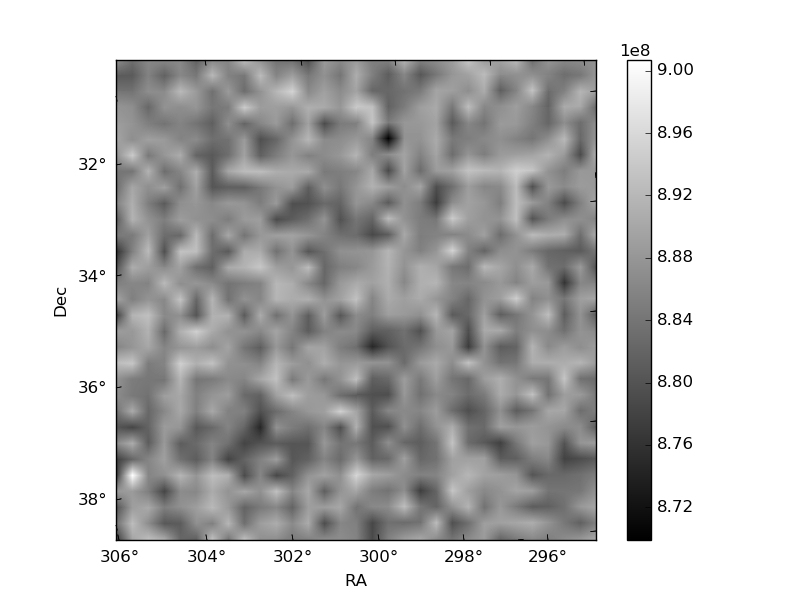
Histogram calculated using DETX and DETY for each event in the final _common_clean file
| Quadrant A | 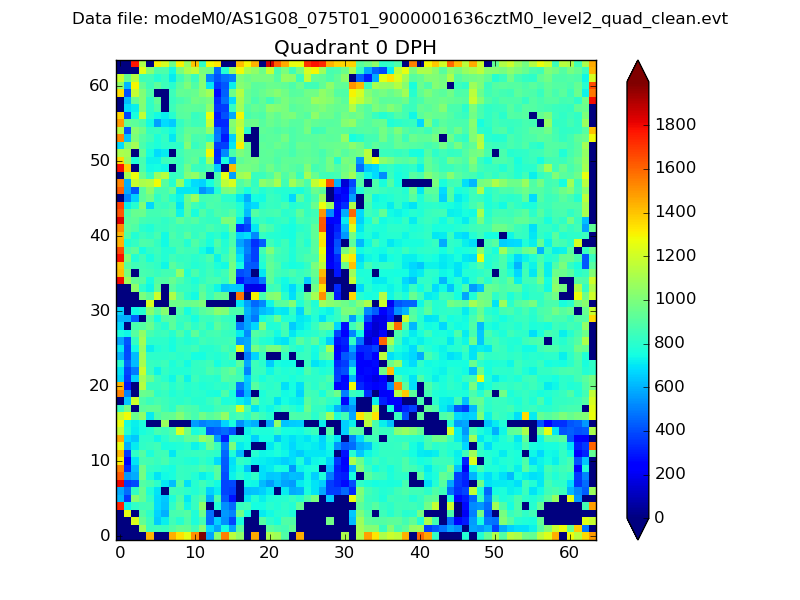 |
 |
Quadrant B |
|---|---|---|---|
| Quadrant D | 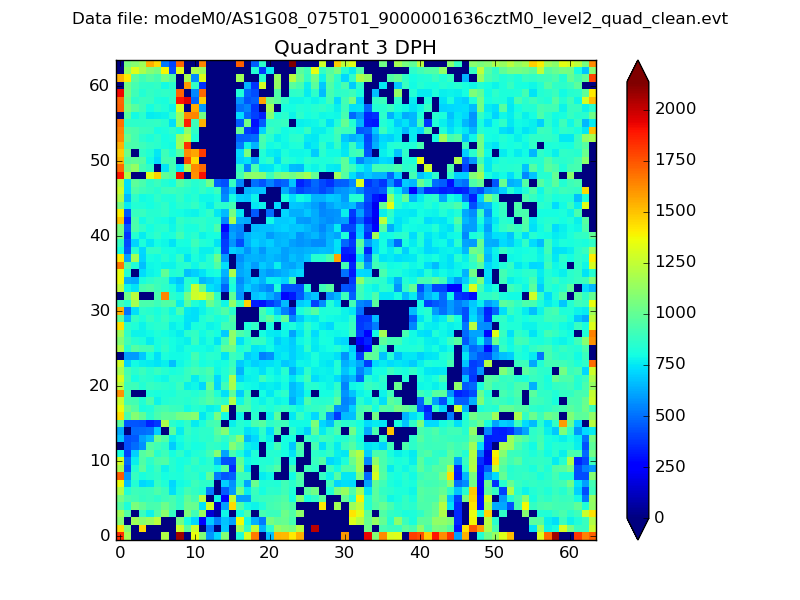 |
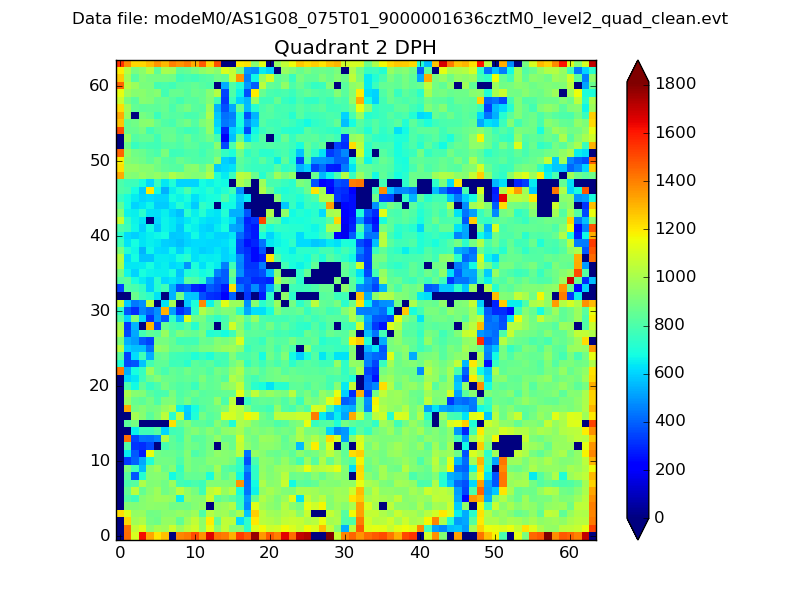 |
Quadrant C |
| Plot type | Count rate plots | Images |
|---|---|---|
| Comparison with Poisson distribution Blue bars denote a histogram of data divided into 1 sec bins. Red curve is a Poisson curve with rate = median count rate of data. |
 |
 |
| Quadrant-wise count rates Data is divided into 100 sec bins |
 |
|
| Module-wise count rates for Quadrant A Data is divided into 100 sec bins |
 |
 |
| Module-wise count rates for Quadrant B Data is divided into 100 sec bins |
 |
 |
| Module-wise count rates for Quadrant C Data is divided into 100 sec bins |
 |
 |
| Module-wise count rates for Quadrant D Data is divided into 100 sec bins |
 |
 |
| Parameter | Plot |
|---|---|
| CZT HV Monitor |  |
| D_VDD | 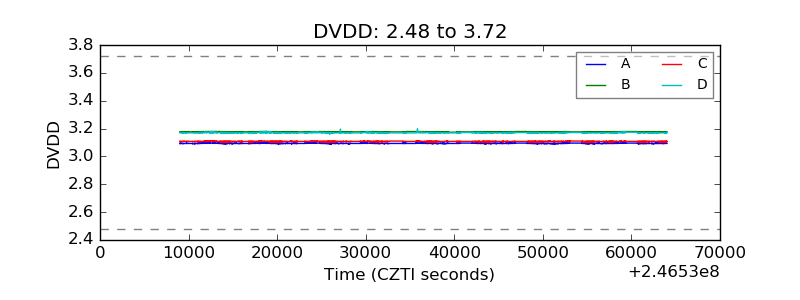 |
| Temperature 1 |  |
| Veto HV Monitor | 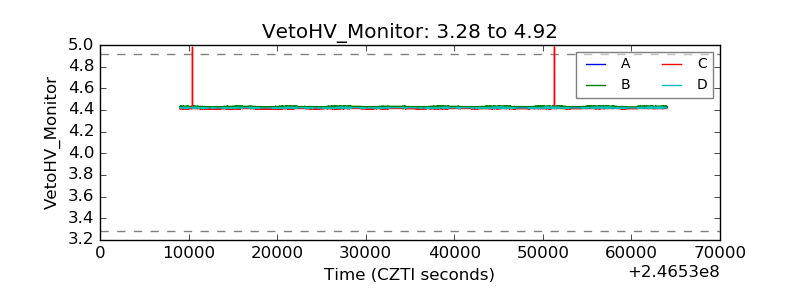 |
| Veto LLD | 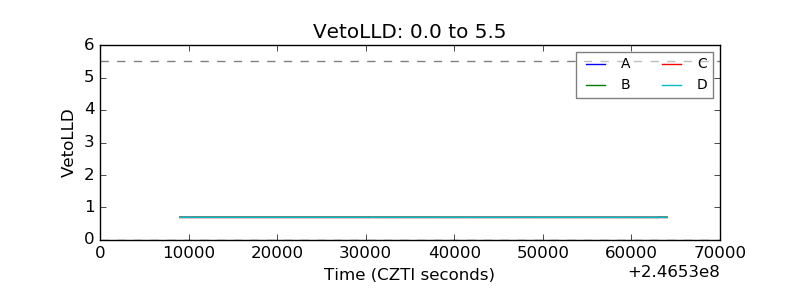 |
| Alpha Counter | 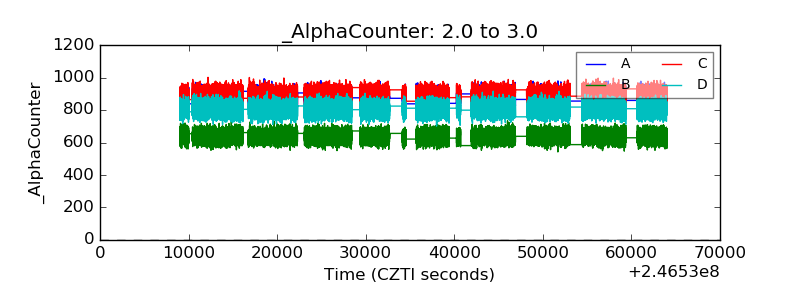 |
| _CPM_Rate | 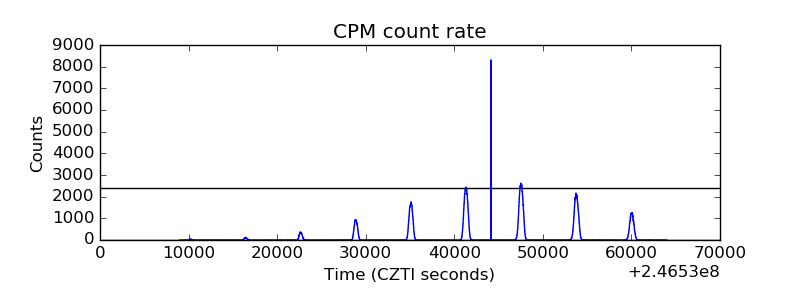 |
| CZT Counter |  |
| +2.5 Volts monitor |  |
| +5 Volts monitor | 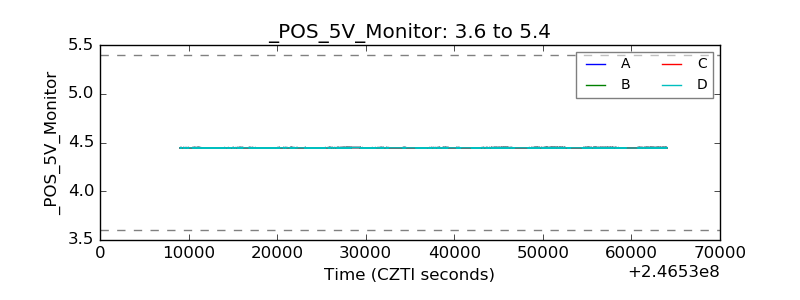 |
| _ROLL_ROT | 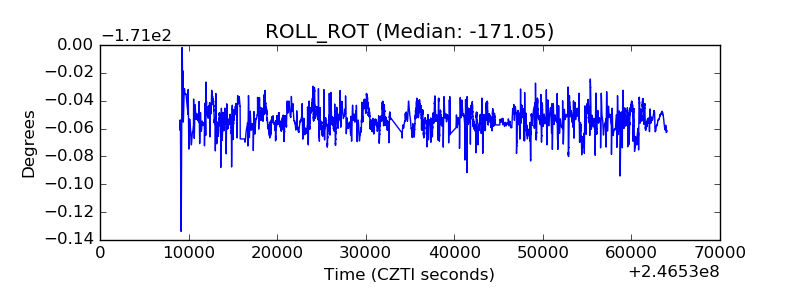 |
| _Roll_DEC |  |
| _Roll_RA | 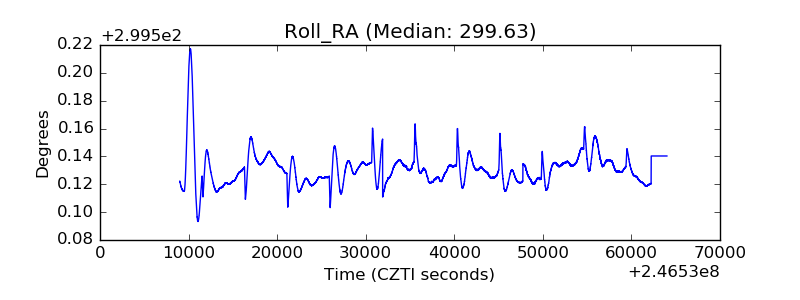 |
| Veto Counter |  |