| Param | Original file | Final file |
|---|---|---|
| Filename | modeM0/AS1G08_075T01_9000001636_11211cztM0_level2.evt | modeM0/AS1G08_075T01_9000001636_11211cztM0_level2_quad_clean.evt |
| Size (bytes) | 1,087,277,760 | 165,882,240 |
| Size | 1.0 GB | 158.2 MB |
| Events in quadrant A | 9,630,584 | 1,017,893 |
| Events in quadrant B | 8,144,307 | 1,030,360 |
| Events in quadrant C | 6,206,557 | 1,040,914 |
| Events in quadrant D | 8,014,039 | 980,876 |
| Mode M0 | |||
|---|---|---|---|
| Quadrant | BADHDUFLAG | Total packets | Discarded packets |
| A | 0 | 37758 | 4 |
| B | 0 | 33237 | 8 |
| C | 0 | 28318 | 3 |
| D | 0 | 33358 | 4 |
| Mode M9 | |||
|---|---|---|---|
| Quadrant | BADHDUFLAG | Total packets | Discarded packets |
| A | 0 | 17 | 0 |
| B | 0 | 17 | 0 |
| C | 0 | 17 | 0 |
| D | 0 | 17 | 0 |
| Mode SS | |||
|---|---|---|---|
| Quadrant | BADHDUFLAG | Total packets | Discarded packets |
| A | 0 | 280 | 0 |
| B | 0 | 280 | 0 |
| C | 0 | 280 | 0 |
| D | 0 | 280 | 0 |
| Quadrant | Total seconds | Saturated seconds | Saturation percentage |
|---|---|---|---|
| A | 13806 | 610 | 4.418369% |
| B | 13803 | 543 | 3.933927% |
| C | 13806 | 132 | 0.956106% |
| D | 13805 | 515 | 3.730532% |
Noise dominated data is calculated using 1-second bins in cleaned event files. If a bin has >2000 counts, and if more than 50% of those come from <1% of pixels, then it is considered to be noise-dominated and hence unusable.
| Quadrant | # 1 sec bins | Bins with >0 counts | Bins with >2000 counts | High rate bins dominated by noise | Noise dominated (total time) | Noise dominated (detector-on time) | Marked lightcurve |
|---|---|---|---|---|---|---|---|
| A | 15576 | 13809 | 224 | 224 | 1.44% | 1.62% |  |
| B | 15576 | 13808 | 213 | 213 | 1.37% | 1.54% | 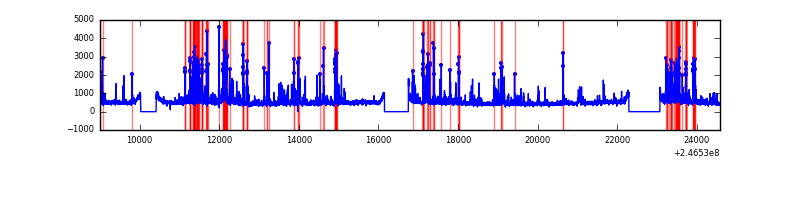 |
| C | 15576 | 13809 | 2 | 2 | 0.01% | 0.01% | 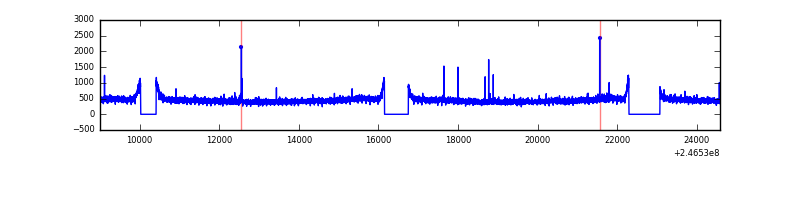 |
| D | 15576 | 13809 | 263 | 263 | 1.69% | 1.90% | 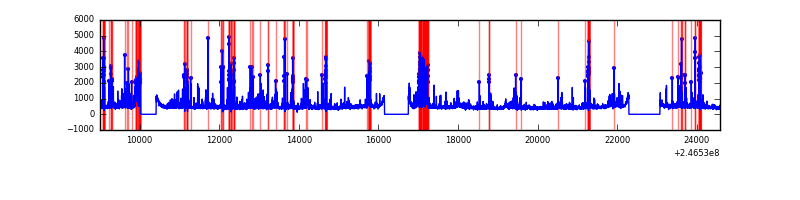 |
Top three noisy pixels from each quadrant. If the there are fewer than three noisy pixels in the level2.evt file, extra rows are filled as -1
| Pixel properties | Quadrant properties | ||||||
|---|---|---|---|---|---|---|---|
| Quadrant | DetID | PixID | Counts | Sigma | Mean | Median | Sigma |
| A | 8 | 5 | 1768453 | 5390.24 | 1603 | 1564 | 327.8 |
| A | 8 | 15 | 796289 | 2424.46 | 1603 | 1564 | 327.8 |
| A | 15 | 174 | 420729 | 1278.74 | 1603 | 1564 | 327.8 |
| B | 4 | 239 | 1336317 | 4324.15 | 1605 | 1561 | 308.7 |
| B | 15 | 204 | 242714 | 781.25 | 1605 | 1561 | 308.7 |
| B | 4 | 80 | 90692 | 288.75 | 1605 | 1561 | 308.7 |
| C | 14 | 234 | 25096 | 63.78 | 1581 | 1588 | 368.6 |
| C | 13 | 61 | 11961 | 28.14 | 1581 | 1588 | 368.6 |
| C | 5 | 128 | 8940 | 19.95 | 1581 | 1588 | 368.6 |
| D | 2 | 14 | 458816 | 1216.65 | 1556 | 1513 | 375.9 |
| D | 13 | 104 | 395810 | 1049.02 | 1556 | 1513 | 375.9 |
| D | 12 | 17 | 337877 | 894.89 | 1556 | 1513 | 375.9 |
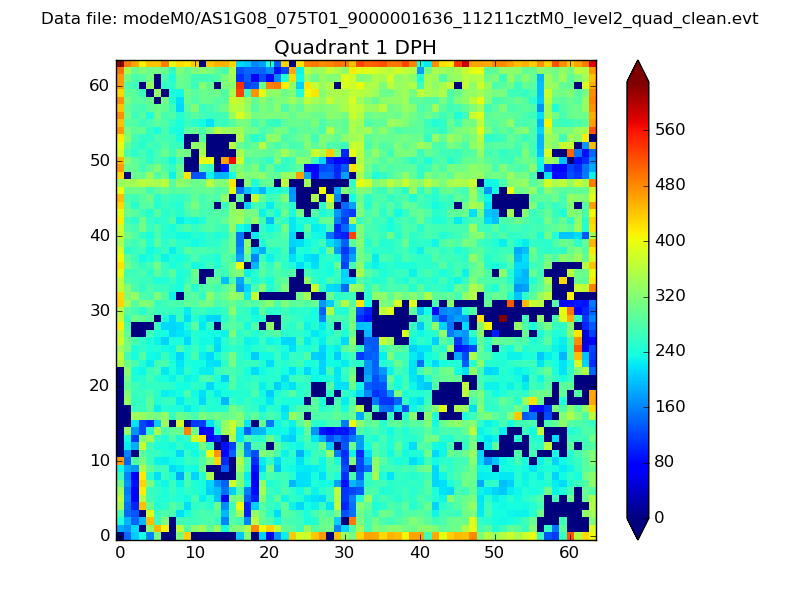
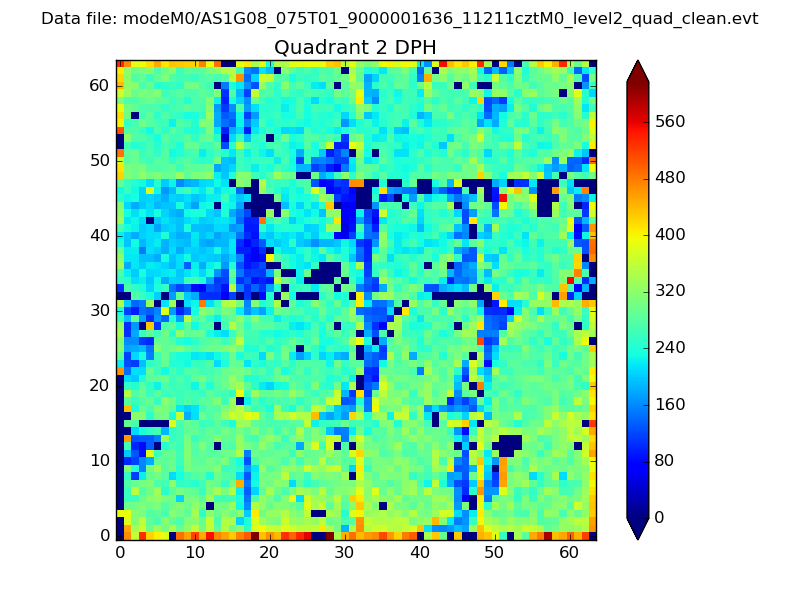
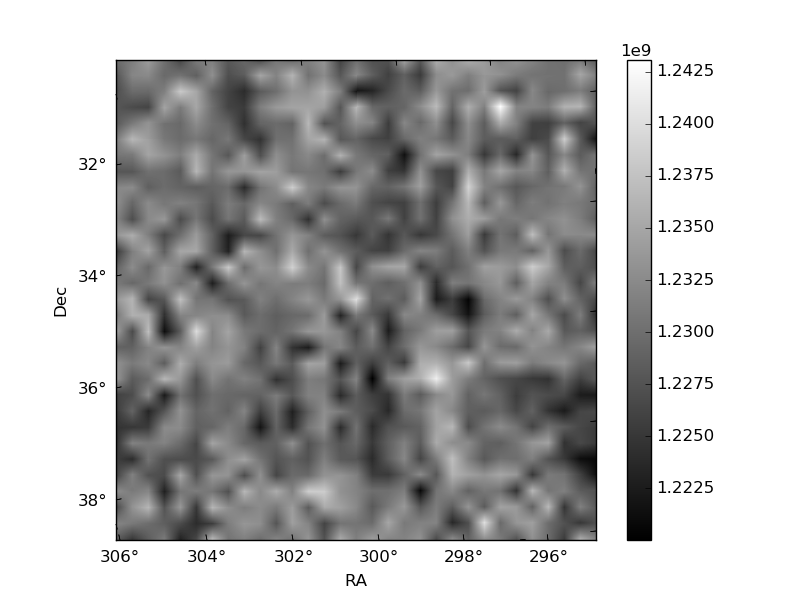
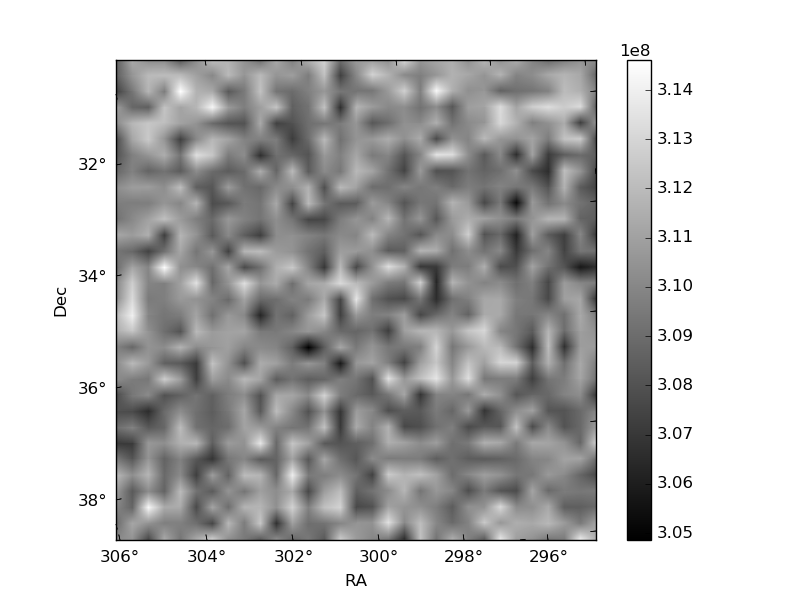
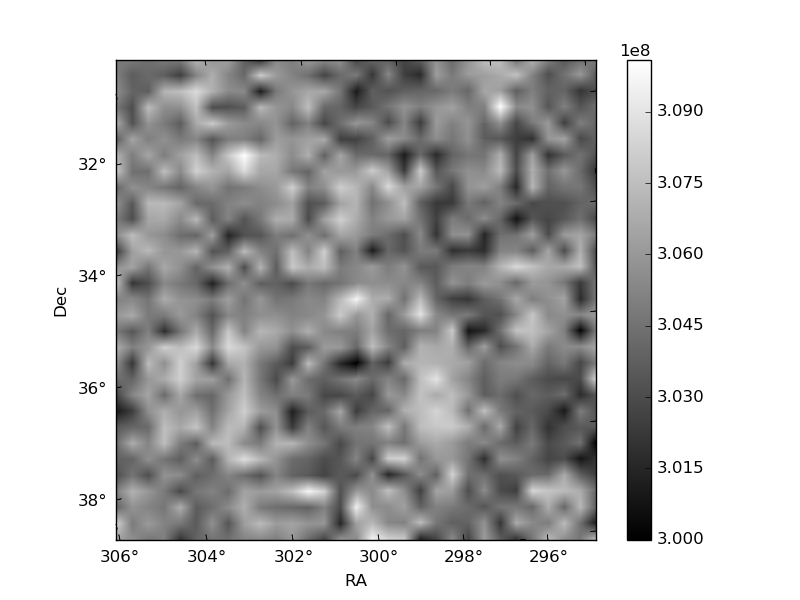
Histogram calculated using DETX and DETY for each event in the final _common_clean file
| Quadrant A | 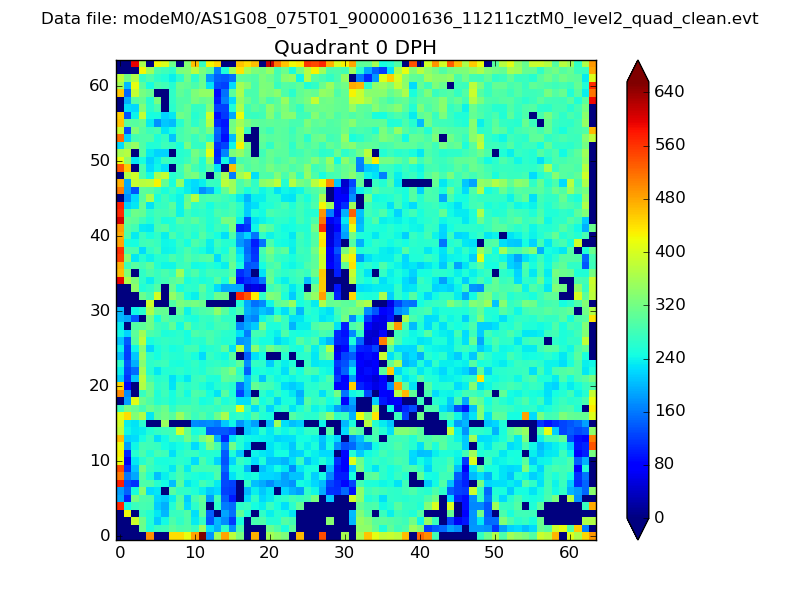 |
 |
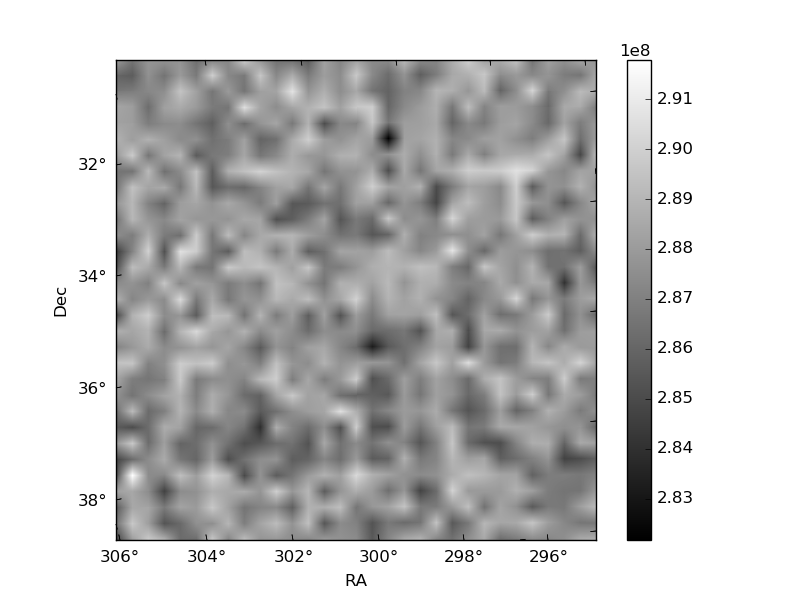
Quadrant B |
|---|---|---|---|
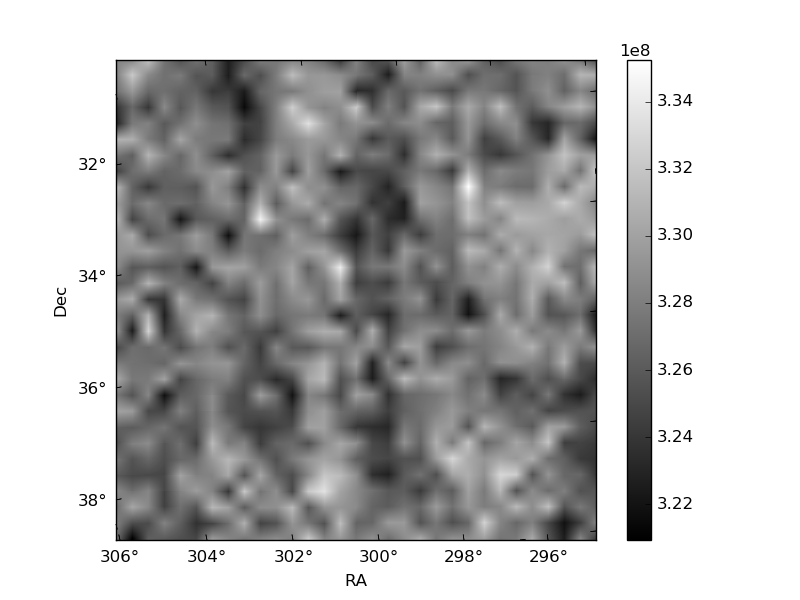
| Quadrant D | 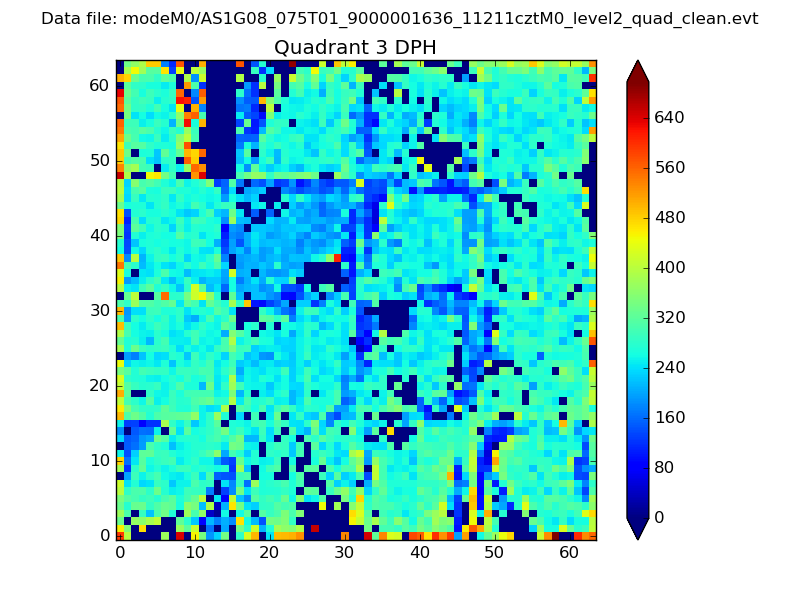 |
 |
Quadrant C |
| Plot type | Count rate plots | Images |
|---|---|---|
| Comparison with Poisson distribution Blue bars denote a histogram of data divided into 1 sec bins. Red curve is a Poisson curve with rate = median count rate of data. |
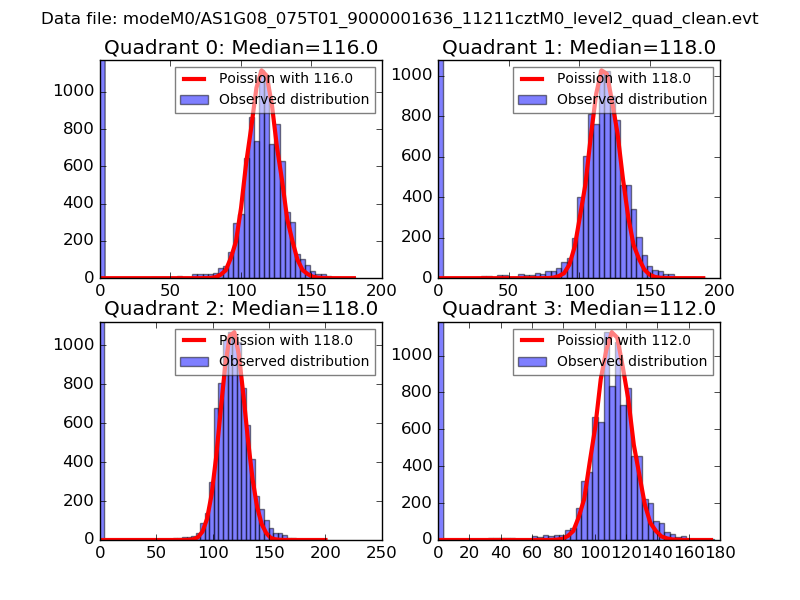 |
 |
| Quadrant-wise count rates Data is divided into 100 sec bins |
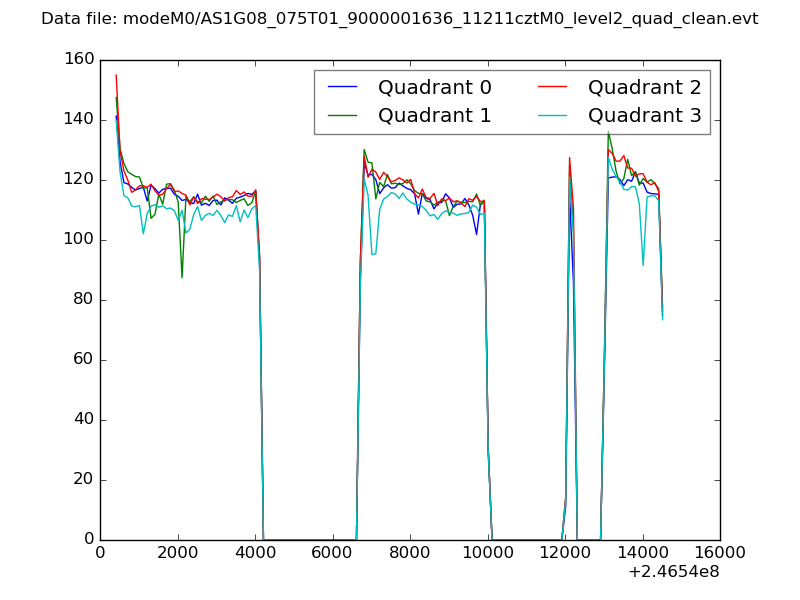 |
|
| Module-wise count rates for Quadrant A Data is divided into 100 sec bins |
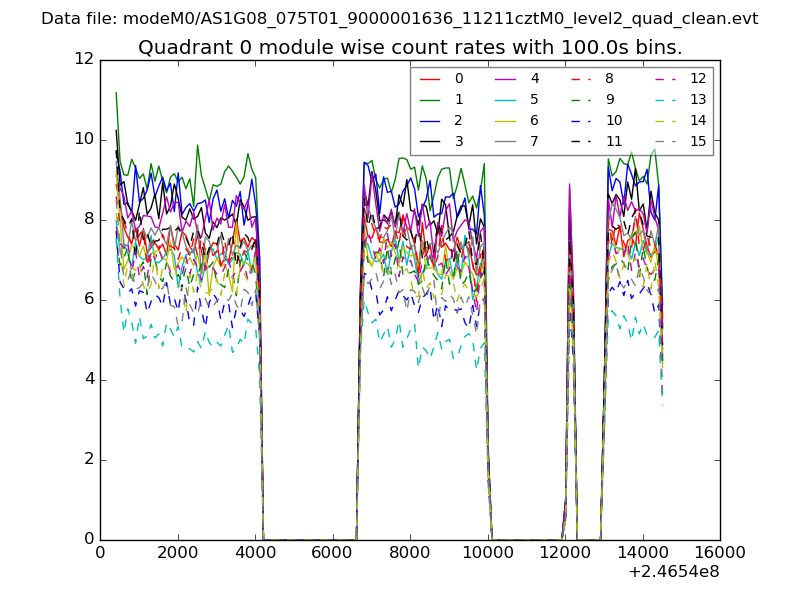 |
 |
| Module-wise count rates for Quadrant B Data is divided into 100 sec bins |
 |
 |
| Module-wise count rates for Quadrant C Data is divided into 100 sec bins |
 |
 |
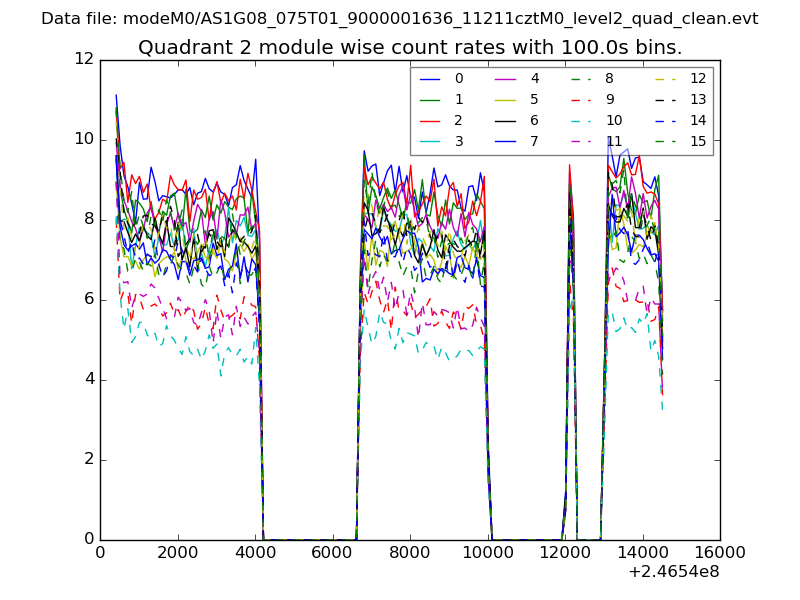
| Module-wise count rates for Quadrant D Data is divided into 100 sec bins |
 |
 |
| Parameter | Plot |
|---|---|
| CZT HV Monitor | 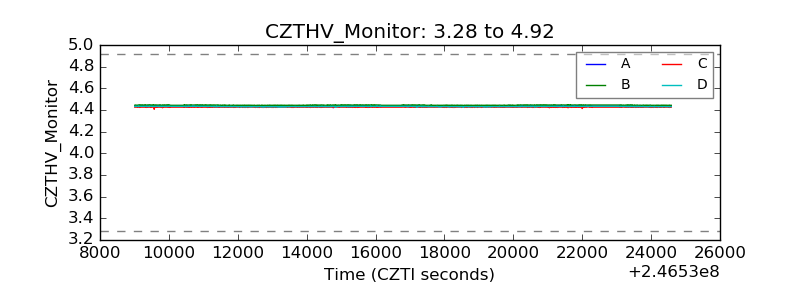 |
| D_VDD | 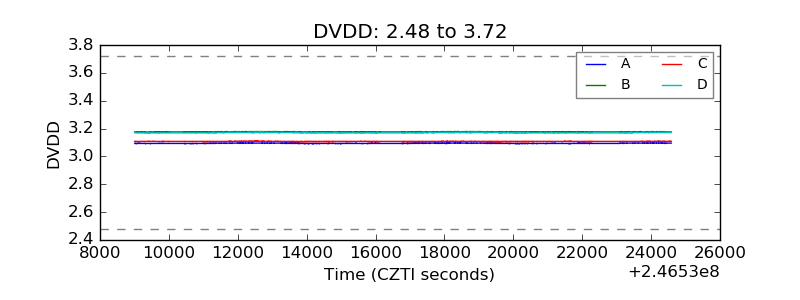 |
| Temperature 1 | 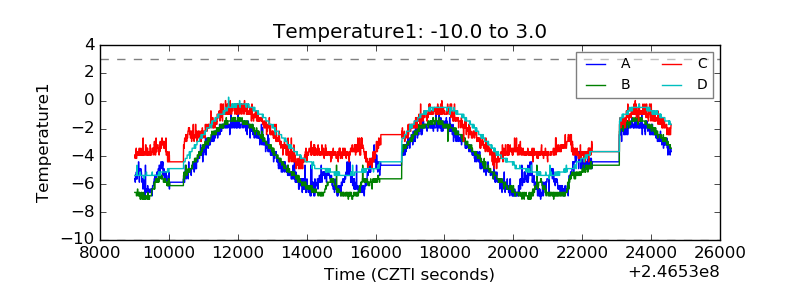 |
| Veto HV Monitor | 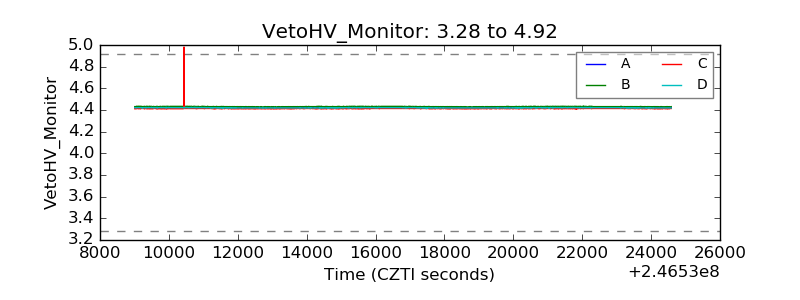 |
| Veto LLD |  |
| Alpha Counter | 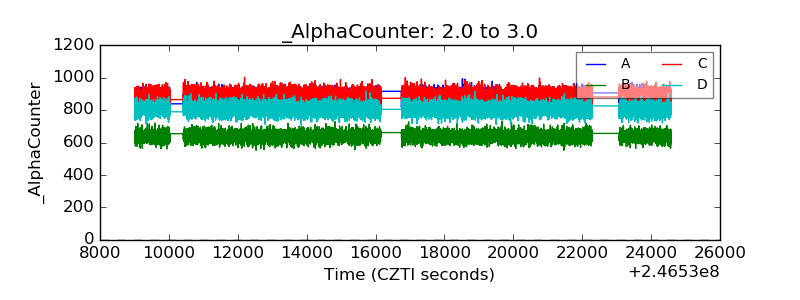 |
| _CPM_Rate | 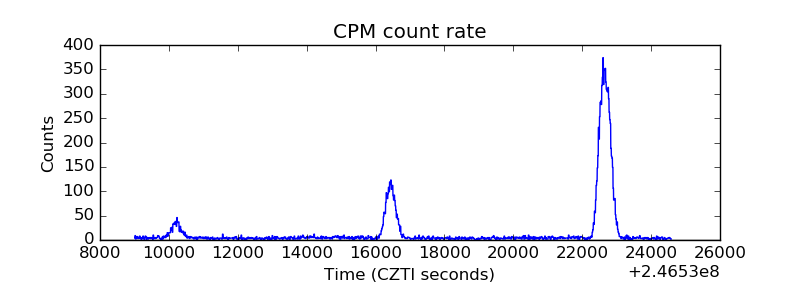 |
| CZT Counter | 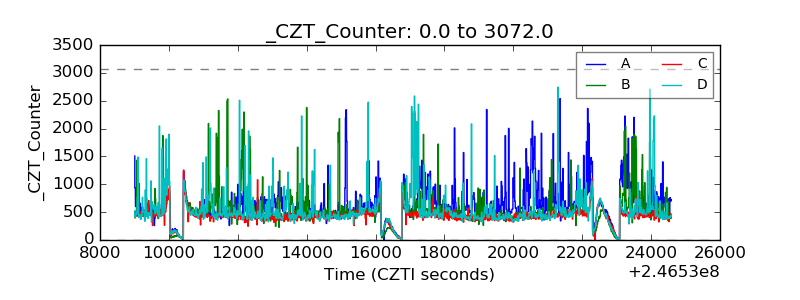 |
| +2.5 Volts monitor |  |
| +5 Volts monitor |  |
| _ROLL_ROT | 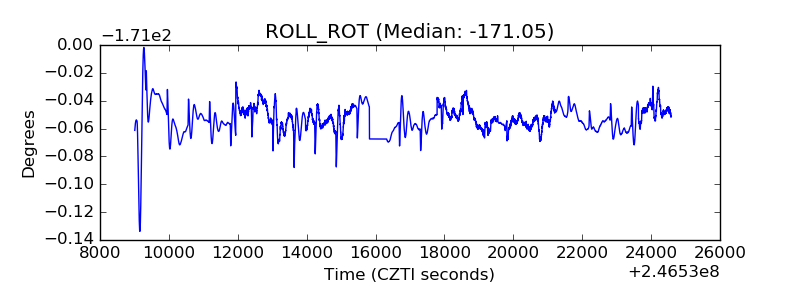 |
| _Roll_DEC | 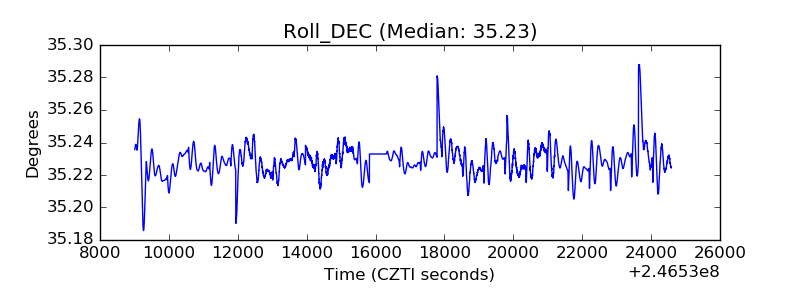 |
| _Roll_RA | 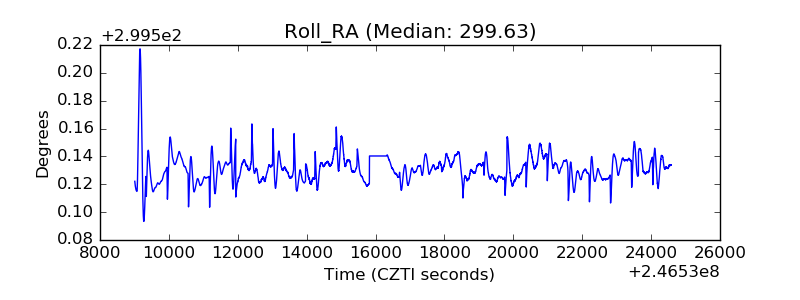 |
| Veto Counter |  |