| Param | Original file | Final file |
|---|---|---|
| Filename | modeM0/AS1G08_075T01_9000001636_11212cztM0_level2.evt | modeM0/AS1G08_075T01_9000001636_11212cztM0_level2_quad_clean.evt |
| Size (bytes) | 475,277,760 | 74,954,880 |
| Size | 453.3 MB | 71.5 MB |
| Events in quadrant A | 4,569,094 | 460,874 |
| Events in quadrant B | 3,179,188 | 471,963 |
| Events in quadrant C | 2,595,552 | 475,603 |
| Events in quadrant D | 3,648,041 | 447,379 |
| Mode M0 | |||
|---|---|---|---|
| Quadrant | BADHDUFLAG | Total packets | Discarded packets |
| A | 0 | 18091 | 368 |
| B | 0 | 13706 | 246 |
| C | 0 | 12153 | 144 |
| D | 0 | 15103 | 154 |
| Mode M9 | |||
|---|---|---|---|
| Quadrant | BADHDUFLAG | Total packets | Discarded packets |
| A | 0 | 9 | 0 |
| B | 0 | 9 | 0 |
| C | 0 | 9 | 0 |
| D | 0 | 9 | 0 |
| Mode SS | |||
|---|---|---|---|
| Quadrant | BADHDUFLAG | Total packets | Discarded packets |
| A | 0 | 124 | 2 |
| B | 0 | 124 | 4 |
| C | 0 | 124 | 4 |
| D | 0 | 124 | 2 |
| Quadrant | Total seconds | Saturated seconds | Saturation percentage |
|---|---|---|---|
| A | 5903 | 203 | 3.438929% |
| B | 5915 | 133 | 2.248521% |
| C | 5929 | 13 | 0.219261% |
| D | 5928 | 224 | 3.778677% |
Noise dominated data is calculated using 1-second bins in cleaned event files. If a bin has >2000 counts, and if more than 50% of those come from <1% of pixels, then it is considered to be noise-dominated and hence unusable.
| Quadrant | # 1 sec bins | Bins with >0 counts | Bins with >2000 counts | High rate bins dominated by noise | Noise dominated (total time) | Noise dominated (detector-on time) | Marked lightcurve |
|---|---|---|---|---|---|---|---|
| A | 6943 | 5933 | 86 | 86 | 1.24% | 1.45% | 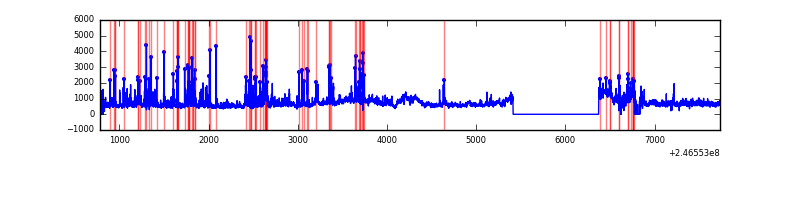 |
| B | 6944 | 5946 | 73 | 73 | 1.05% | 1.23% | 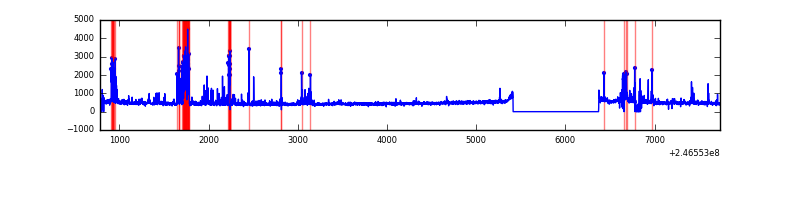 |
| C | 6942 | 5954 | 0 | 0 | 0.00% | 0.00% | 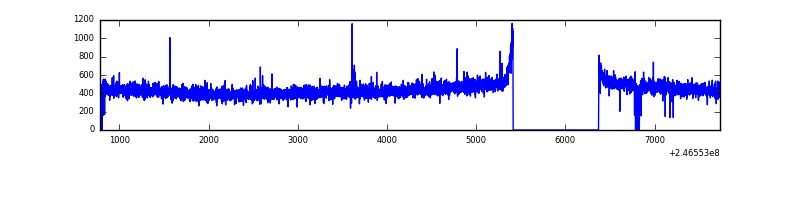 |
| D | 6950 | 5957 | 158 | 158 | 2.27% | 2.65% | 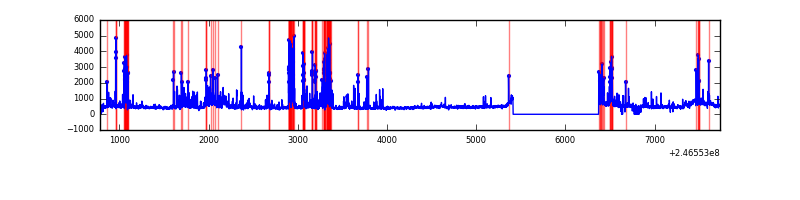 |
Top three noisy pixels from each quadrant. If the there are fewer than three noisy pixels in the level2.evt file, extra rows are filled as -1
| Pixel properties | Quadrant properties | ||||||
|---|---|---|---|---|---|---|---|
| Quadrant | DetID | PixID | Counts | Sigma | Mean | Median | Sigma |
| A | 8 | 5 | 696533 | 5090.84 | 665 | 649 | 136.7 |
| A | 15 | 174 | 526731 | 3848.63 | 665 | 649 | 136.7 |
| A | 8 | 15 | 517115 | 3778.28 | 665 | 649 | 136.7 |
| B | 4 | 239 | 428905 | 3329.44 | 673 | 656 | 128.6 |
| B | 15 | 204 | 99972 | 772.14 | 673 | 656 | 128.6 |
| B | 12 | 111 | 14033 | 104.0 | 673 | 656 | 128.6 |
| C | 13 | 61 | 5098 | 28.62 | 664 | 667 | 154.8 |
| C | 14 | 234 | 3584 | 18.84 | 664 | 667 | 154.8 |
| C | 12 | 4 | 3336 | 17.24 | 664 | 667 | 154.8 |
| D | 14 | 34 | 356368 | 2279.36 | 648 | 629 | 156.1 |
| D | 13 | 152 | 156384 | 997.98 | 648 | 629 | 156.1 |
| D | 2 | 14 | 149757 | 955.52 | 648 | 629 | 156.1 |
Histogram calculated using DETX and DETY for each event in the final _common_clean file
| Quadrant A |  |
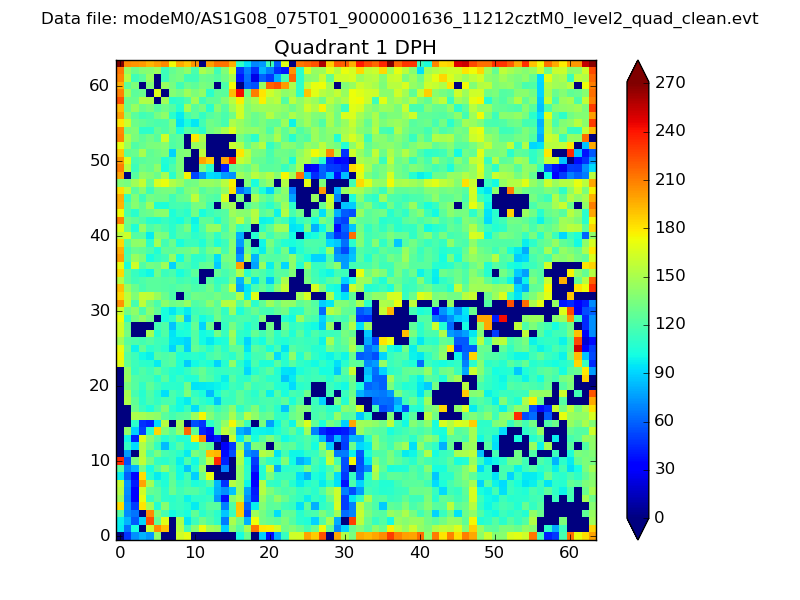 |
Quadrant B |
|---|---|---|---|
| Quadrant D |  |
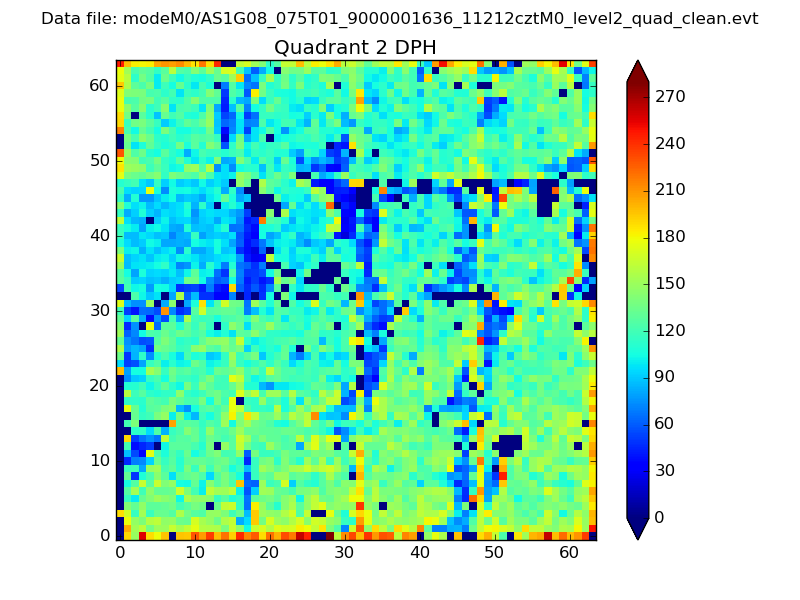 |
Quadrant C |
| Plot type | Count rate plots | Images |
|---|---|---|
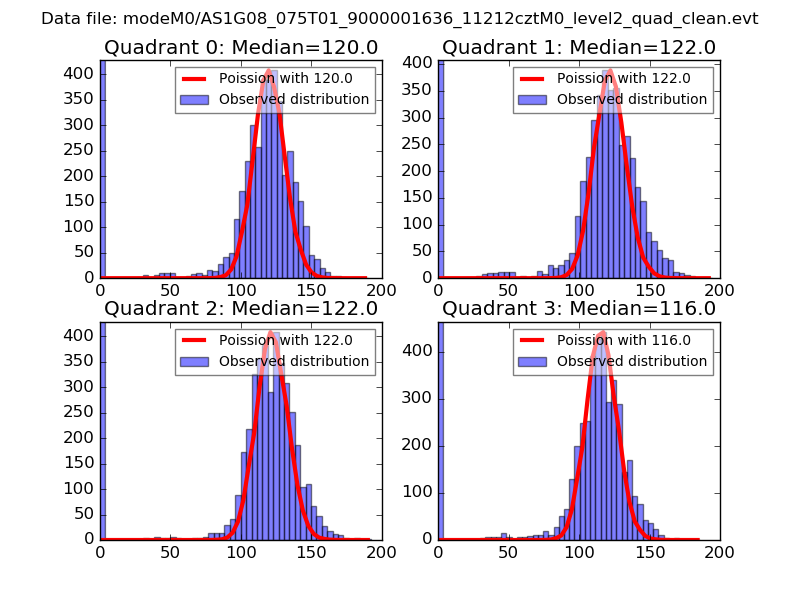
| Comparison with Poisson distribution Blue bars denote a histogram of data divided into 1 sec bins. Red curve is a Poisson curve with rate = median count rate of data. |
 |
 |
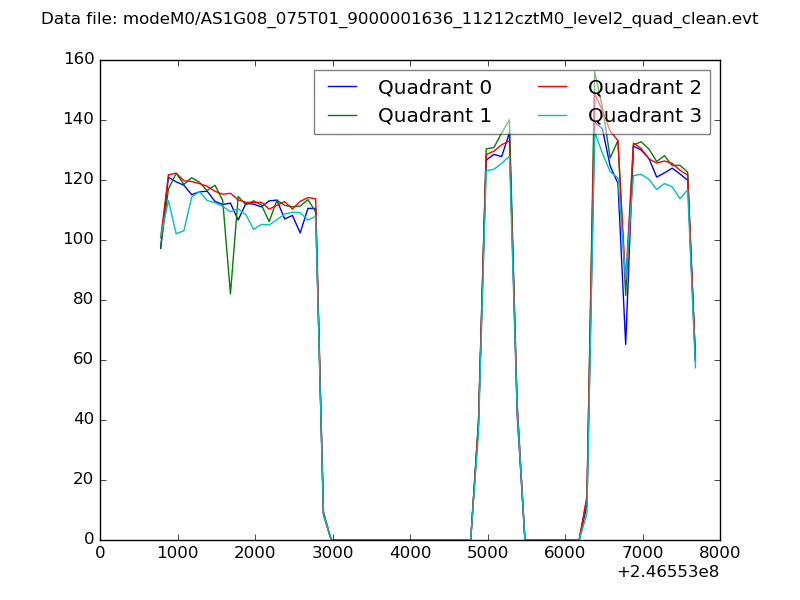
| Quadrant-wise count rates Data is divided into 100 sec bins |
 |
|
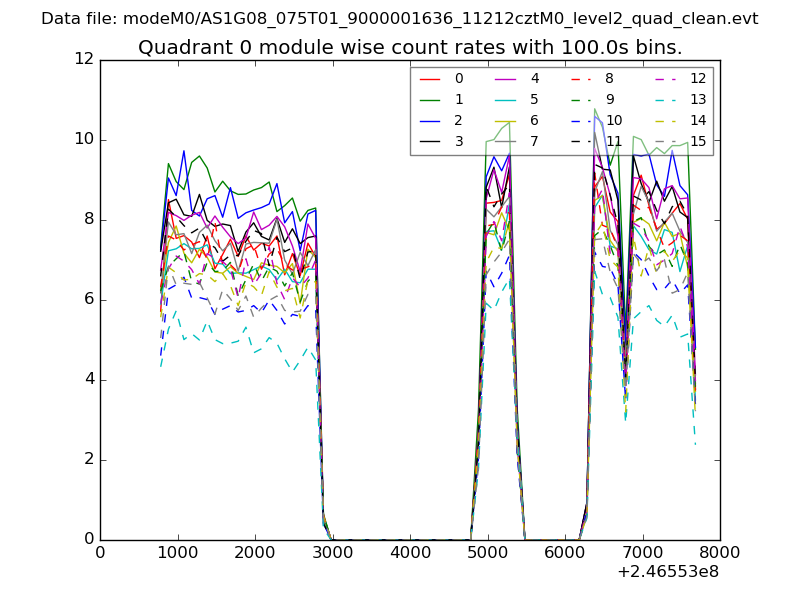
| Module-wise count rates for Quadrant A Data is divided into 100 sec bins |
 |
 |
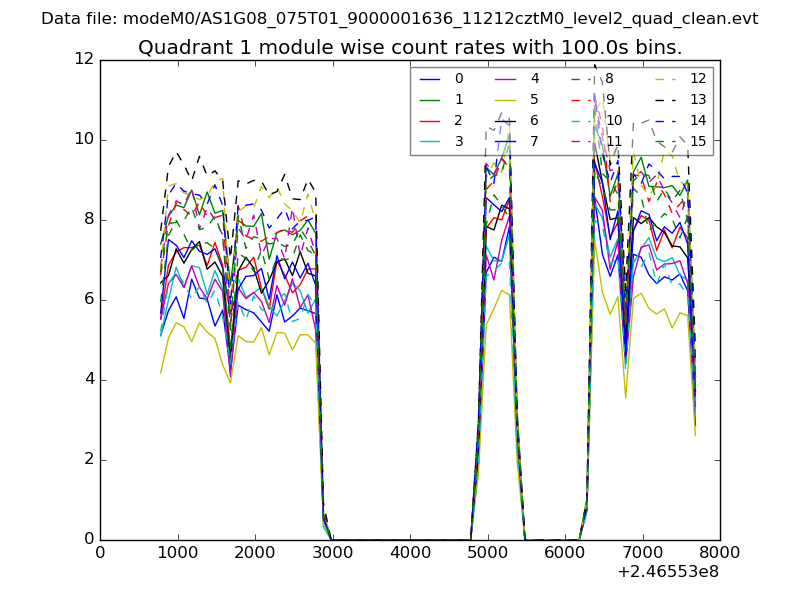
| Module-wise count rates for Quadrant B Data is divided into 100 sec bins |
 |
 |
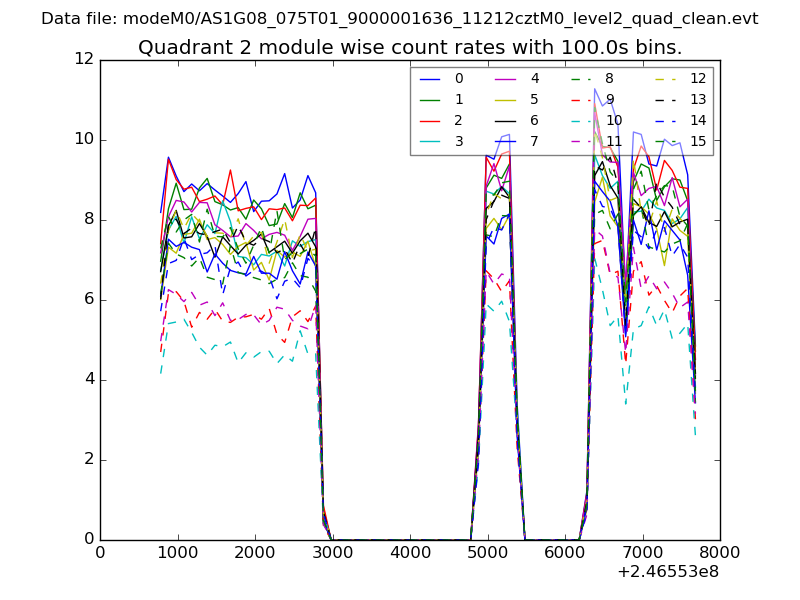
| Module-wise count rates for Quadrant C Data is divided into 100 sec bins |
 |
 |
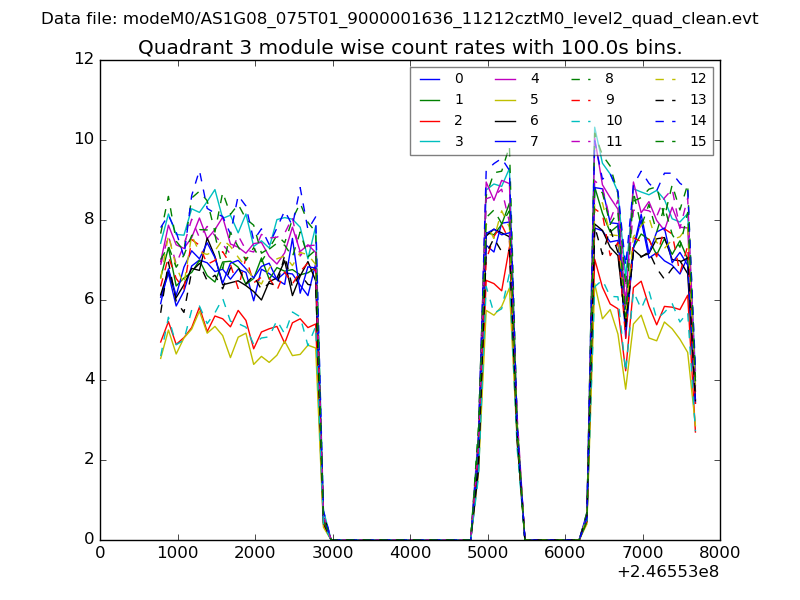
| Module-wise count rates for Quadrant D Data is divided into 100 sec bins |
 |
 |
| Parameter | Plot |
|---|---|
| CZT HV Monitor | 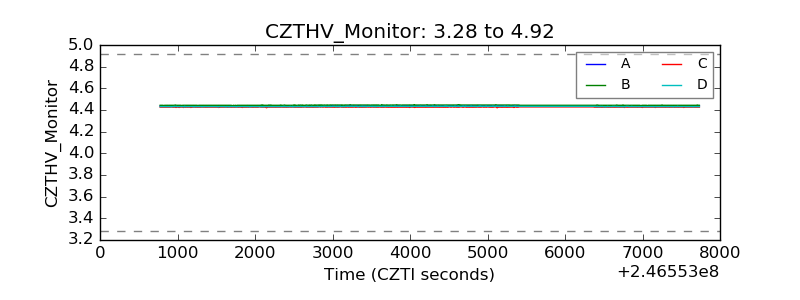 |
| D_VDD | 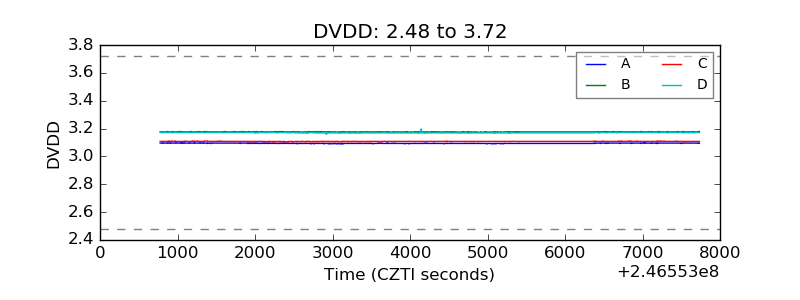 |
| Temperature 1 | 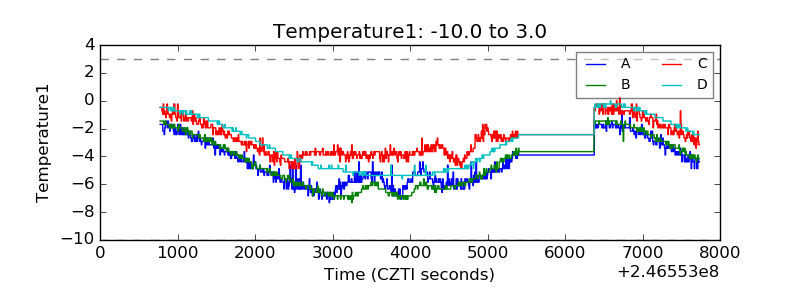 |
| Veto HV Monitor | 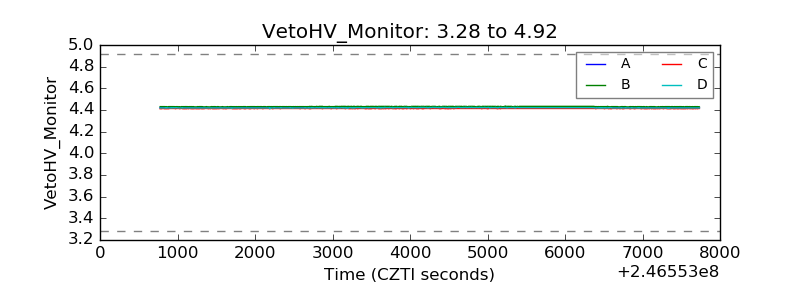 |
| Veto LLD | 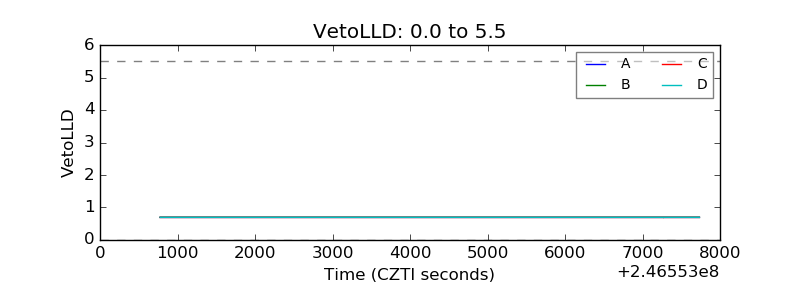 |
| Alpha Counter | 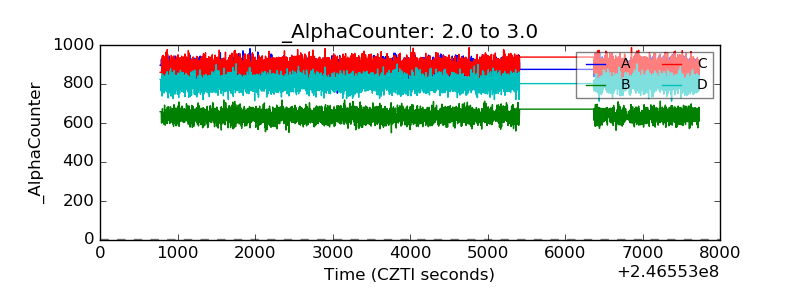 |
| _CPM_Rate | 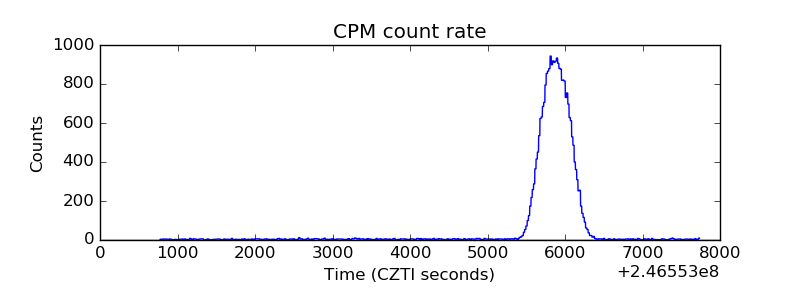 |
| CZT Counter |  |
| +2.5 Volts monitor |  |
| +5 Volts monitor | 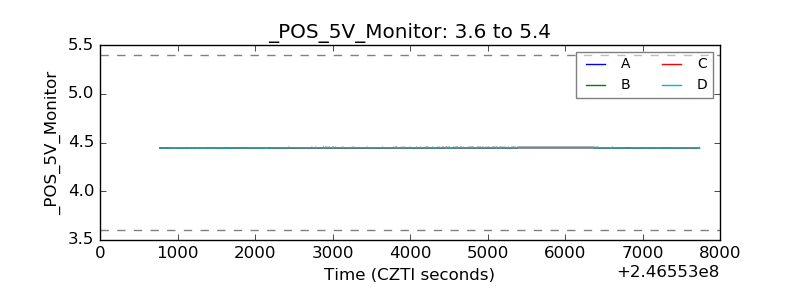 |
| _ROLL_ROT | 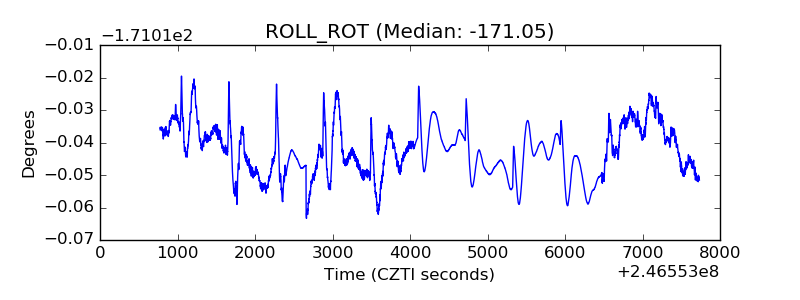 |
| _Roll_DEC | 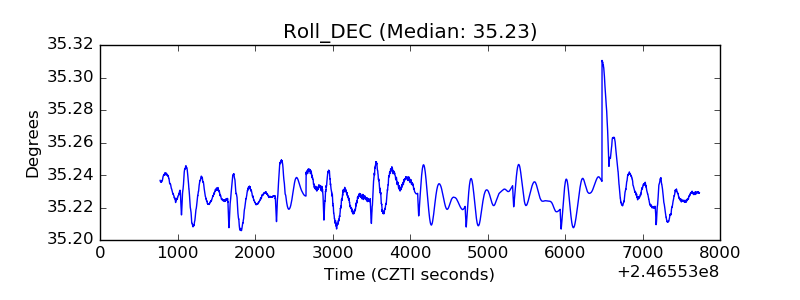 |
| _Roll_RA |  |
| Veto Counter | 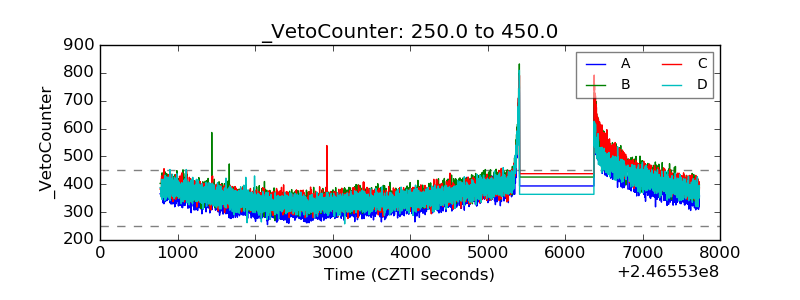 |