| Param | Original file | Final file |
|---|---|---|
| Filename | modeM0/AS1G08_075T01_9000001636_11215cztM0_level2.evt | modeM0/AS1G08_075T01_9000001636_11215cztM0_level2_quad_clean.evt |
| Size (bytes) | 377,328,960 | 81,751,680 |
| Size | 359.8 MB | 78.0 MB |
| Events in quadrant A | 3,541,007 | 533,616 |
| Events in quadrant B | 2,392,033 | 562,880 |
| Events in quadrant C | 2,073,571 | 558,953 |
| Events in quadrant D | 3,126,308 | 515,543 |
| Mode M0 | |||
|---|---|---|---|
| Quadrant | BADHDUFLAG | Total packets | Discarded packets |
| A | 0 | 15015 | 1527 |
| B | 0 | 10907 | 1060 |
| C | 0 | 10002 | 1026 |
| D | 0 | 13672 | 1240 |
| Mode M9 | |||
|---|---|---|---|
| Quadrant | BADHDUFLAG | Total packets | Discarded packets |
| A | 0 | 13 | 0 |
| B | 0 | 14 | 1 |
| C | 0 | 14 | 1 |
| D | 0 | 14 | 1 |
| Mode SS | |||
|---|---|---|---|
| Quadrant | BADHDUFLAG | Total packets | Discarded packets |
| A | 0 | 100 | 10 |
| B | 0 | 99 | 11 |
| C | 0 | 100 | 10 |
| D | 0 | 100 | 10 |
| Quadrant | Total seconds | Saturated seconds | Saturation percentage |
|---|---|---|---|
| A | 4315 | 309 | 7.161066% |
| B | 4333 | 40 | 0.923148% |
| C | 4340 | 12 | 0.276498% |
| D | 4323 | 127 | 2.937775% |
Noise dominated data is calculated using 1-second bins in cleaned event files. If a bin has >2000 counts, and if more than 50% of those come from <1% of pixels, then it is considered to be noise-dominated and hence unusable.
| Quadrant | # 1 sec bins | Bins with >0 counts | Bins with >2000 counts | High rate bins dominated by noise | Noise dominated (total time) | Noise dominated (detector-on time) | Marked lightcurve |
|---|---|---|---|---|---|---|---|
| A | 7485 | 4359 | 113 | 113 | 1.51% | 2.59% | 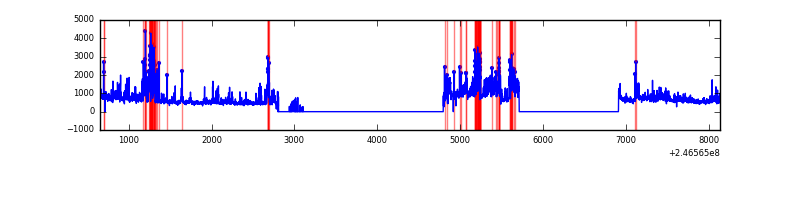 |
| B | 7485 | 4375 | 8 | 8 | 0.11% | 0.18% | 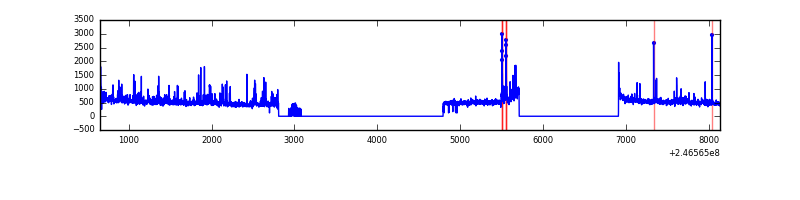 |
| C | 7485 | 4384 | 1 | 1 | 0.01% | 0.02% | 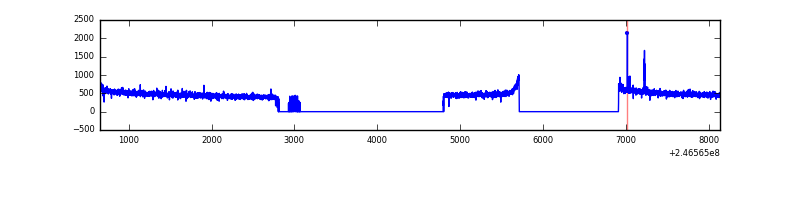 |
| D | 7485 | 4358 | 87 | 87 | 1.16% | 2.00% | 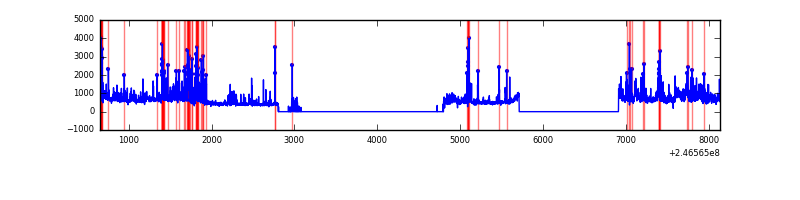 |
Top three noisy pixels from each quadrant. If the there are fewer than three noisy pixels in the level2.evt file, extra rows are filled as -1
| Pixel properties | Quadrant properties | ||||||
|---|---|---|---|---|---|---|---|
| Quadrant | DetID | PixID | Counts | Sigma | Mean | Median | Sigma |
| A | 14 | 238 | 553750 | 5305.65 | 519 | 508 | 104.3 |
| A | 8 | 5 | 434073 | 4157.94 | 519 | 508 | 104.3 |
| A | 8 | 15 | 298284 | 2855.71 | 519 | 508 | 104.3 |
| B | 4 | 239 | 136903 | 1341.56 | 536 | 524 | 101.7 |
| B | 15 | 204 | 107325 | 1050.6 | 536 | 524 | 101.7 |
| B | 10 | 244 | 16260 | 154.79 | 536 | 524 | 101.7 |
| C | 4 | 254 | 13436 | 104.4 | 527 | 531 | 123.6 |
| C | 13 | 61 | 3865 | 26.97 | 527 | 531 | 123.6 |
| C | 1 | 3 | 2886 | 19.05 | 527 | 531 | 123.6 |
| D | 1 | 52 | 461923 | 3768.8 | 514 | 500 | 122.4 |
| D | 5 | 222 | 232928 | 1898.42 | 514 | 500 | 122.4 |
| D | 13 | 104 | 152190 | 1238.97 | 514 | 500 | 122.4 |
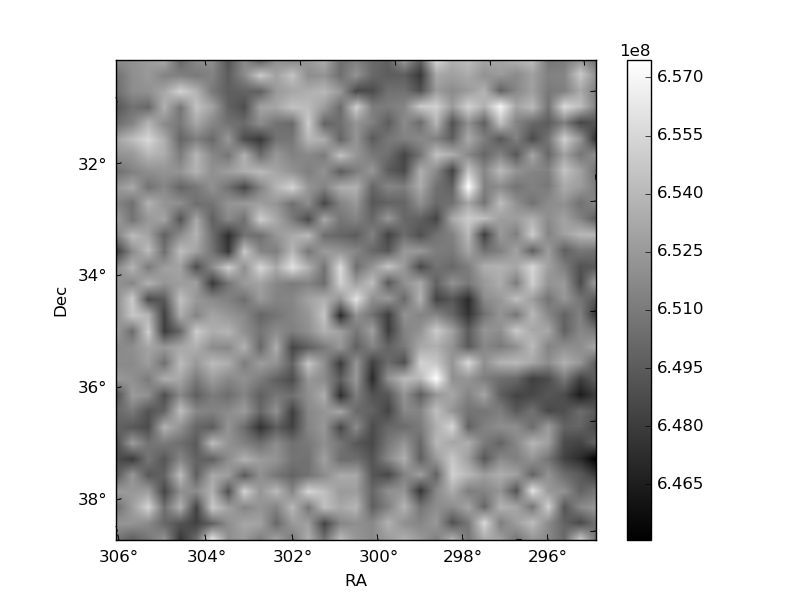
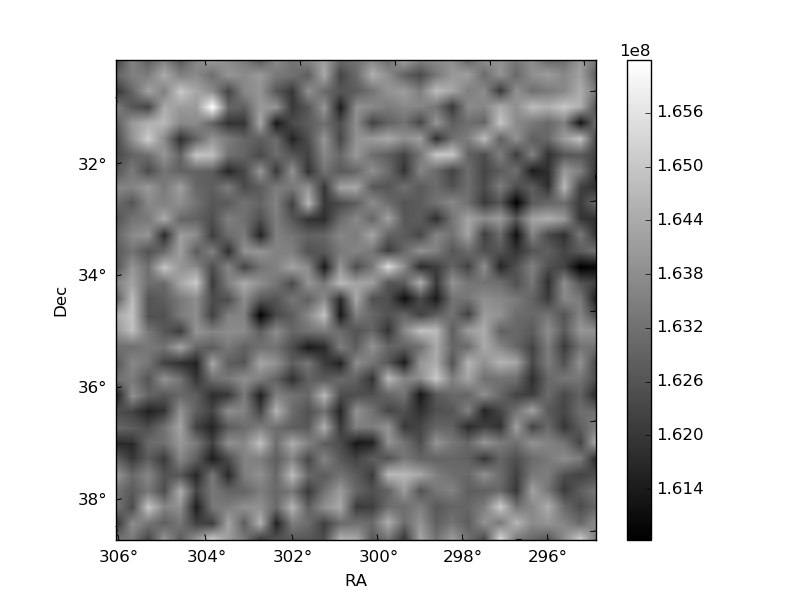
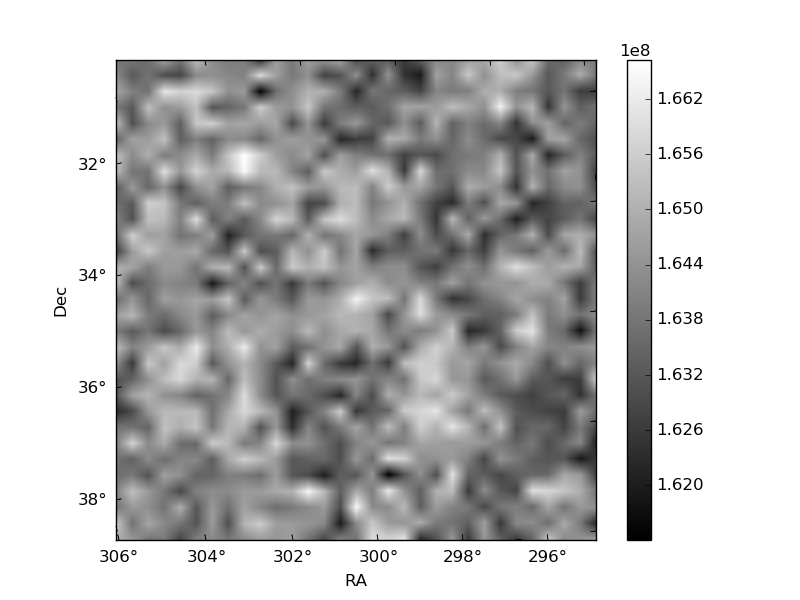
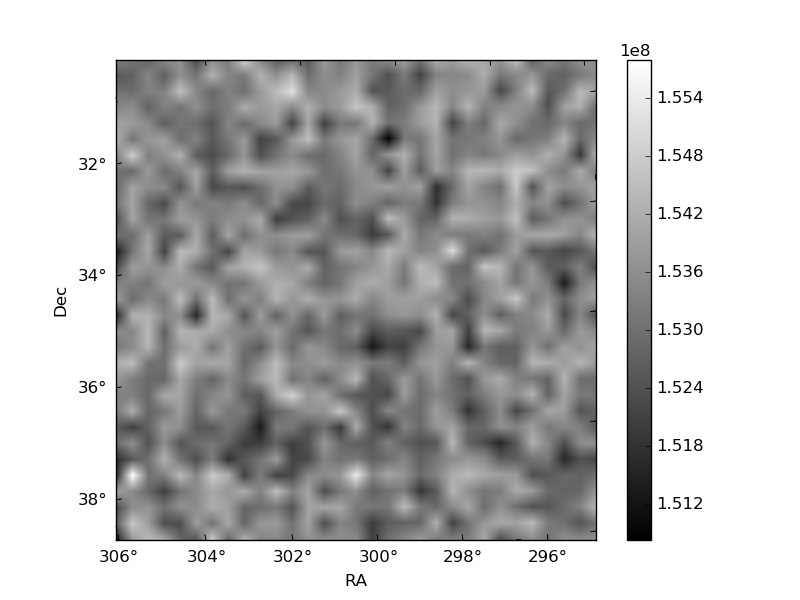
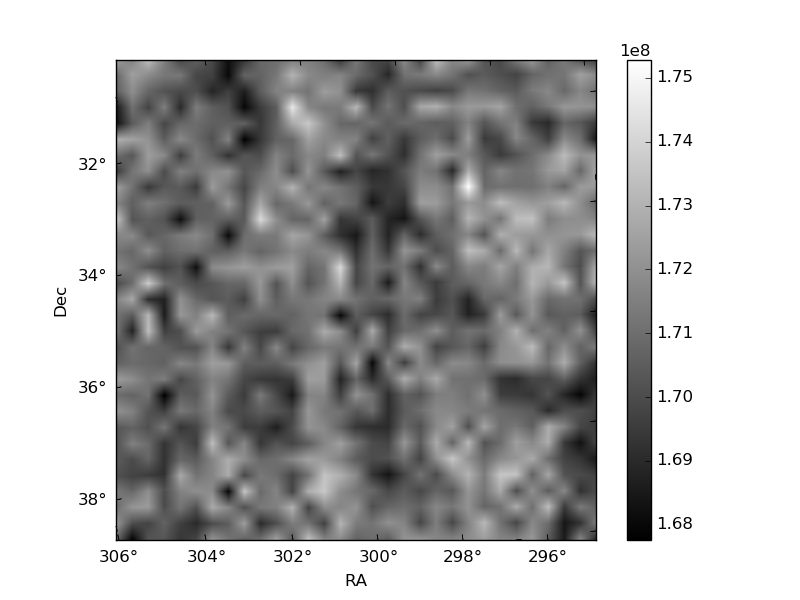
Histogram calculated using DETX and DETY for each event in the final _common_clean file
| Quadrant A | 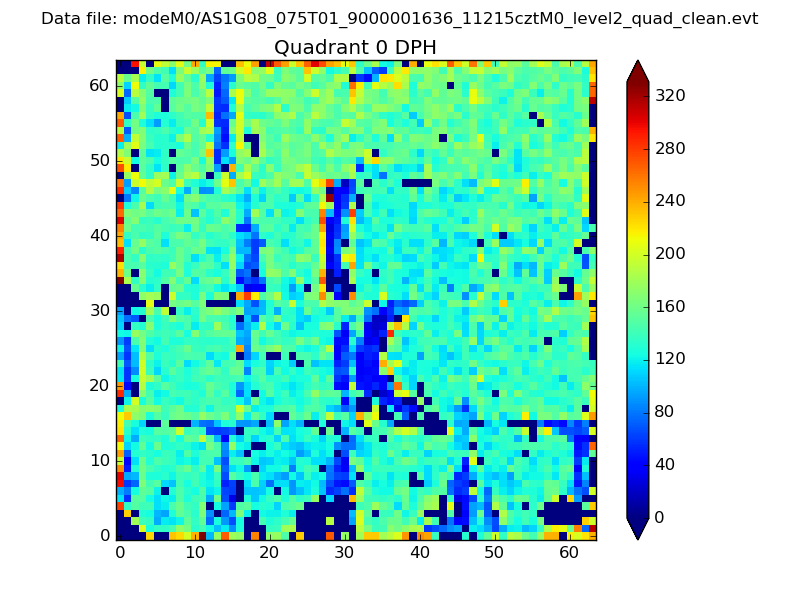 |
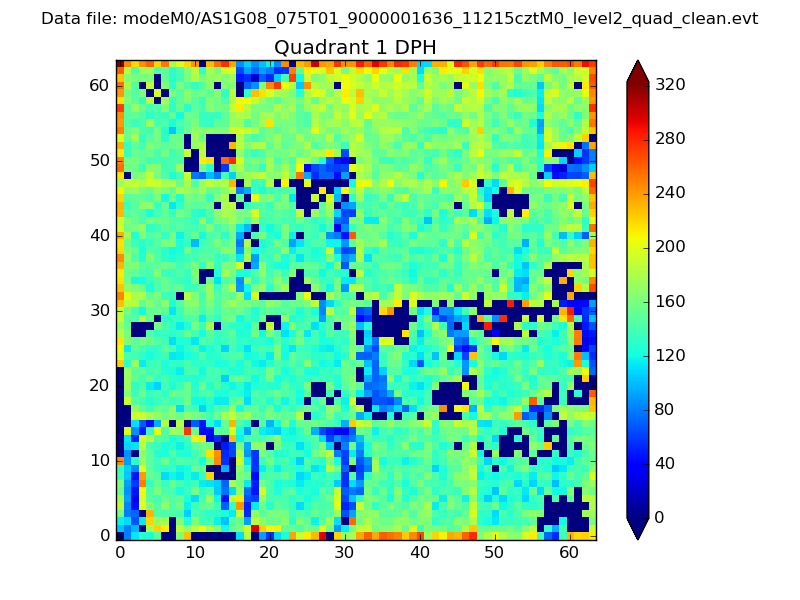 |
Quadrant B |
|---|---|---|---|
| Quadrant D | 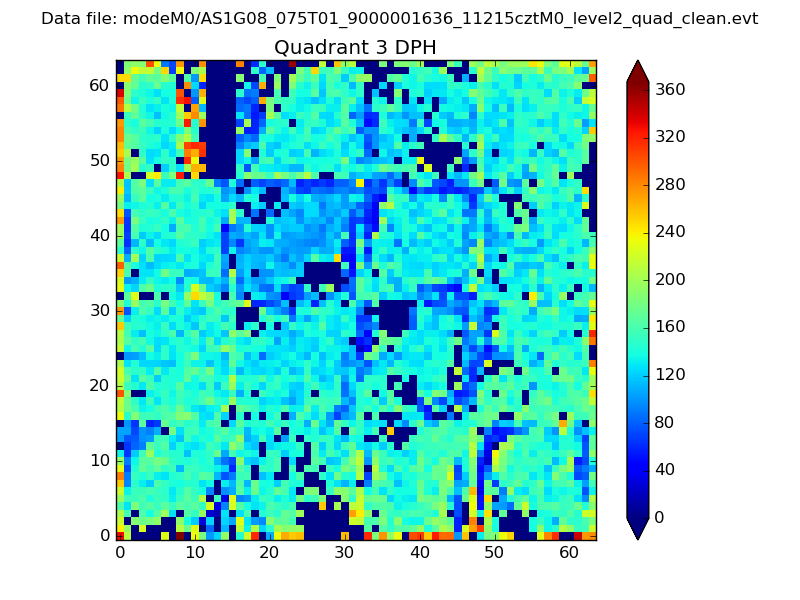 |
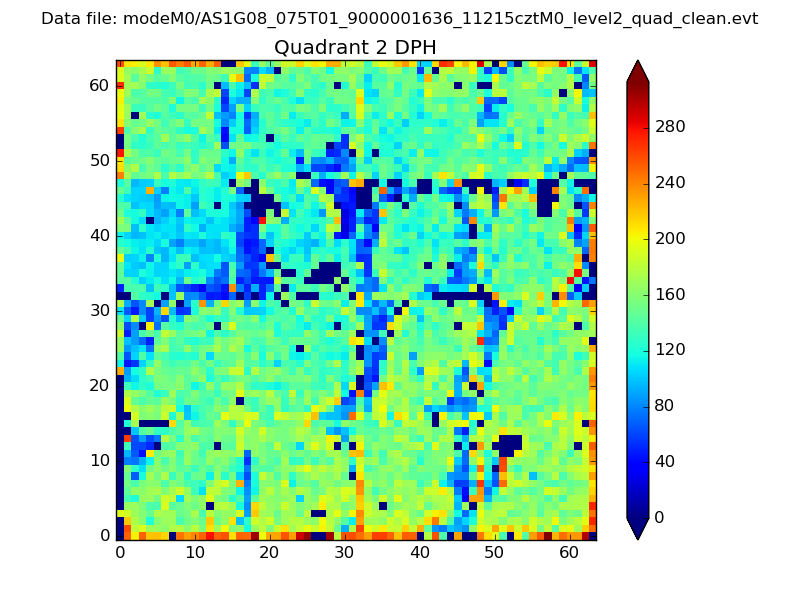 |
Quadrant C |
| Plot type | Count rate plots | Images |
|---|---|---|
| Comparison with Poisson distribution Blue bars denote a histogram of data divided into 1 sec bins. Red curve is a Poisson curve with rate = median count rate of data. |
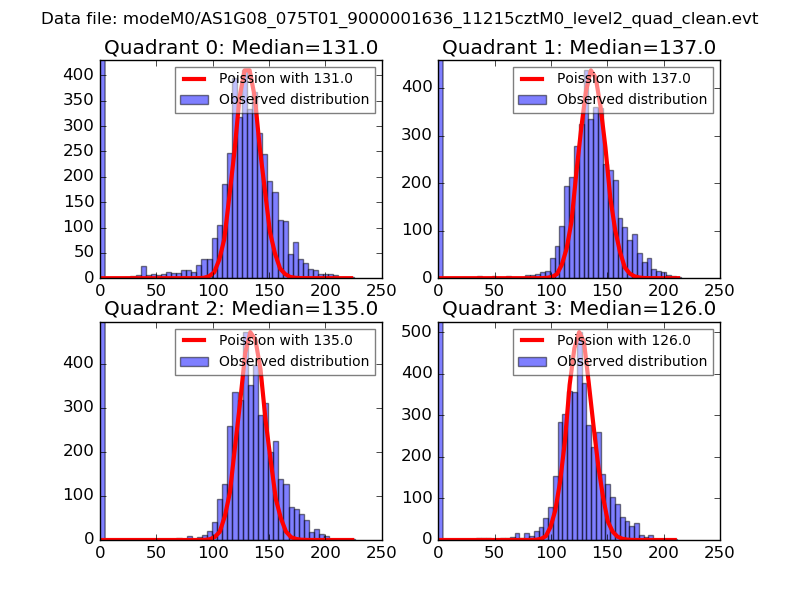 |
 |
| Quadrant-wise count rates Data is divided into 100 sec bins |
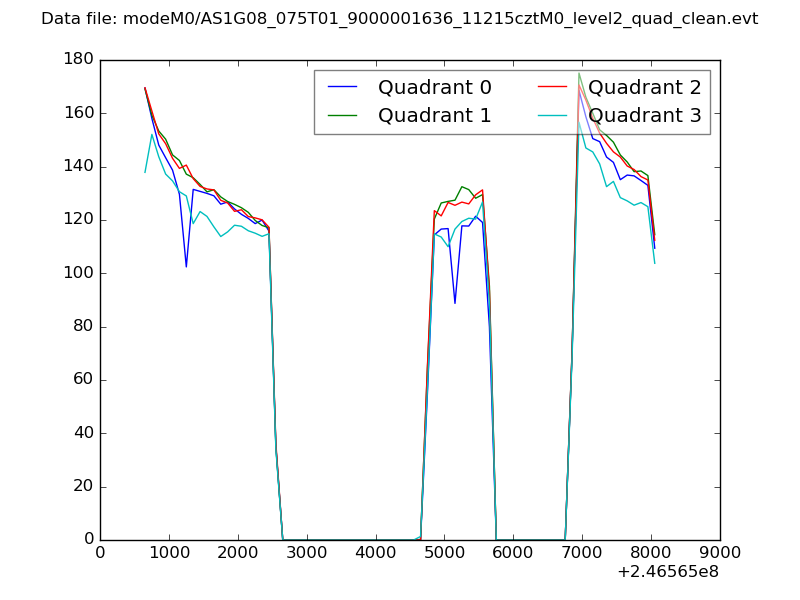 |
|
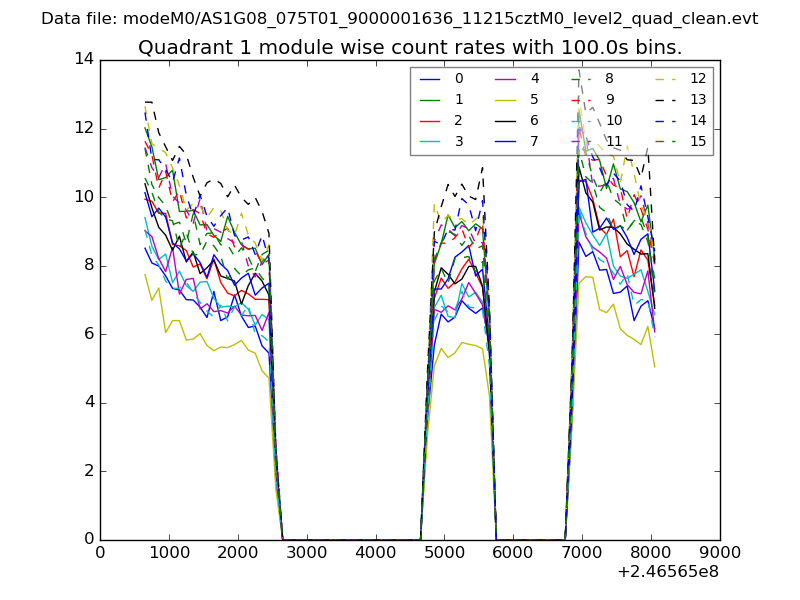
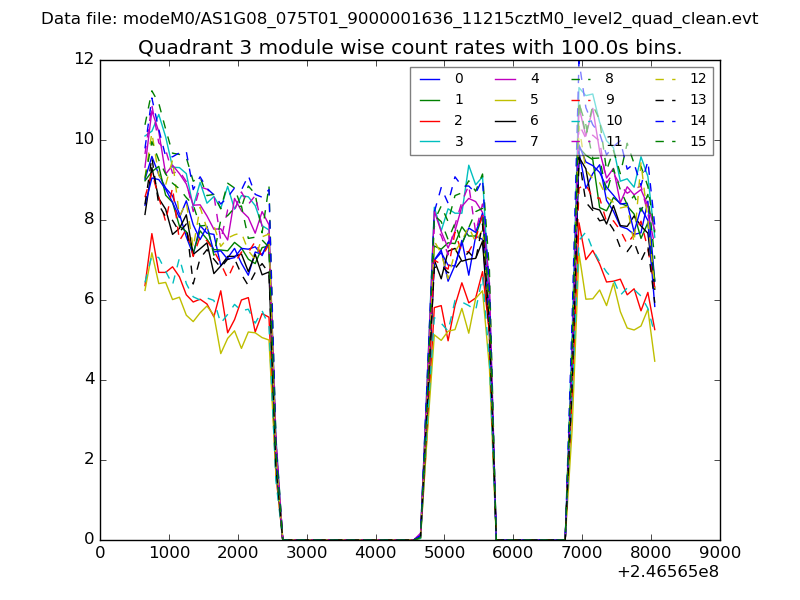
| Module-wise count rates for Quadrant A Data is divided into 100 sec bins |
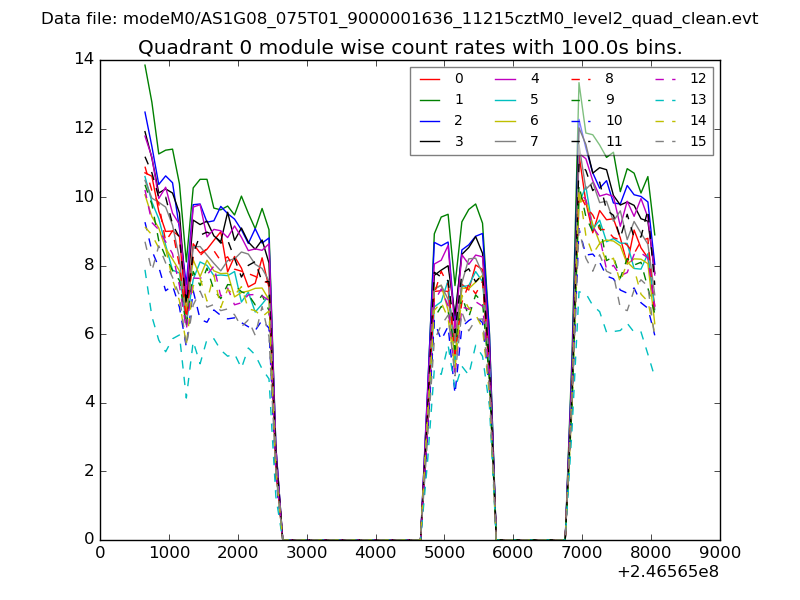 |
 |
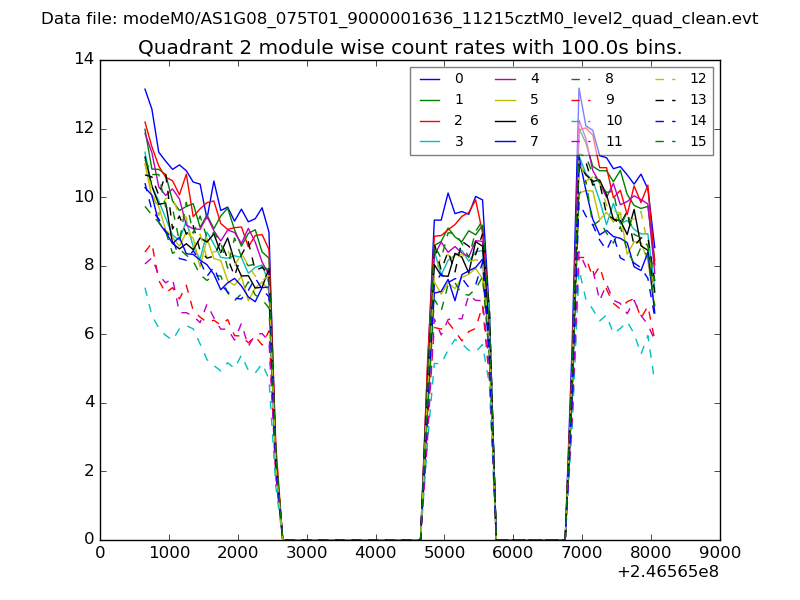
| Module-wise count rates for Quadrant B Data is divided into 100 sec bins |
 |
 |
| Module-wise count rates for Quadrant C Data is divided into 100 sec bins |
 |
 |
| Module-wise count rates for Quadrant D Data is divided into 100 sec bins |
 |
 |
| Parameter | Plot |
|---|---|
| CZT HV Monitor | 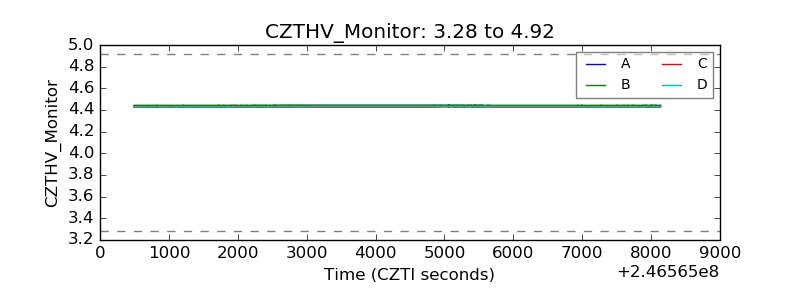 |
| D_VDD | 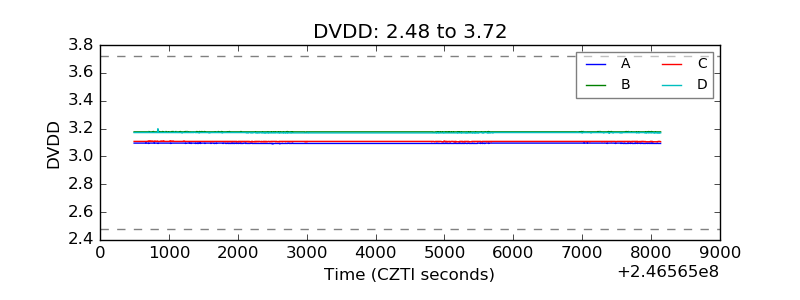 |
| Temperature 1 | 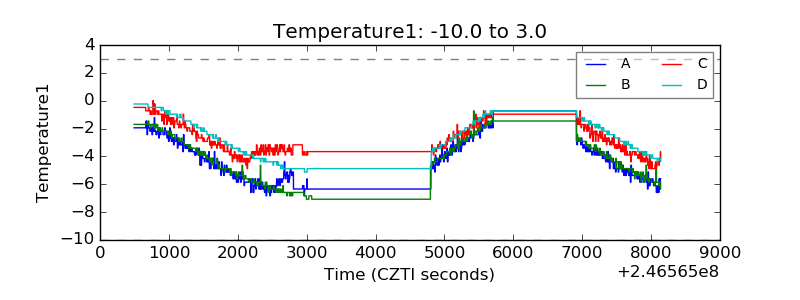 |
| Veto HV Monitor | 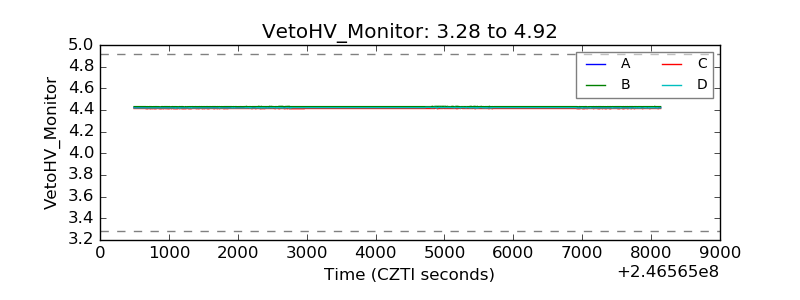 |
| Veto LLD | 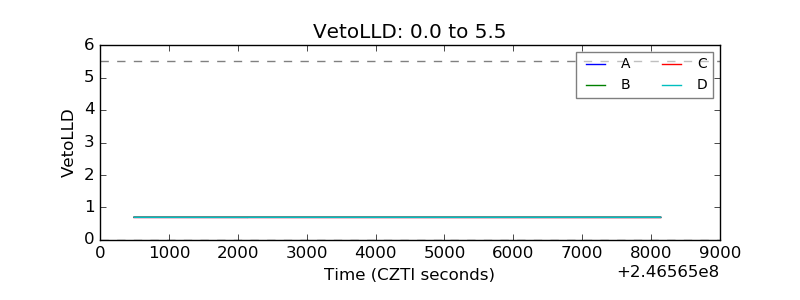 |
| Alpha Counter | 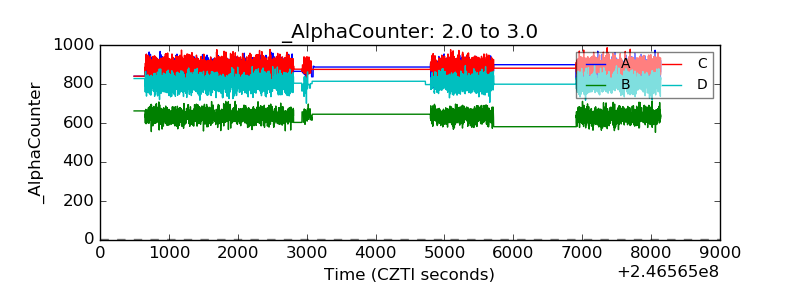 |
| _CPM_Rate | 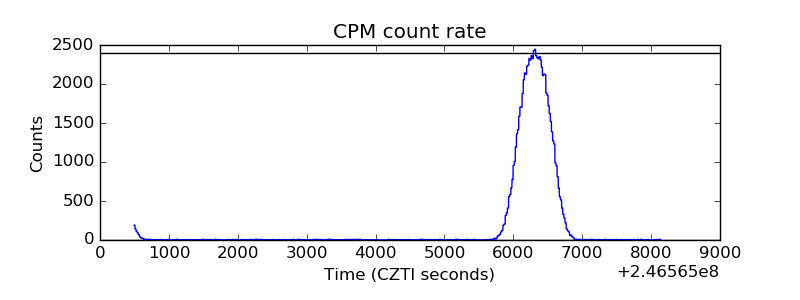 |
| CZT Counter | 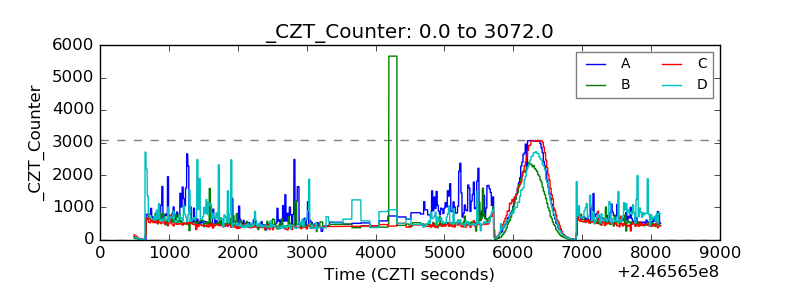 |
| +2.5 Volts monitor |  |
| +5 Volts monitor |  |
| _ROLL_ROT | 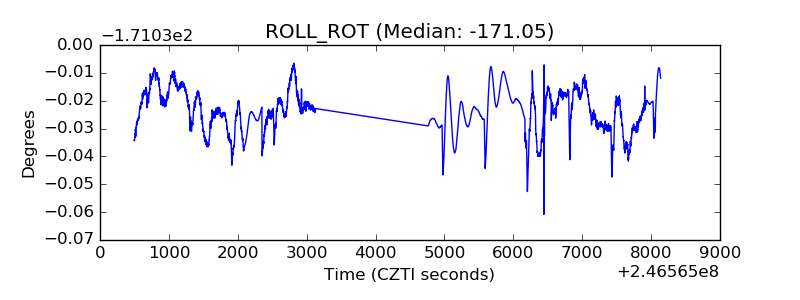 |
| _Roll_DEC | 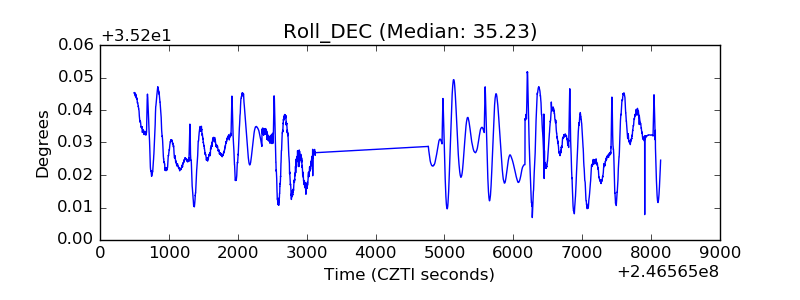 |
| _Roll_RA | 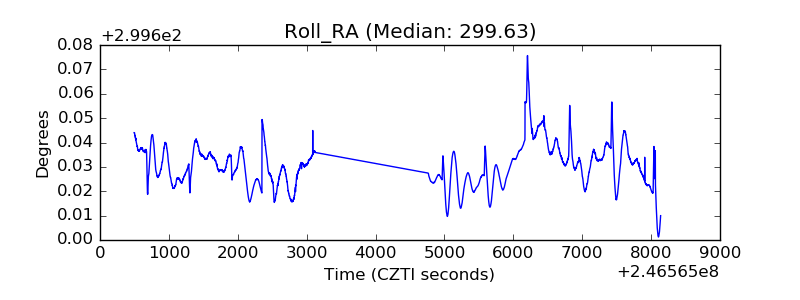 |
| Veto Counter | 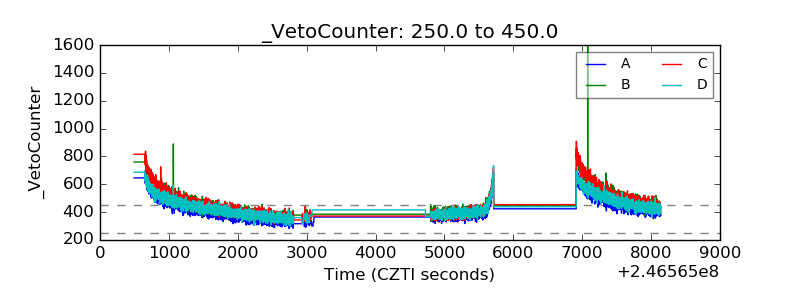 |