| Param | Original file | Final file |
|---|---|---|
| Filename | modeM0/AS1G08_075T01_9000001636_11216cztM0_level2.evt | modeM0/AS1G08_075T01_9000001636_11216cztM0_level2_quad_clean.evt |
| Size (bytes) | 450,325,440 | 76,993,920 |
| Size | 429.5 MB | 73.4 MB |
| Events in quadrant A | 4,014,554 | 494,273 |
| Events in quadrant B | 2,640,606 | 536,579 |
| Events in quadrant C | 2,413,454 | 524,415 |
| Events in quadrant D | 4,244,247 | 439,825 |
| Mode M0 | |||
|---|---|---|---|
| Quadrant | BADHDUFLAG | Total packets | Discarded packets |
| A | 0 | 18933 | 3723 |
| B | 0 | 13357 | 2489 |
| C | 0 | 12714 | 2458 |
| D | 0 | 19364 | 3435 |
| Mode M9 | |||
|---|---|---|---|
| Quadrant | BADHDUFLAG | Total packets | Discarded packets |
| A | 0 | 15 | 0 |
| B | 0 | 15 | 1 |
| C | 0 | 16 | 1 |
| D | 0 | 15 | 0 |
| Mode SS | |||
|---|---|---|---|
| Quadrant | BADHDUFLAG | Total packets | Discarded packets |
| A | 0 | 122 | 22 |
| B | 0 | 120 | 18 |
| C | 0 | 122 | 26 |
| D | 0 | 121 | 21 |
| Quadrant | Total seconds | Saturated seconds | Saturation percentage |
|---|---|---|---|
| A | 4749 | 378 | 7.959570% |
| B | 4822 | 85 | 1.762754% |
| C | 4827 | 48 | 0.994406% |
| D | 4719 | 543 | 11.506675% |
Noise dominated data is calculated using 1-second bins in cleaned event files. If a bin has >2000 counts, and if more than 50% of those come from <1% of pixels, then it is considered to be noise-dominated and hence unusable.
| Quadrant | # 1 sec bins | Bins with >0 counts | Bins with >2000 counts | High rate bins dominated by noise | Noise dominated (total time) | Noise dominated (detector-on time) | Marked lightcurve |
|---|---|---|---|---|---|---|---|
| A | 7432 | 4956 | 186 | 186 | 2.50% | 3.75% | 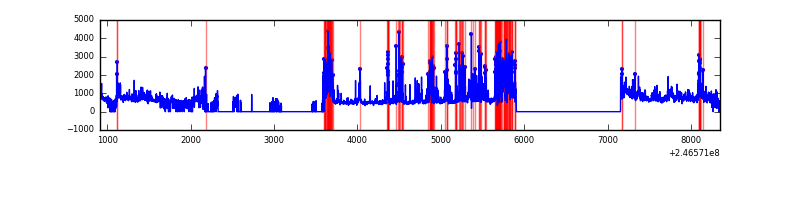 |
| B | 7431 | 5025 | 24 | 24 | 0.32% | 0.48% | 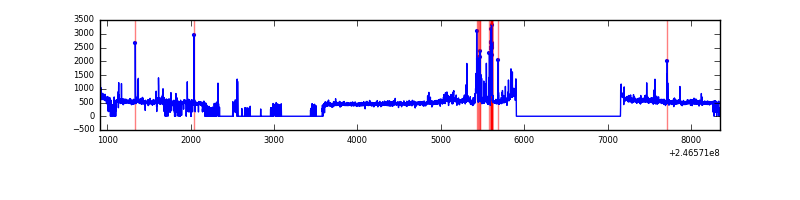 |
| C | 7432 | 5041 | 20 | 20 | 0.27% | 0.40% | 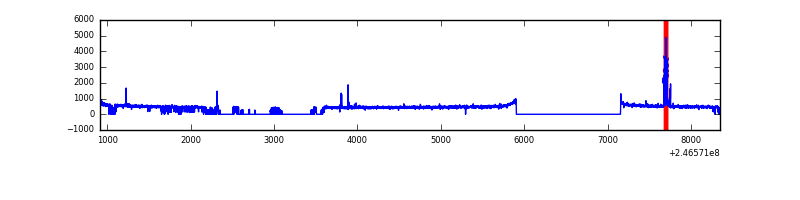 |
| D | 7430 | 4943 | 424 | 424 | 5.71% | 8.58% | 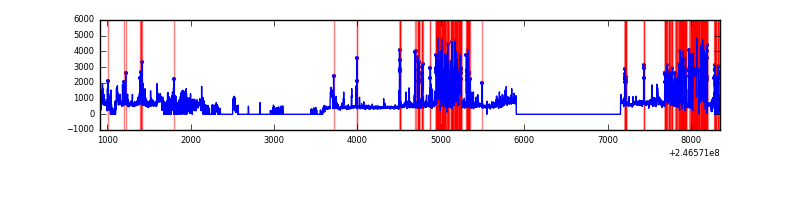 |
Top three noisy pixels from each quadrant. If the there are fewer than three noisy pixels in the level2.evt file, extra rows are filled as -1
| Pixel properties | Quadrant properties | ||||||
|---|---|---|---|---|---|---|---|
| Quadrant | DetID | PixID | Counts | Sigma | Mean | Median | Sigma |
| A | 8 | 5 | 915614 | 7787.38 | 578 | 566 | 117.5 |
| A | 14 | 238 | 440791 | 3746.47 | 578 | 566 | 117.5 |
| A | 8 | 15 | 325563 | 2765.84 | 578 | 566 | 117.5 |
| B | 4 | 239 | 145679 | 1251.43 | 608 | 594 | 115.9 |
| B | 3 | 189 | 43945 | 373.92 | 608 | 594 | 115.9 |
| B | 0 | 229 | 26807 | 226.1 | 608 | 594 | 115.9 |
| C | 1 | 3 | 78402 | 564.09 | 593 | 596 | 137.9 |
| C | 4 | 254 | 23398 | 165.31 | 593 | 596 | 137.9 |
| C | 13 | 61 | 4336 | 27.12 | 593 | 596 | 137.9 |
| D | 1 | 52 | 1750198 | 13473.32 | 541 | 527 | 129.9 |
| D | 10 | 199 | 98971 | 758.07 | 541 | 527 | 129.9 |
| D | 13 | 104 | 54227 | 413.52 | 541 | 527 | 129.9 |
Histogram calculated using DETX and DETY for each event in the final _common_clean file
| Quadrant A | 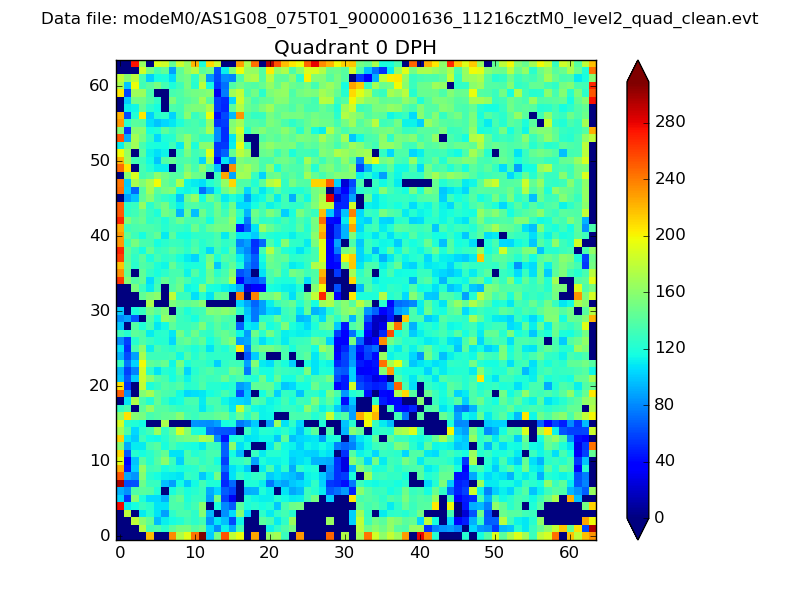 |
 |
Quadrant B |
|---|---|---|---|
| Quadrant D | 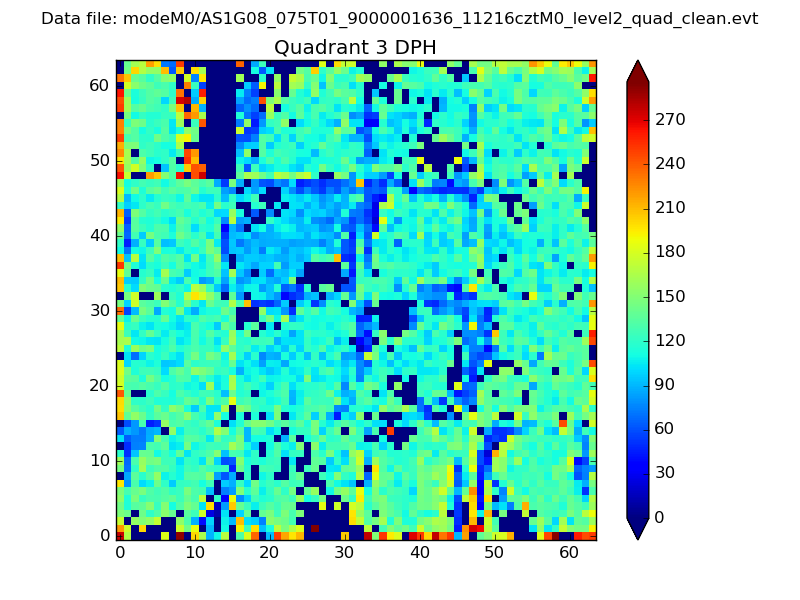 |
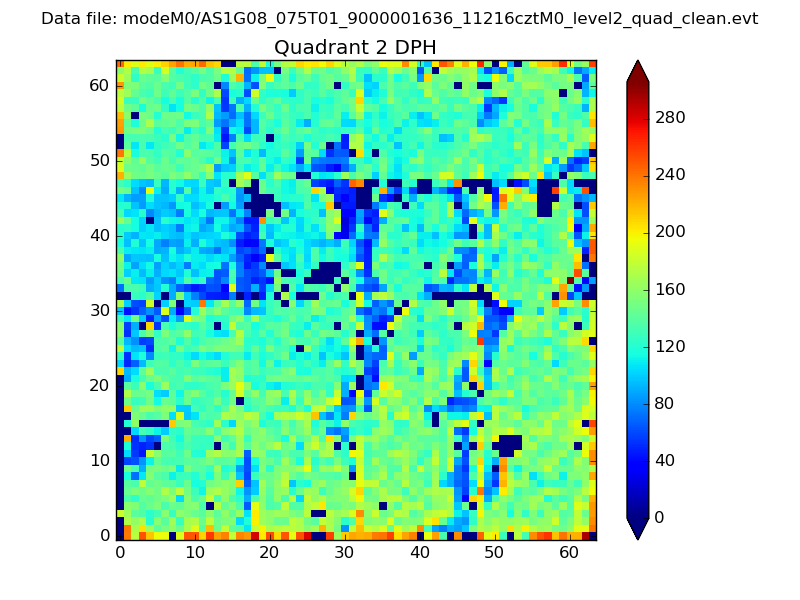 |
Quadrant C |
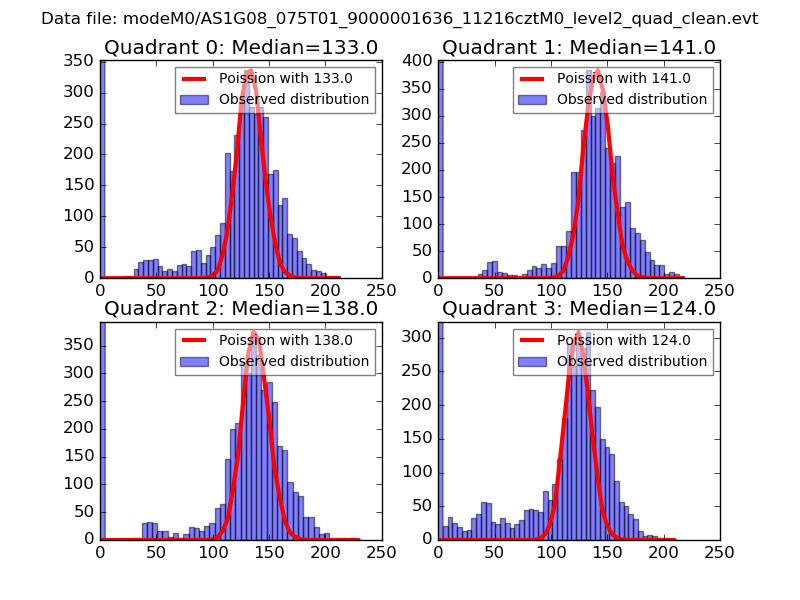
| Plot type | Count rate plots | Images |
|---|---|---|
| Comparison with Poisson distribution Blue bars denote a histogram of data divided into 1 sec bins. Red curve is a Poisson curve with rate = median count rate of data. |
 |
 |
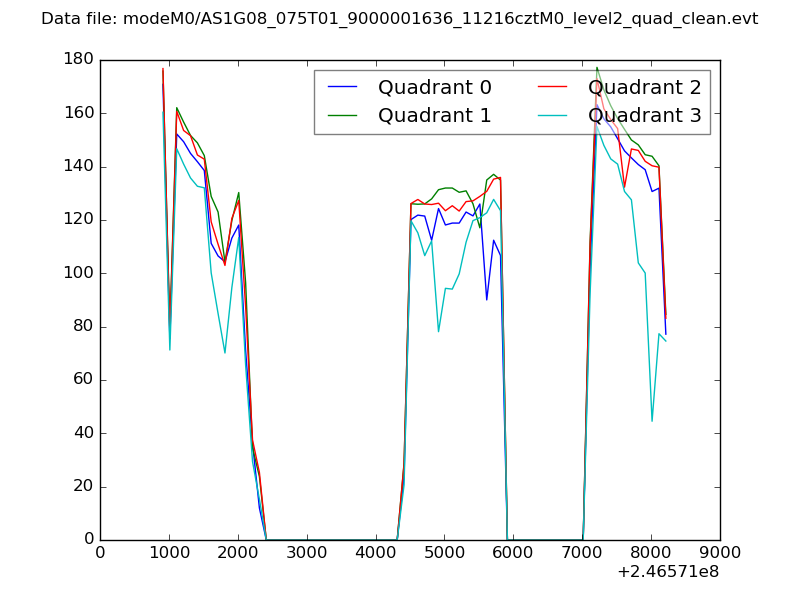
| Quadrant-wise count rates Data is divided into 100 sec bins |
 |
|
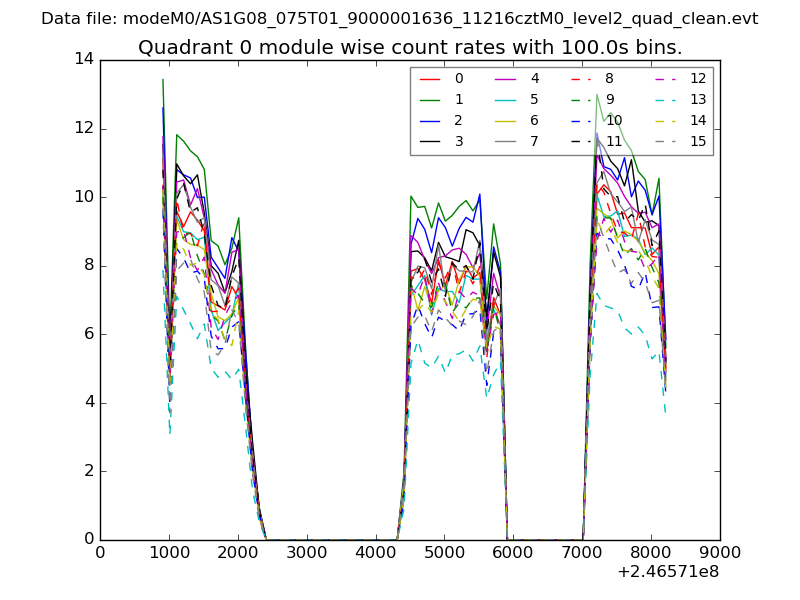
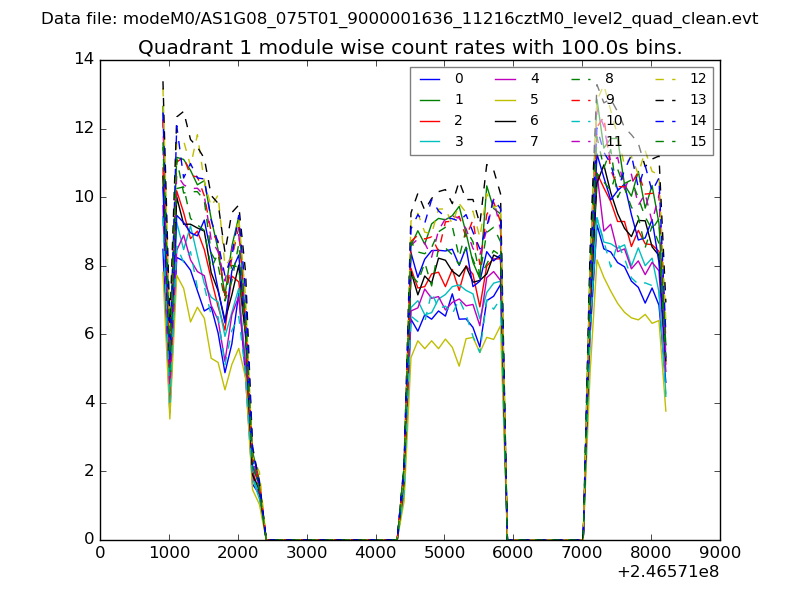
| Module-wise count rates for Quadrant A Data is divided into 100 sec bins |
 |
 |
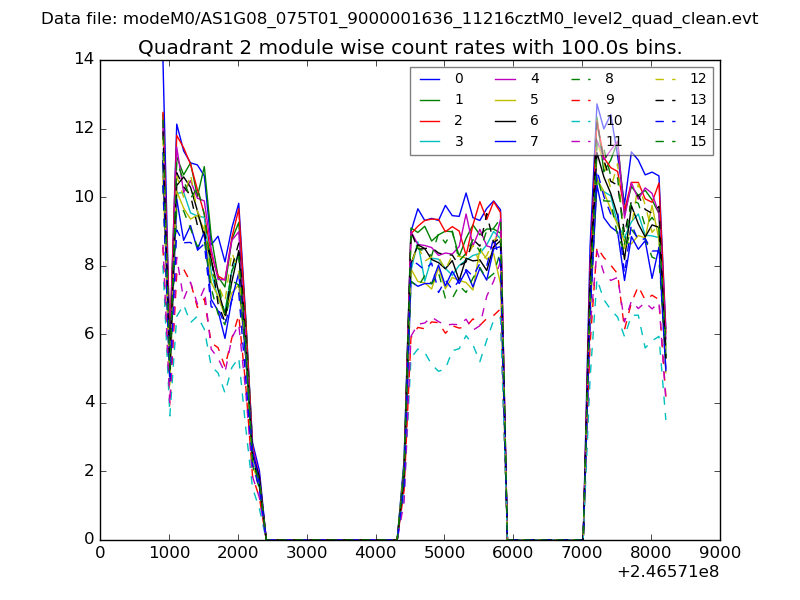
| Module-wise count rates for Quadrant B Data is divided into 100 sec bins |
 |
 |
| Module-wise count rates for Quadrant C Data is divided into 100 sec bins |
 |
 |
| Module-wise count rates for Quadrant D Data is divided into 100 sec bins |
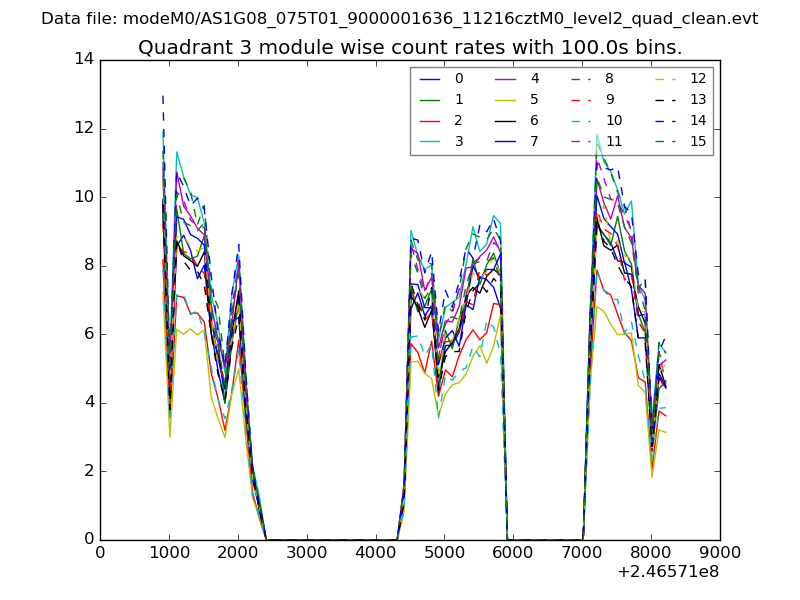 |
 |
| Parameter | Plot |
|---|---|
| CZT HV Monitor | 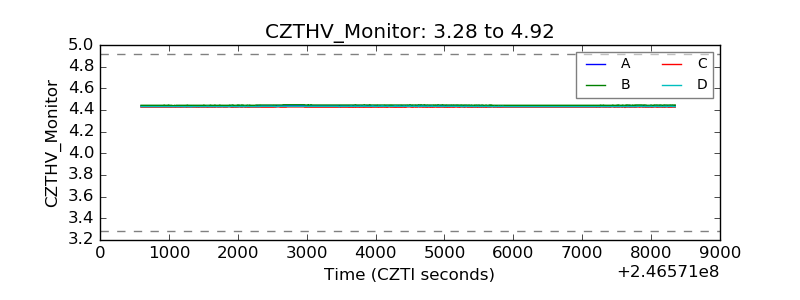 |
| D_VDD | 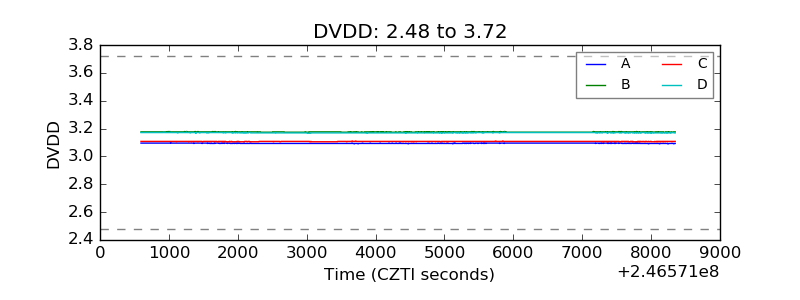 |
| Temperature 1 | 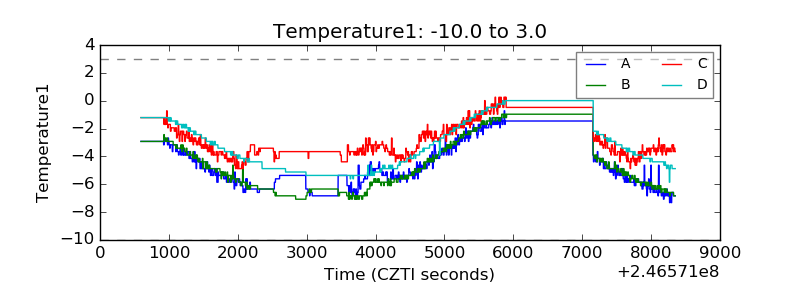 |
| Veto HV Monitor |  |
| Veto LLD |  |
| Alpha Counter | 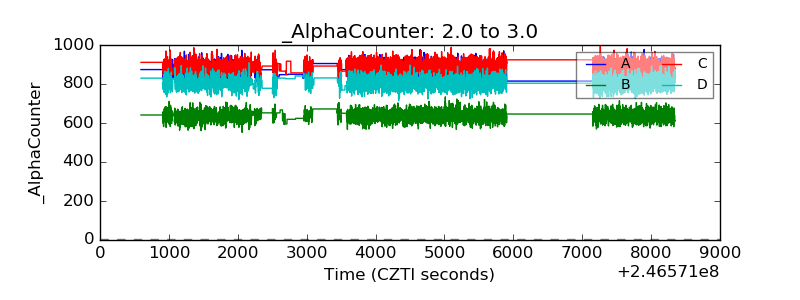 |
| _CPM_Rate | 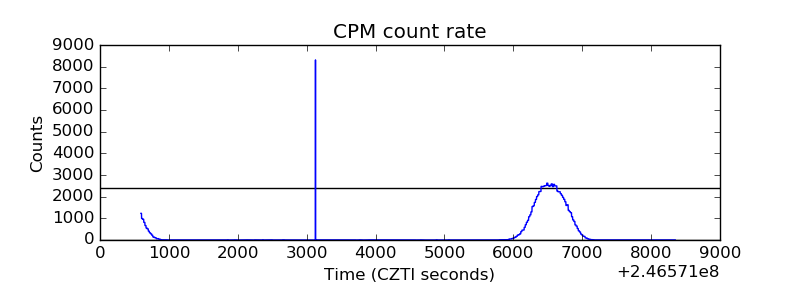 |
| CZT Counter | 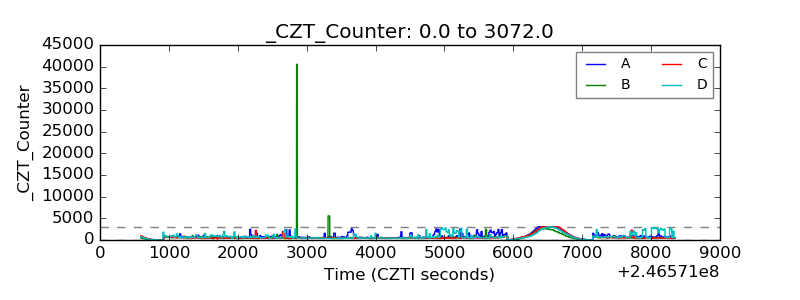 |
| +2.5 Volts monitor |  |
| +5 Volts monitor | 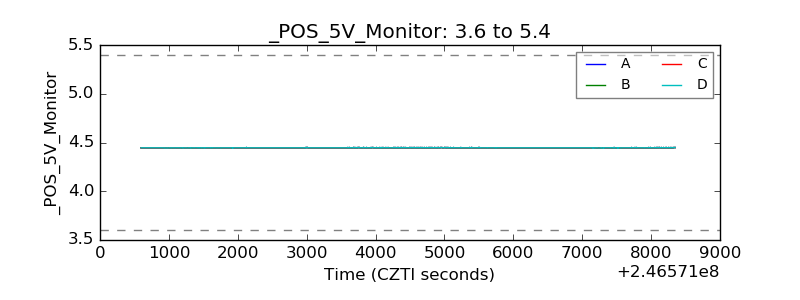 |
| _ROLL_ROT | 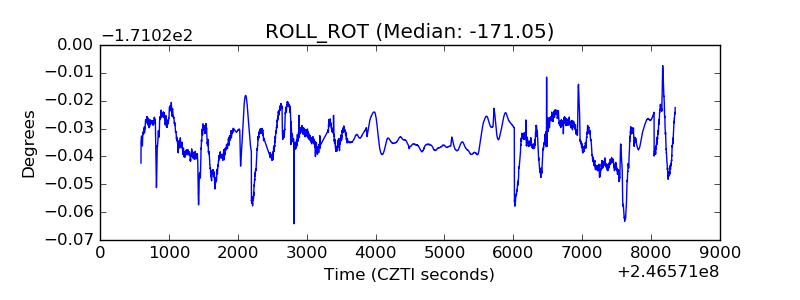 |
| _Roll_DEC | 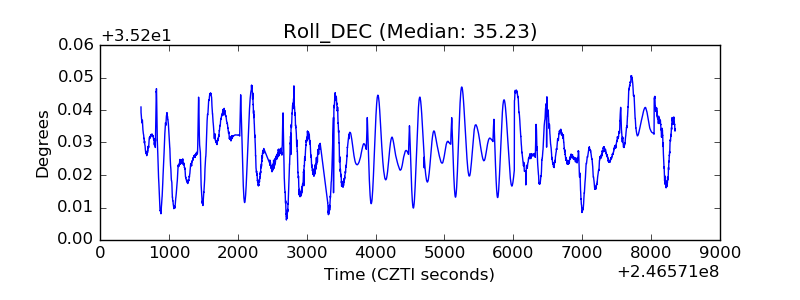 |
| _Roll_RA |  |
| Veto Counter | 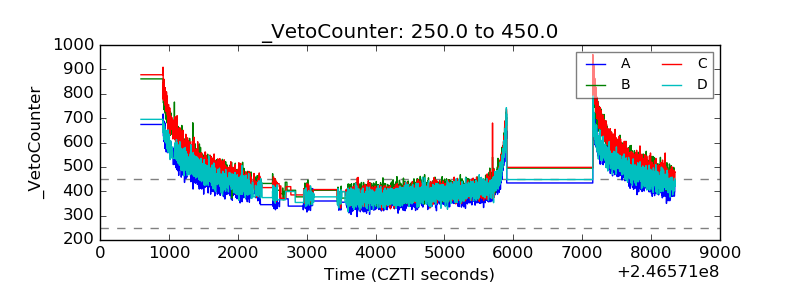 |