| Param | Original file | Final file |
|---|---|---|
| Filename | modeM0/AS1G08_075T01_9000001636_11217cztM0_level2.evt | modeM0/AS1G08_075T01_9000001636_11217cztM0_level2_quad_clean.evt |
| Size (bytes) | 1,518,857,280 | 225,230,400 |
| Size | 1.4 GB | 214.8 MB |
| Events in quadrant A | 13,871,530 | 1,378,640 |
| Events in quadrant B | 9,557,014 | 1,455,734 |
| Events in quadrant C | 8,432,537 | 1,433,735 |
| Events in quadrant D | 12,915,751 | 1,303,894 |
| Mode M0 | |||
|---|---|---|---|
| Quadrant | BADHDUFLAG | Total packets | Discarded packets |
| A | 0 | 55935 | 2391 |
| B | 0 | 41714 | 1338 |
| C | 0 | 38898 | 1335 |
| D | 0 | 52525 | 1532 |
| Mode M9 | |||
|---|---|---|---|
| Quadrant | BADHDUFLAG | Total packets | Discarded packets |
| A | 0 | 49 | 4 |
| B | 0 | 48 | 5 |
| C | 0 | 48 | 4 |
| D | 0 | 48 | 3 |
| Mode SS | |||
|---|---|---|---|
| Quadrant | BADHDUFLAG | Total packets | Discarded packets |
| A | 0 | 381 | 9 |
| B | 0 | 380 | 10 |
| C | 0 | 381 | 11 |
| D | 0 | 382 | 8 |
| Quadrant | Total seconds | Saturated seconds | Saturation percentage |
|---|---|---|---|
| A | 18056 | 967 | 5.355560% |
| B | 18135 | 248 | 1.367521% |
| C | 18124 | 106 | 0.584860% |
| D | 18131 | 896 | 4.941812% |
Noise dominated data is calculated using 1-second bins in cleaned event files. If a bin has >2000 counts, and if more than 50% of those come from <1% of pixels, then it is considered to be noise-dominated and hence unusable.
| Quadrant | # 1 sec bins | Bins with >0 counts | Bins with >2000 counts | High rate bins dominated by noise | Noise dominated (total time) | Noise dominated (detector-on time) | Marked lightcurve |
|---|---|---|---|---|---|---|---|
| A | 25499 | 18167 | 513 | 513 | 2.01% | 2.82% | 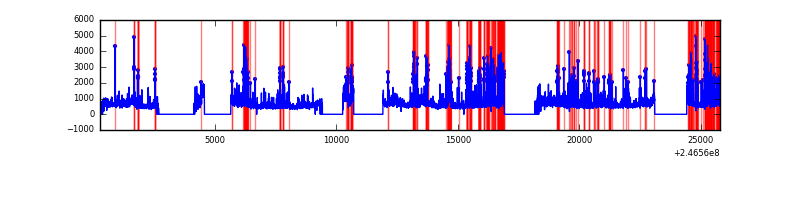 |
| B | 25493 | 18240 | 81 | 81 | 0.32% | 0.44% | 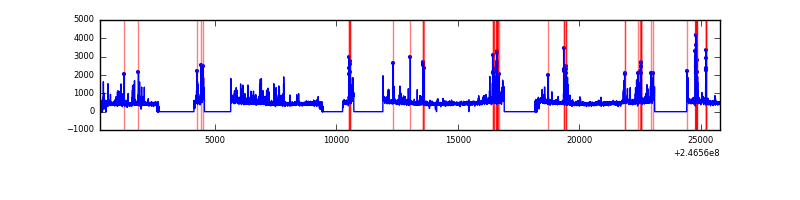 |
| C | 25506 | 18229 | 33 | 33 | 0.13% | 0.18% | 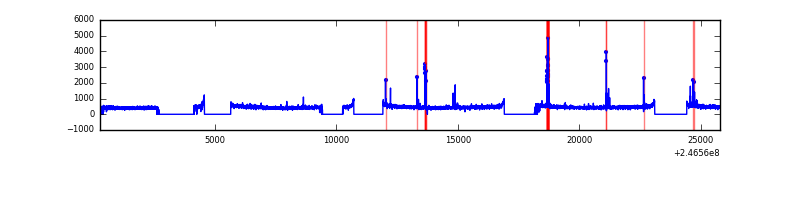 |
| D | 25502 | 18238 | 709 | 709 | 2.78% | 3.89% | 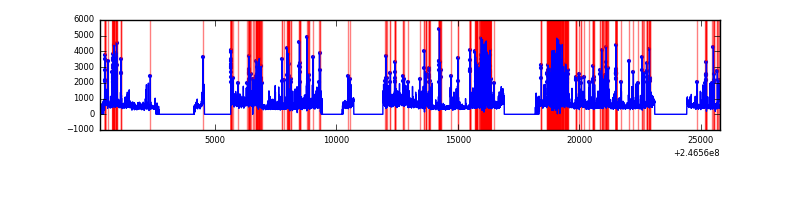 |
Top three noisy pixels from each quadrant. If the there are fewer than three noisy pixels in the level2.evt file, extra rows are filled as -1
| Pixel properties | Quadrant properties | ||||||
|---|---|---|---|---|---|---|---|
| Quadrant | DetID | PixID | Counts | Sigma | Mean | Median | Sigma |
| A | 8 | 5 | 2452449 | 5894.7 | 2084 | 2041 | 415.7 |
| A | 14 | 238 | 1408739 | 3383.95 | 2084 | 2041 | 415.7 |
| A | 8 | 15 | 1290000 | 3098.32 | 2084 | 2041 | 415.7 |
| B | 4 | 239 | 681809 | 1697.91 | 2154 | 2104 | 400.3 |
| B | 15 | 204 | 163601 | 403.42 | 2154 | 2104 | 400.3 |
| B | 0 | 187 | 75008 | 182.11 | 2154 | 2104 | 400.3 |
| C | 4 | 254 | 130864 | 265.64 | 2106 | 2117 | 484.7 |
| C | 1 | 3 | 83713 | 168.35 | 2106 | 2117 | 484.7 |
| C | 13 | 61 | 15788 | 28.21 | 2106 | 2117 | 484.7 |
| D | 1 | 52 | 2788429 | 5758.71 | 2032 | 1983 | 483.9 |
| D | 5 | 222 | 445494 | 916.6 | 2032 | 1983 | 483.9 |
| D | 10 | 253 | 328101 | 673.98 | 2032 | 1983 | 483.9 |
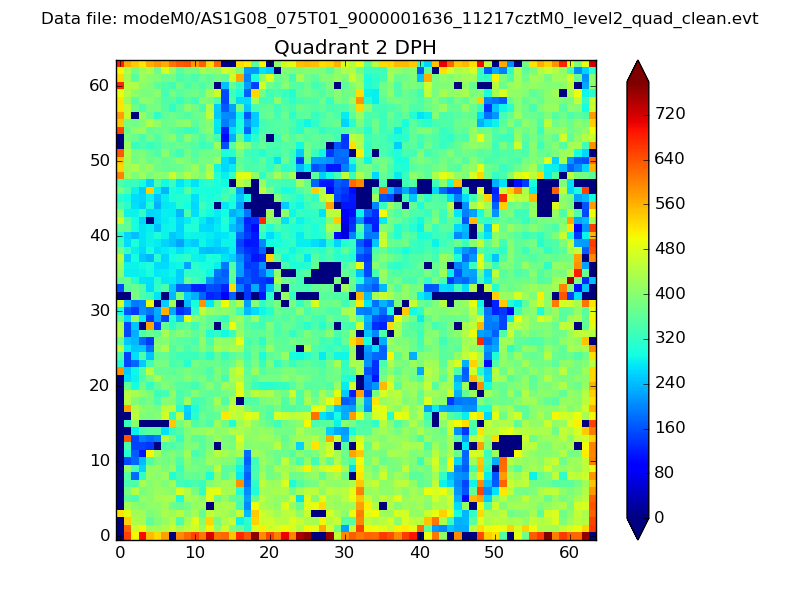
Histogram calculated using DETX and DETY for each event in the final _common_clean file
| Quadrant A | 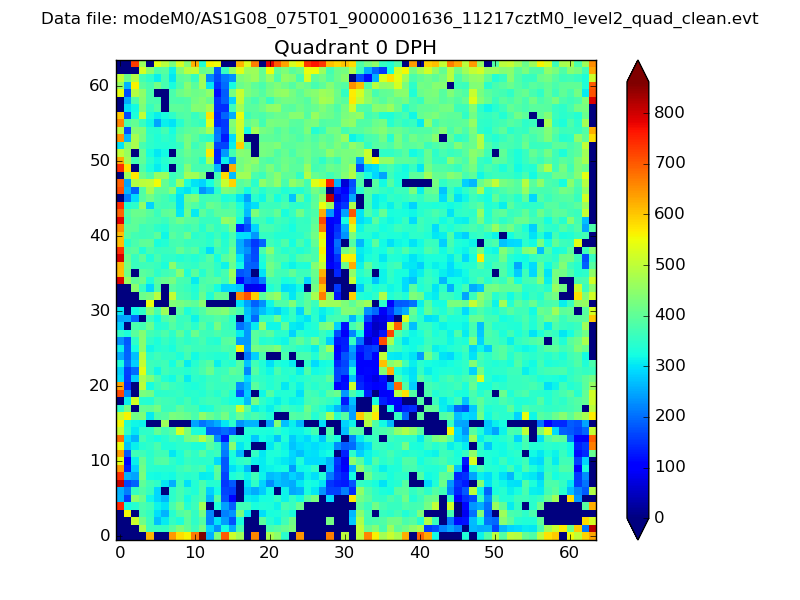 |
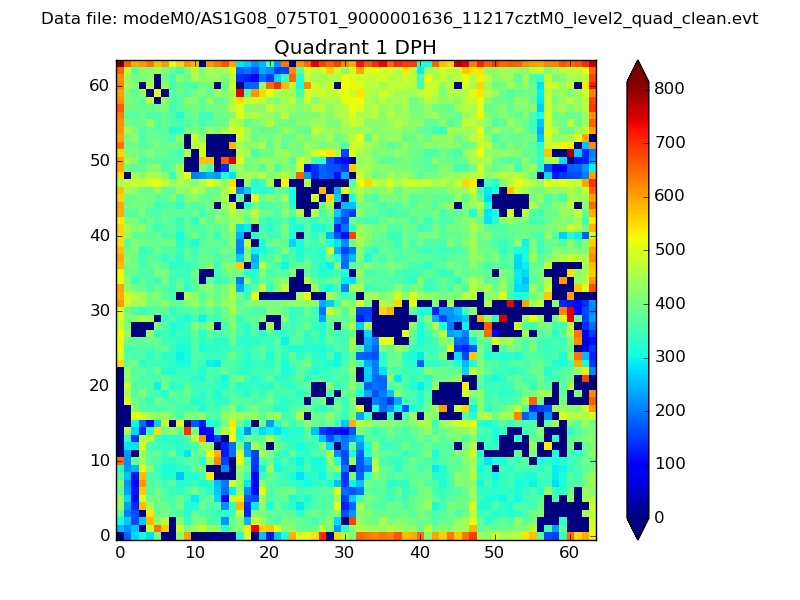 |
Quadrant B |
|---|---|---|---|
| Quadrant D | 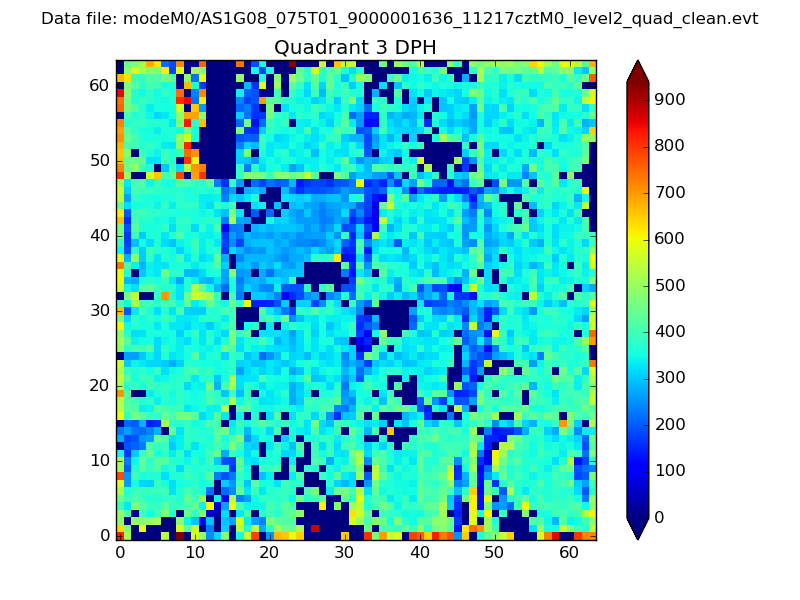 |
 |
Quadrant C |
| Plot type | Count rate plots | Images |
|---|---|---|
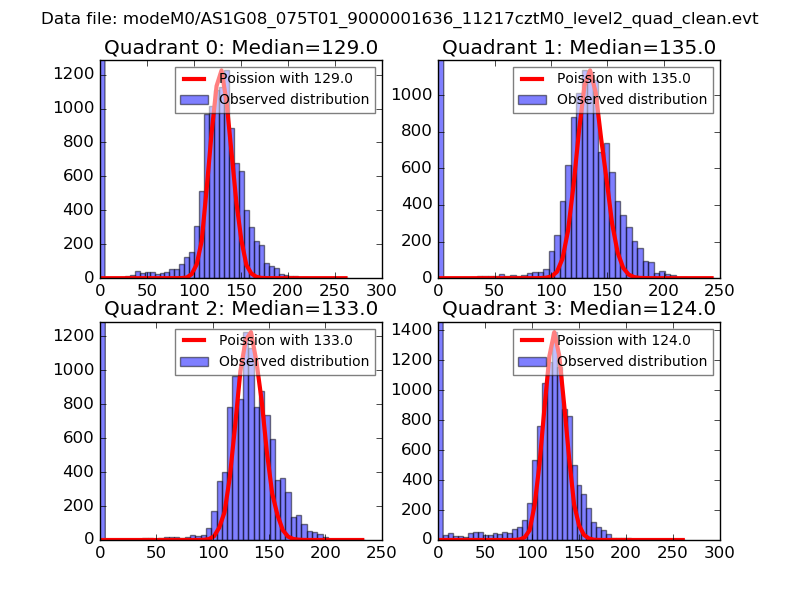
| Comparison with Poisson distribution Blue bars denote a histogram of data divided into 1 sec bins. Red curve is a Poisson curve with rate = median count rate of data. |
 |
 |
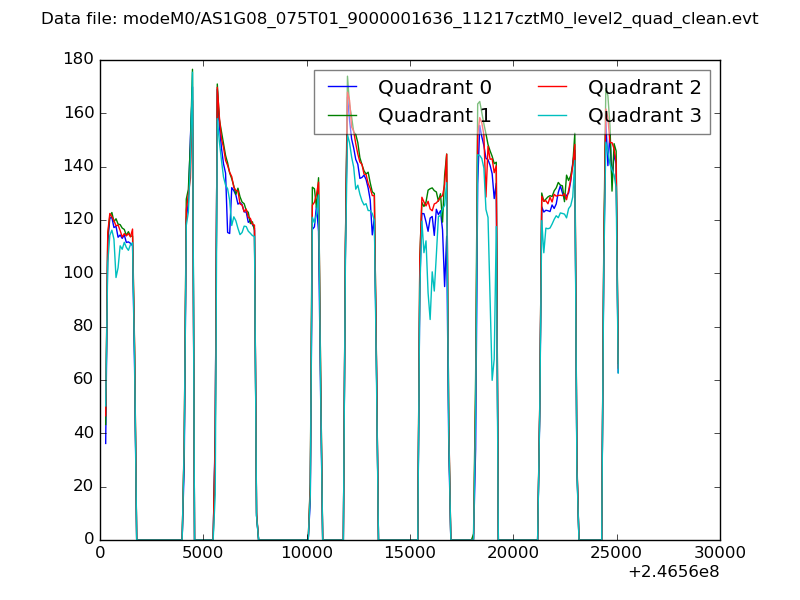
| Quadrant-wise count rates Data is divided into 100 sec bins |
 |
|
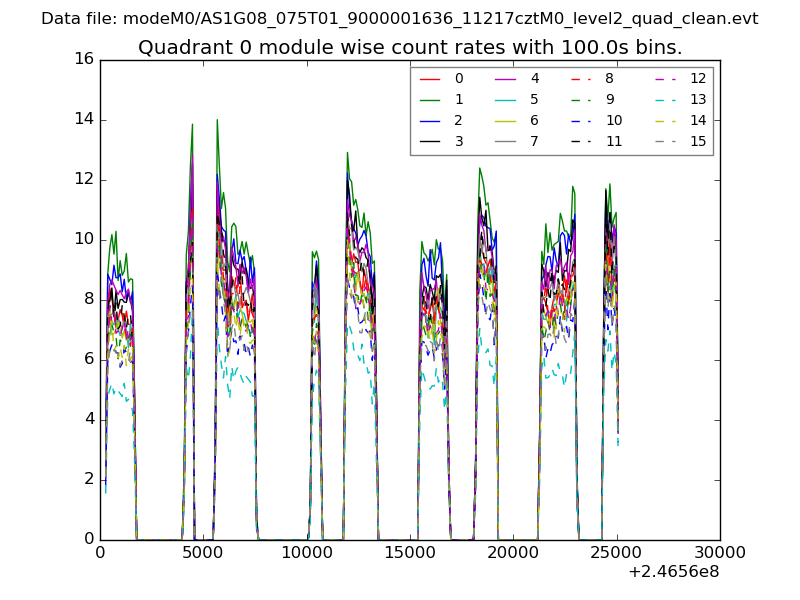
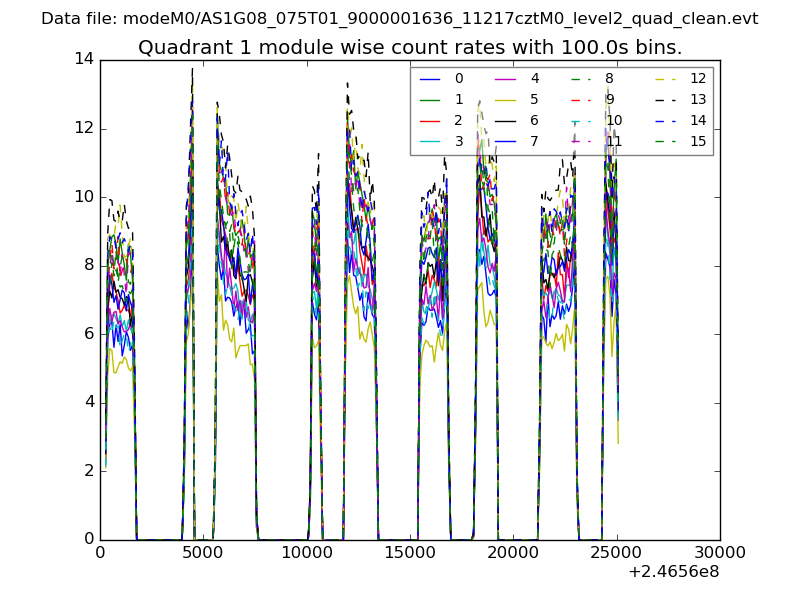
| Module-wise count rates for Quadrant A Data is divided into 100 sec bins |
 |
 |
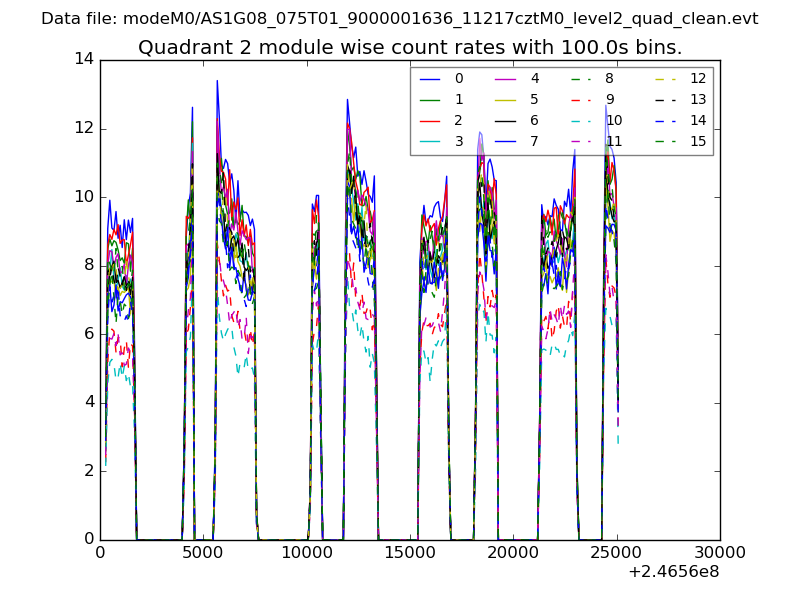
| Module-wise count rates for Quadrant B Data is divided into 100 sec bins |
 |
 |
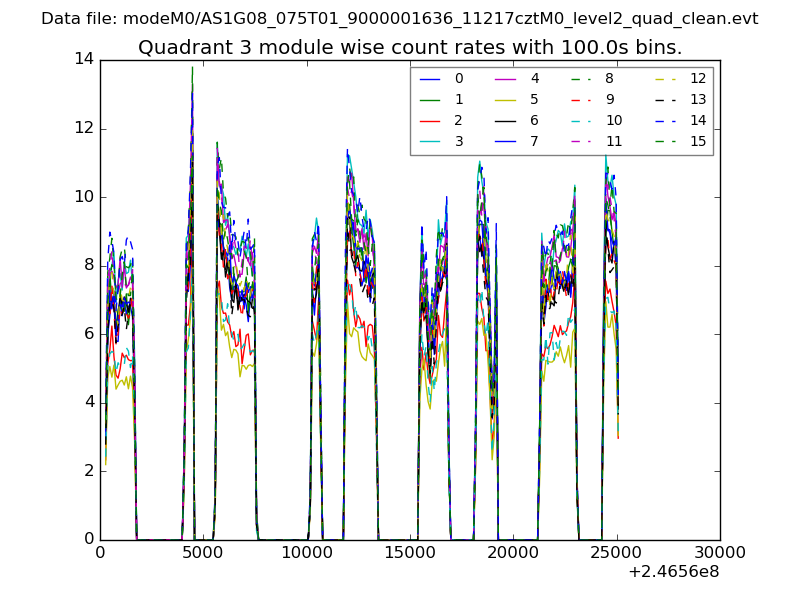
| Module-wise count rates for Quadrant C Data is divided into 100 sec bins |
 |
 |
| Module-wise count rates for Quadrant D Data is divided into 100 sec bins |
 |
 |
| Parameter | Plot |
|---|---|
| CZT HV Monitor | 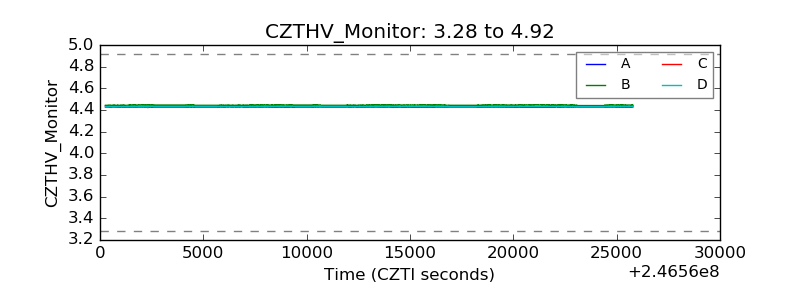 |
| D_VDD | 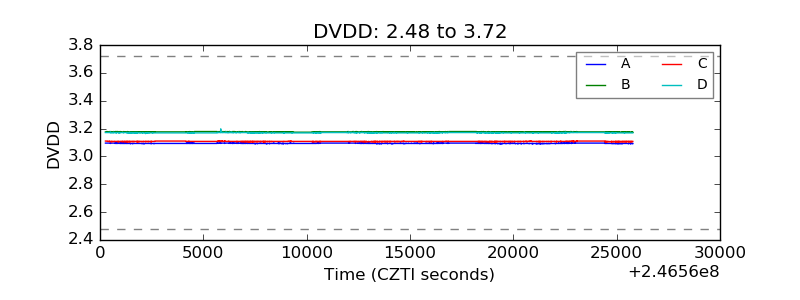 |
| Temperature 1 | 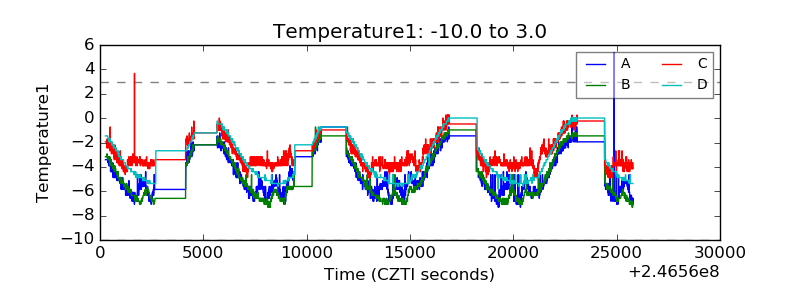 |
| Veto HV Monitor | 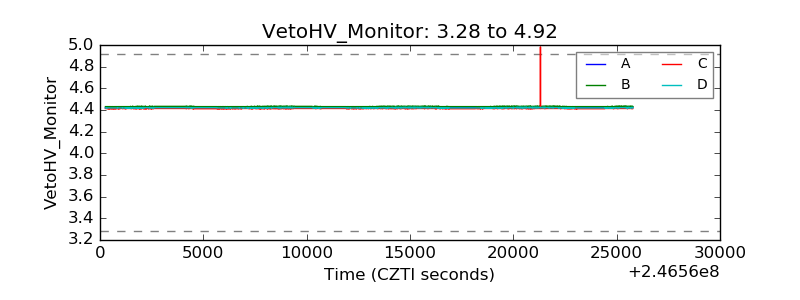 |
| Veto LLD | 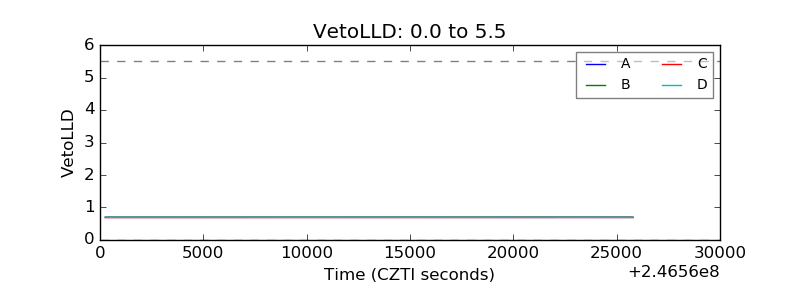 |
| Alpha Counter | 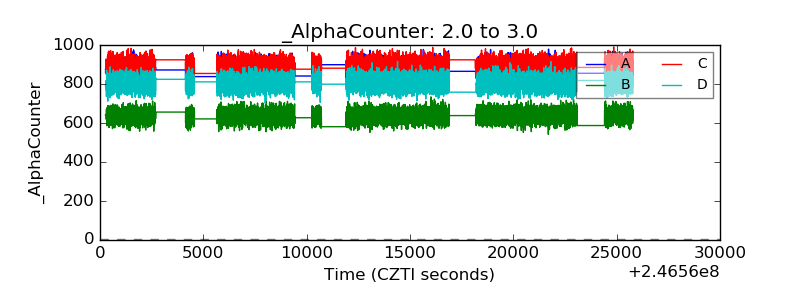 |
| _CPM_Rate | 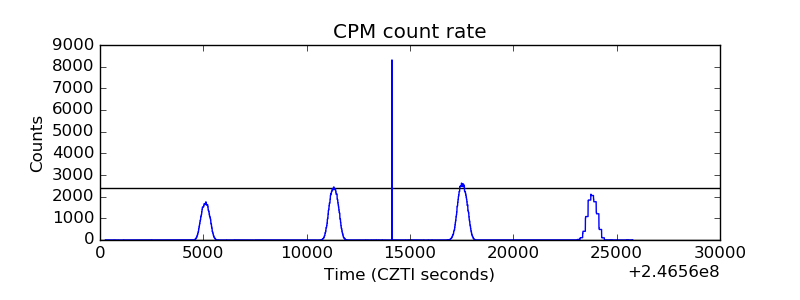 |
| CZT Counter | 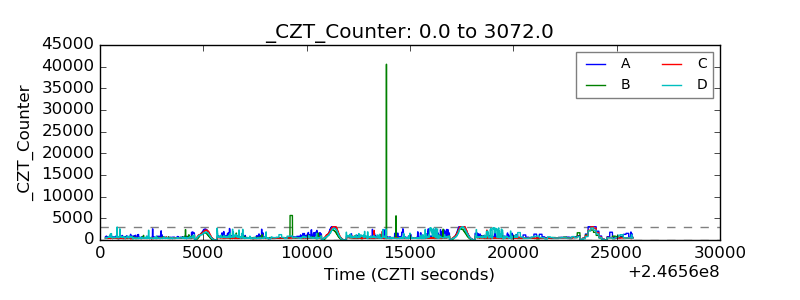 |
| +2.5 Volts monitor | 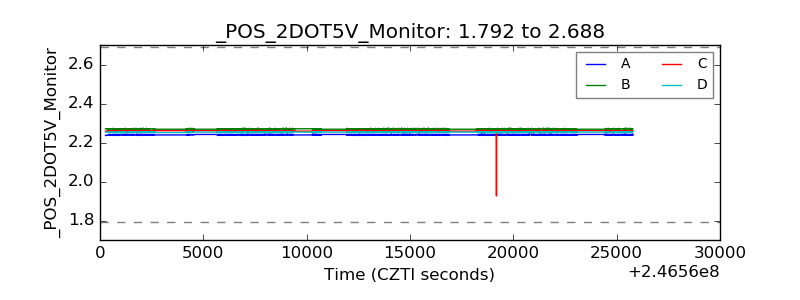 |
| +5 Volts monitor | 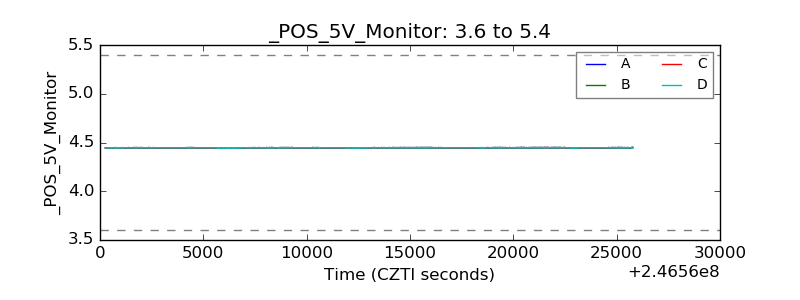 |
| _ROLL_ROT | 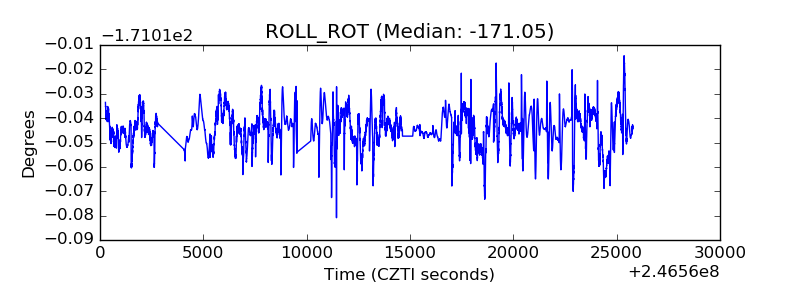 |
| _Roll_DEC | 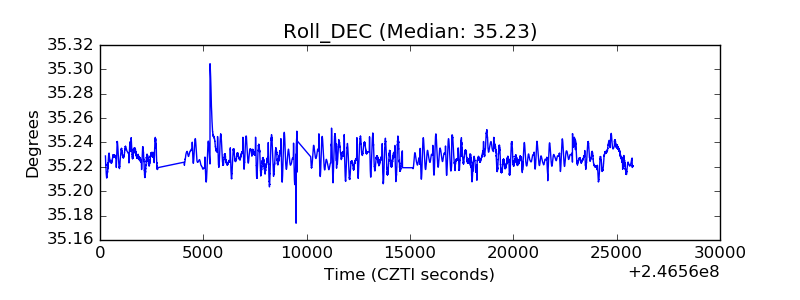 |
| _Roll_RA |  |
| Veto Counter | 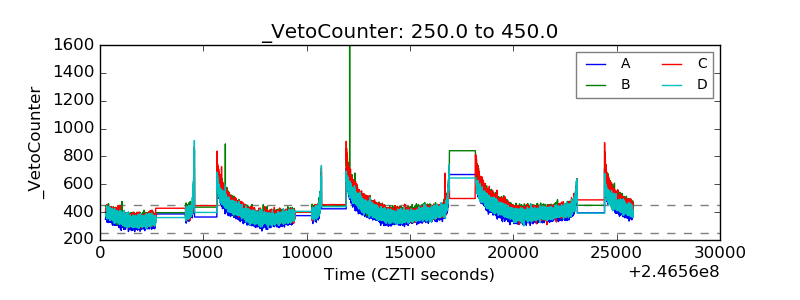 |