| Param | Original file | Final file |
|---|---|---|
| Filename | modeM0/AS1G08_075T01_9000001636_11218cztM0_level2.evt | modeM0/AS1G08_075T01_9000001636_11218cztM0_level2_quad_clean.evt |
| Size (bytes) | 555,301,440 | 71,504,640 |
| Size | 529.6 MB | 68.2 MB |
| Events in quadrant A | 6,099,264 | 422,790 |
| Events in quadrant B | 3,749,886 | 441,031 |
| Events in quadrant C | 3,067,662 | 438,430 |
| Events in quadrant D | 3,461,926 | 411,104 |
| Mode M0 | |||
|---|---|---|---|
| Quadrant | BADHDUFLAG | Total packets | Discarded packets |
| A | 0 | 22707 | 3 |
| B | 0 | 15264 | 2 |
| C | 0 | 13410 | 2 |
| D | 0 | 14736 | 2 |
| Mode M9 | |||
|---|---|---|---|
| Quadrant | BADHDUFLAG | Total packets | Discarded packets |
| A | 0 | 21 | 0 |
| B | 0 | 21 | 0 |
| C | 0 | 21 | 0 |
| D | 0 | 22 | 0 |
| Mode SS | |||
|---|---|---|---|
| Quadrant | BADHDUFLAG | Total packets | Discarded packets |
| A | 0 | 130 | 0 |
| B | 0 | 130 | 0 |
| C | 0 | 130 | 0 |
| D | 0 | 130 | 0 |
| Quadrant | Total seconds | Saturated seconds | Saturation percentage |
|---|---|---|---|
| A | 6478 | 555 | 8.567459% |
| B | 6478 | 173 | 2.670577% |
| C | 6478 | 10 | 0.154369% |
| D | 6478 | 102 | 1.574560% |
Noise dominated data is calculated using 1-second bins in cleaned event files. If a bin has >2000 counts, and if more than 50% of those come from <1% of pixels, then it is considered to be noise-dominated and hence unusable.
| Quadrant | # 1 sec bins | Bins with >0 counts | Bins with >2000 counts | High rate bins dominated by noise | Noise dominated (total time) | Noise dominated (detector-on time) | Marked lightcurve |
|---|---|---|---|---|---|---|---|
| A | 7758 | 6479 | 442 | 442 | 5.70% | 6.82% | 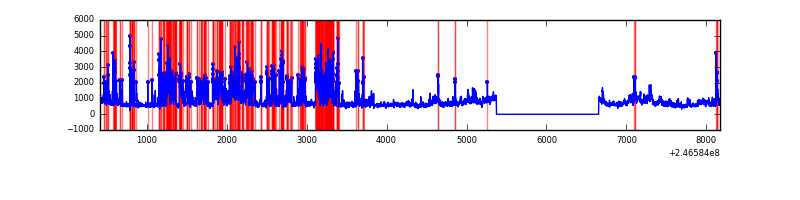 |
| B | 7758 | 6479 | 75 | 75 | 0.97% | 1.16% | 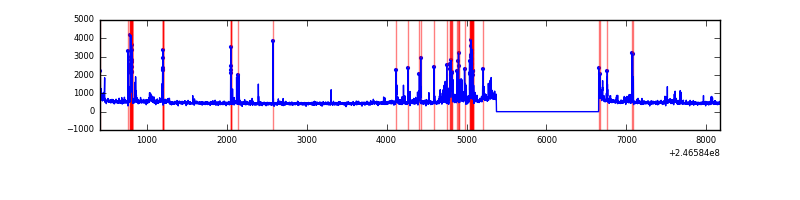 |
| C | 7758 | 6479 | 2 | 2 | 0.03% | 0.03% | 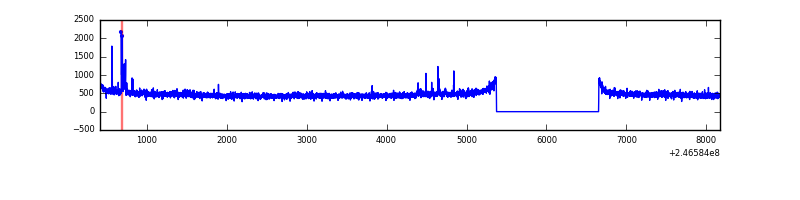 |
| D | 7758 | 6479 | 85 | 85 | 1.10% | 1.31% | 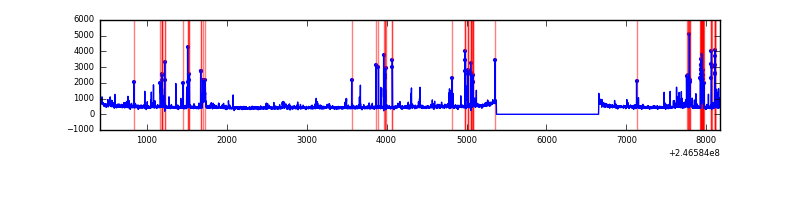 |
Top three noisy pixels from each quadrant. If the there are fewer than three noisy pixels in the level2.evt file, extra rows are filled as -1
| Pixel properties | Quadrant properties | ||||||
|---|---|---|---|---|---|---|---|
| Quadrant | DetID | PixID | Counts | Sigma | Mean | Median | Sigma |
| A | 8 | 5 | 1859315 | 12077.51 | 763 | 748 | 153.9 |
| A | 8 | 15 | 983656 | 6387.22 | 763 | 748 | 153.9 |
| A | 14 | 238 | 189394 | 1225.88 | 763 | 748 | 153.9 |
| B | 4 | 239 | 509892 | 3458.14 | 787 | 768 | 147.2 |
| B | 15 | 204 | 45602 | 304.53 | 787 | 768 | 147.2 |
| B | 0 | 214 | 40730 | 271.43 | 787 | 768 | 147.2 |
| C | 4 | 254 | 39749 | 220.46 | 770 | 776 | 176.8 |
| C | 14 | 67 | 16671 | 89.91 | 770 | 776 | 176.8 |
| C | 14 | 251 | 7676 | 39.03 | 770 | 776 | 176.8 |
| D | 10 | 253 | 266481 | 1474.39 | 751 | 731 | 180.2 |
| D | 2 | 14 | 83317 | 458.19 | 751 | 731 | 180.2 |
| D | 13 | 104 | 52695 | 288.3 | 751 | 731 | 180.2 |
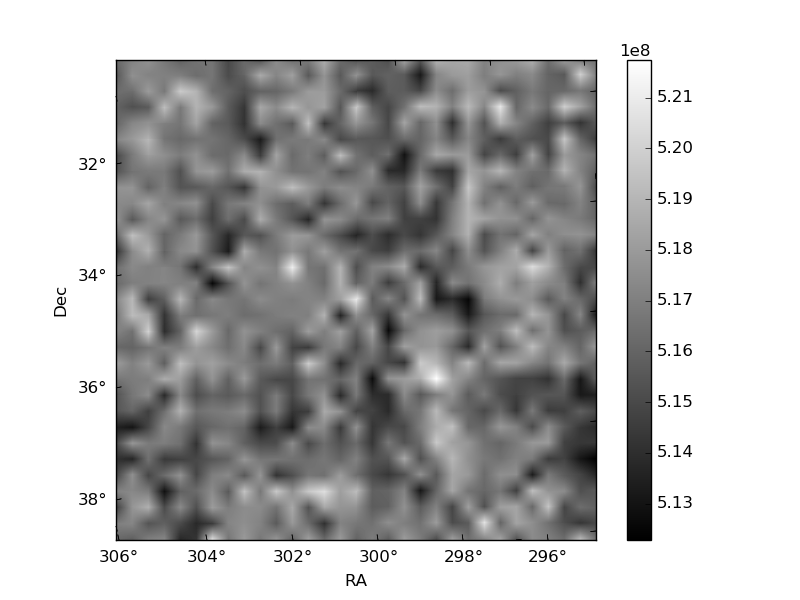
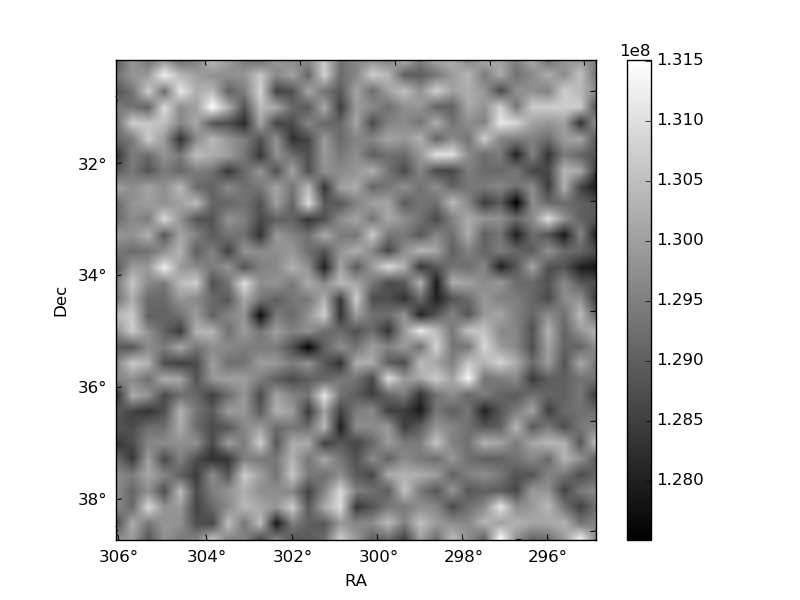
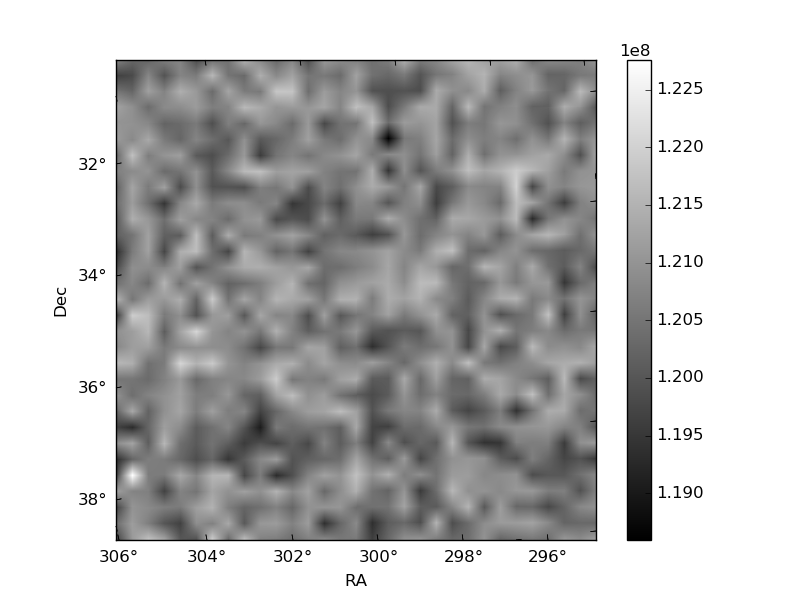
Histogram calculated using DETX and DETY for each event in the final _common_clean file
| Quadrant A | 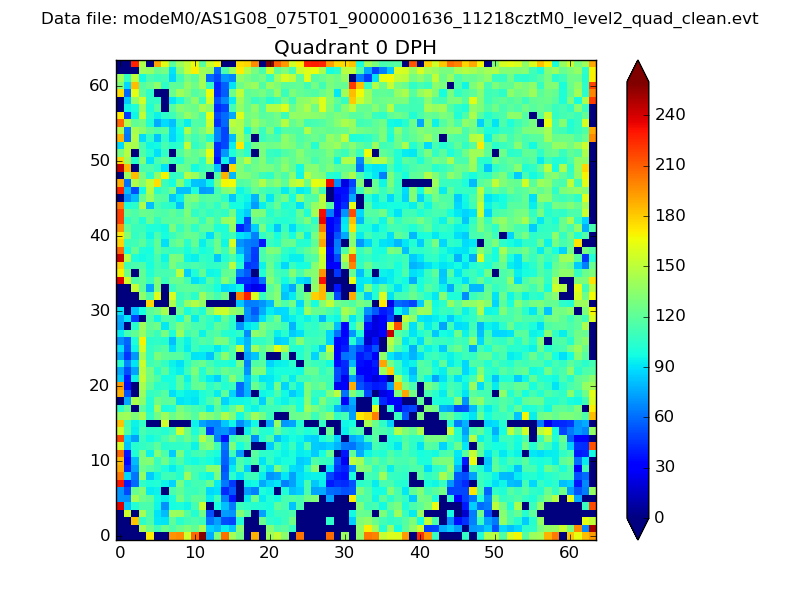 |
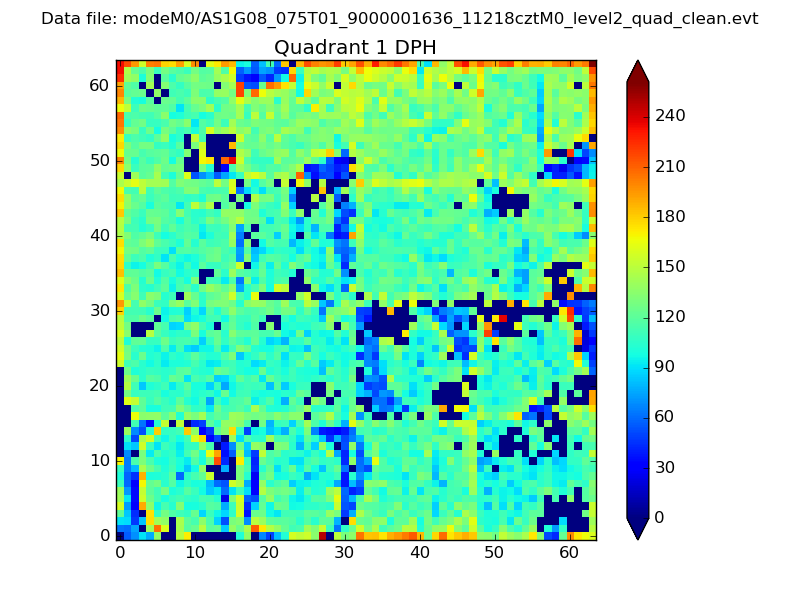 |
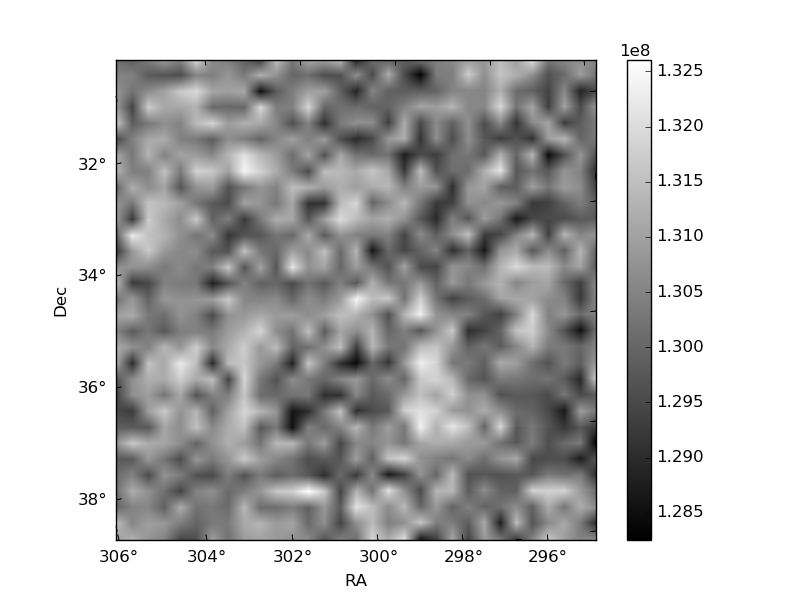
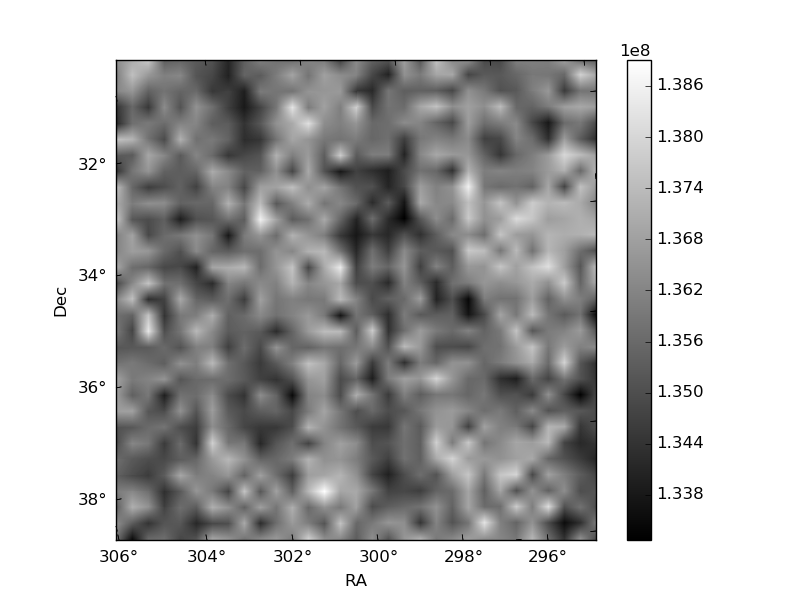
Quadrant B |
|---|---|---|---|
| Quadrant D | 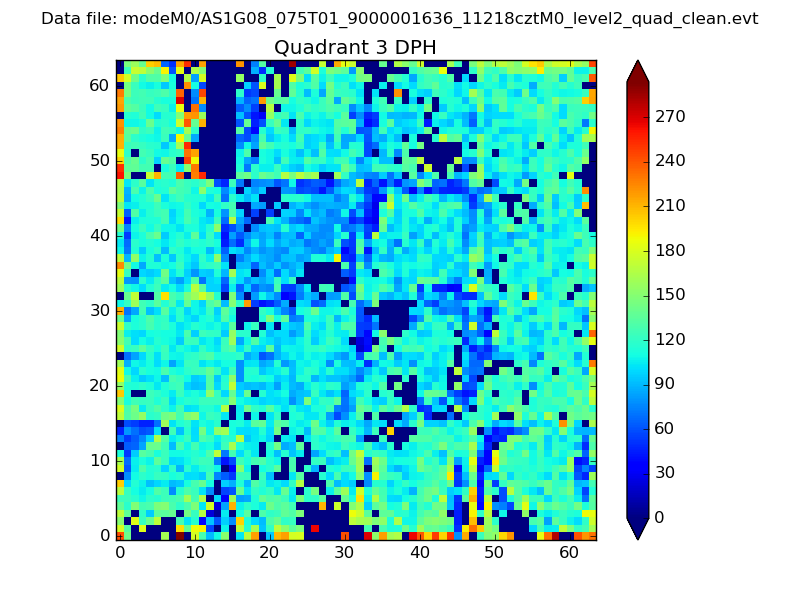 |
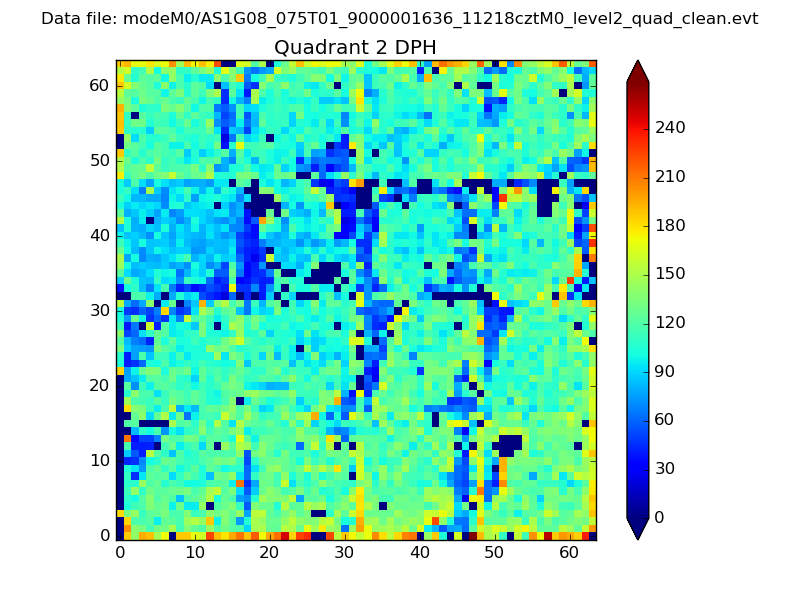 |
Quadrant C |
| Plot type | Count rate plots | Images |
|---|---|---|
| Comparison with Poisson distribution Blue bars denote a histogram of data divided into 1 sec bins. Red curve is a Poisson curve with rate = median count rate of data. |
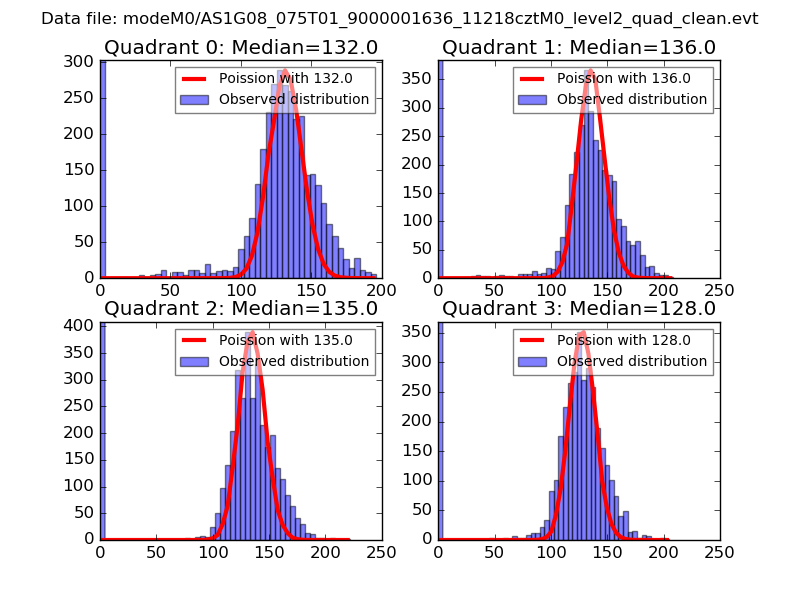 |
 |
| Quadrant-wise count rates Data is divided into 100 sec bins |
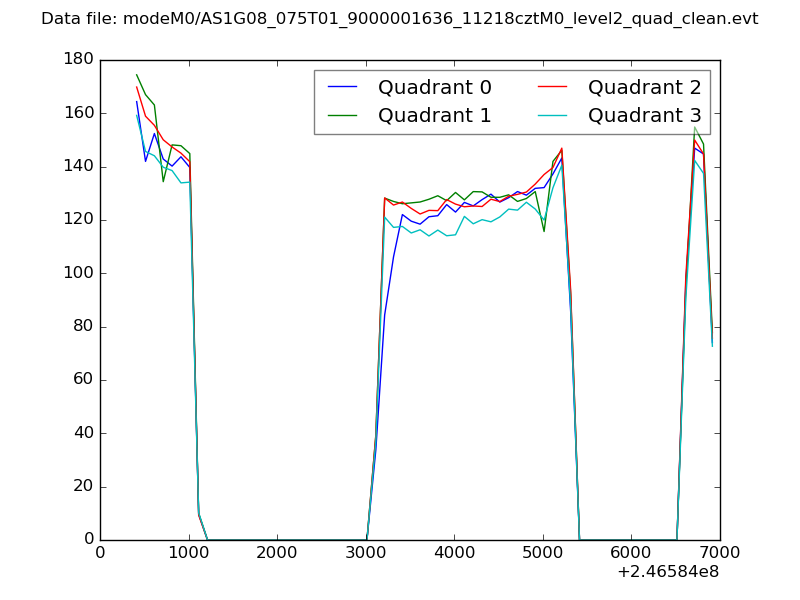 |
|
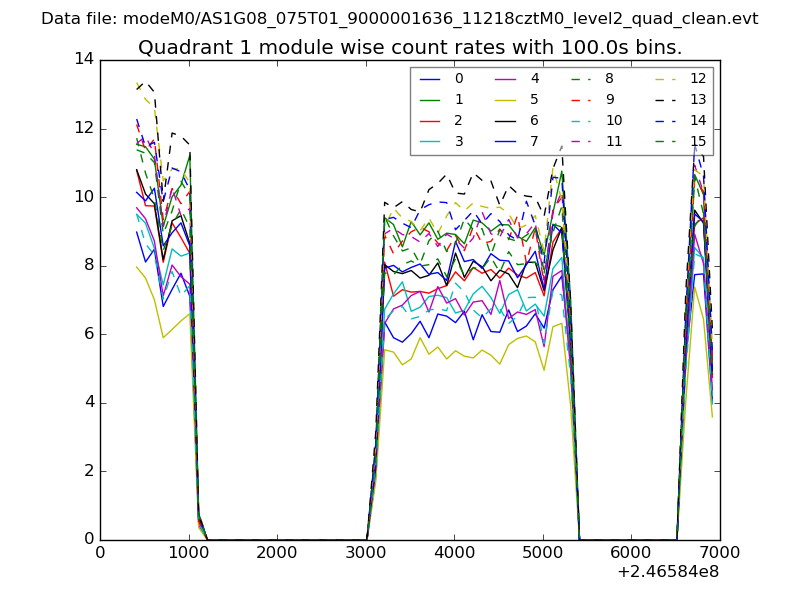
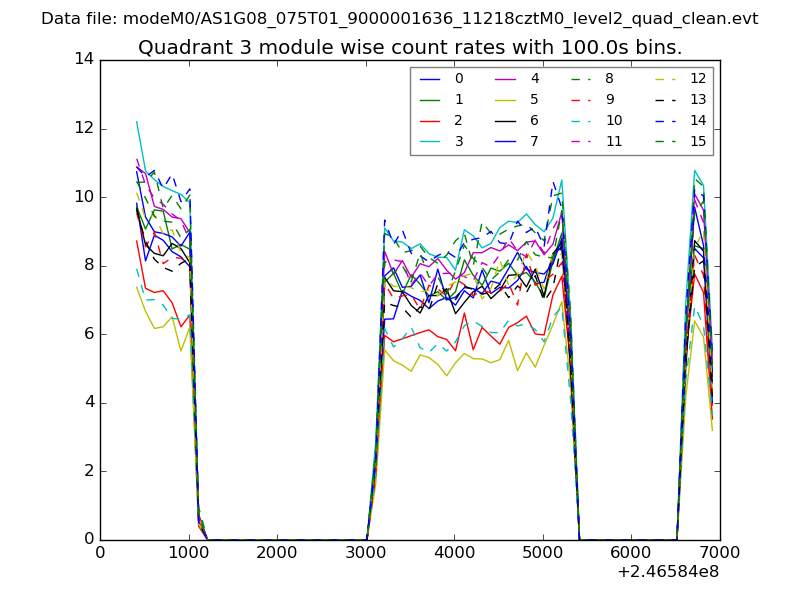
| Module-wise count rates for Quadrant A Data is divided into 100 sec bins |
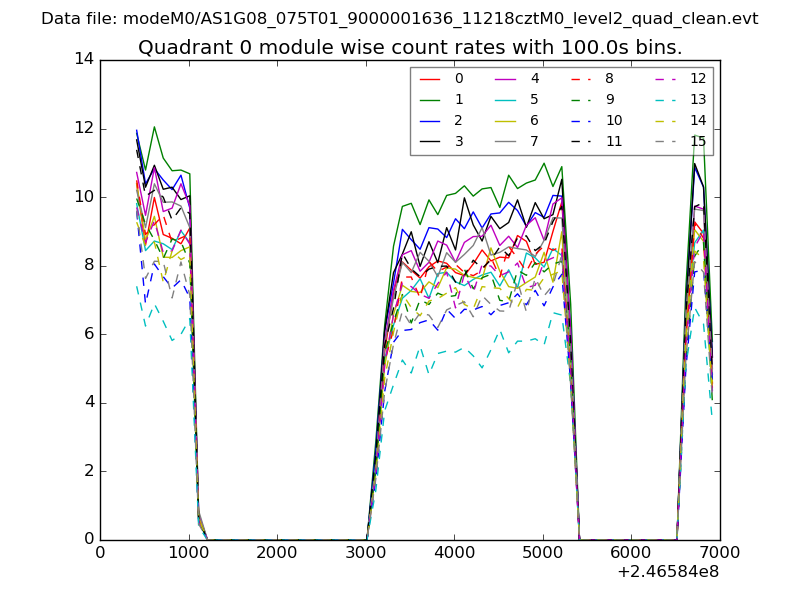 |
 |
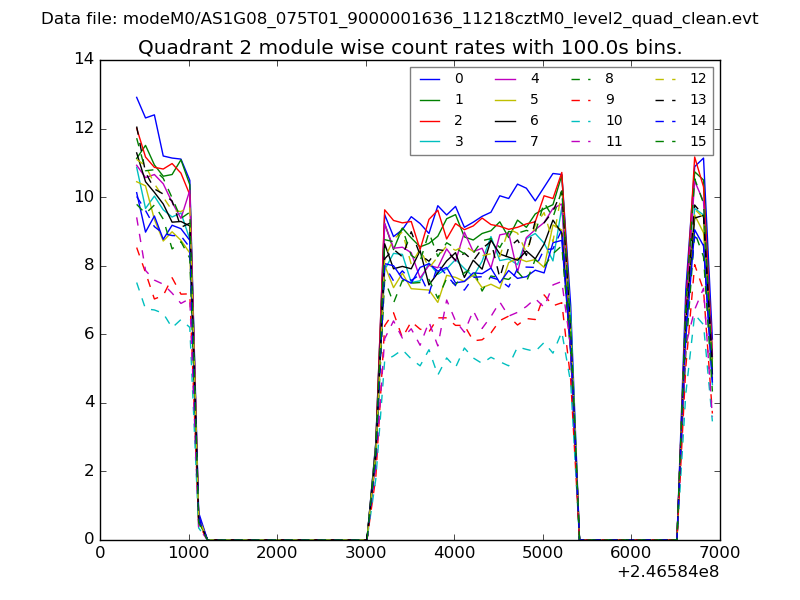
| Module-wise count rates for Quadrant B Data is divided into 100 sec bins |
 |
 |
| Module-wise count rates for Quadrant C Data is divided into 100 sec bins |
 |
 |
| Module-wise count rates for Quadrant D Data is divided into 100 sec bins |
 |
 |
| Parameter | Plot |
|---|---|
| CZT HV Monitor | 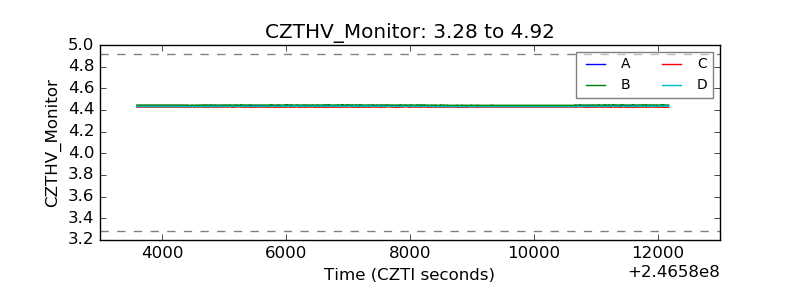 |
| D_VDD | 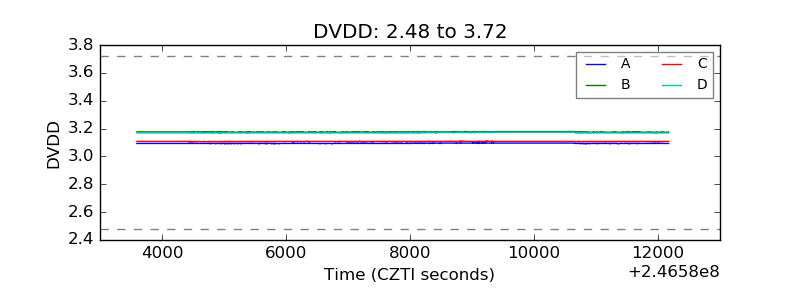 |
| Temperature 1 | 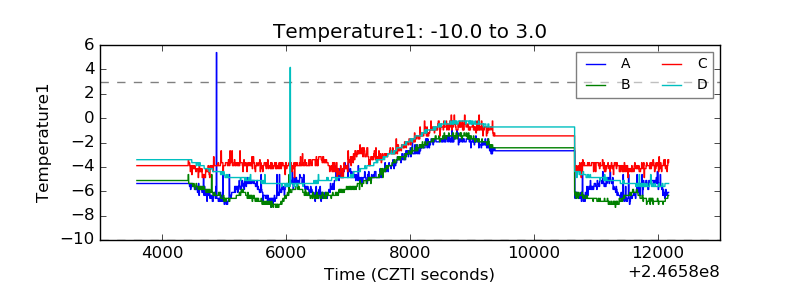 |
| Veto HV Monitor | 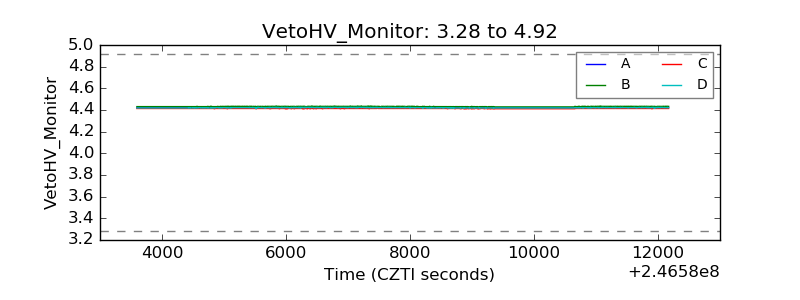 |
| Veto LLD | 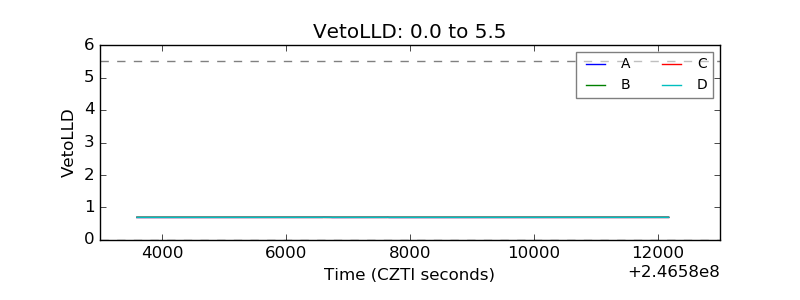 |
| Alpha Counter | 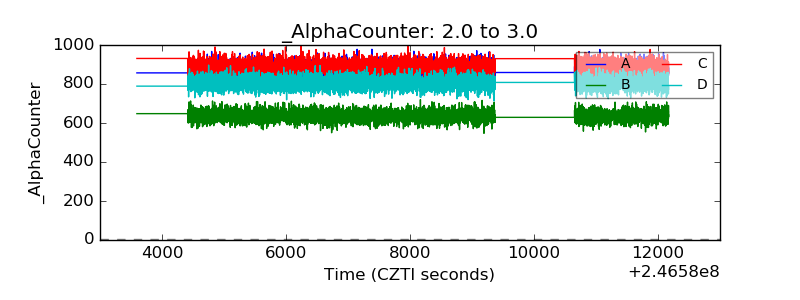 |
| _CPM_Rate | 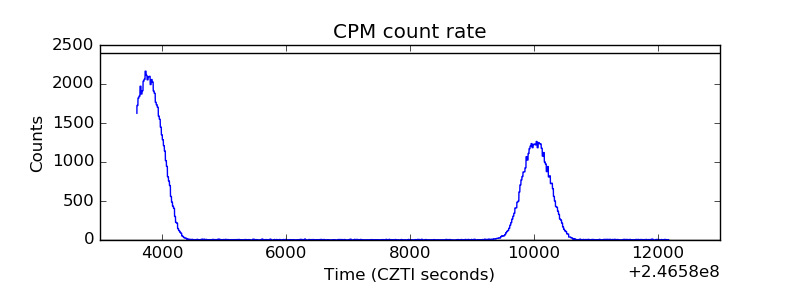 |
| CZT Counter | 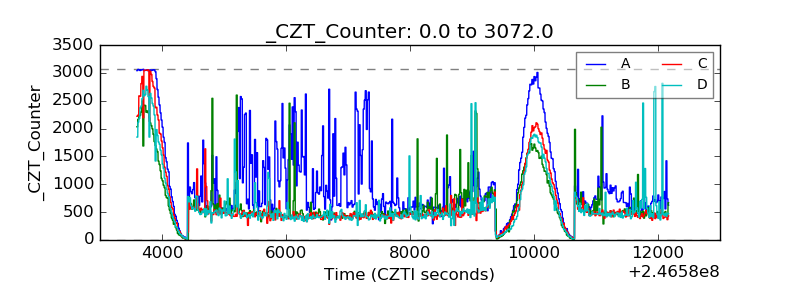 |
| +2.5 Volts monitor |  |
| +5 Volts monitor |  |
| _ROLL_ROT | 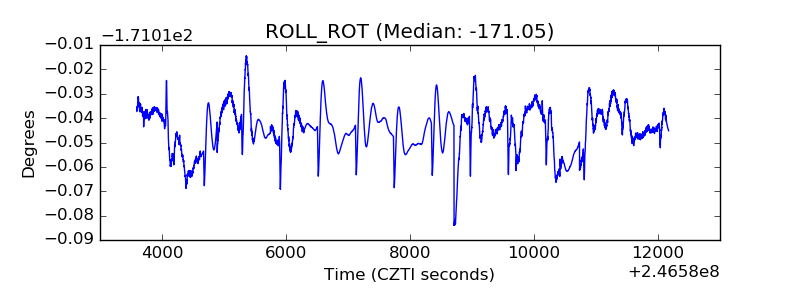 |
| _Roll_DEC | 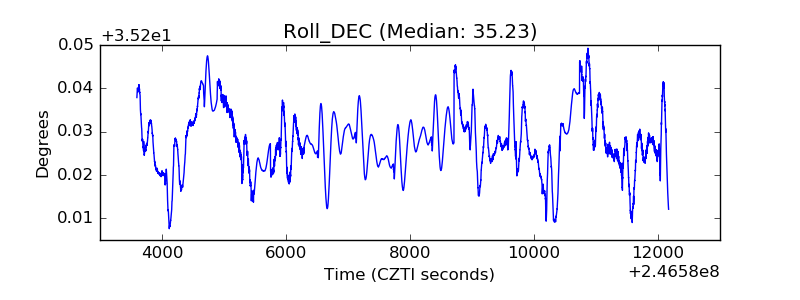 |
| _Roll_RA | 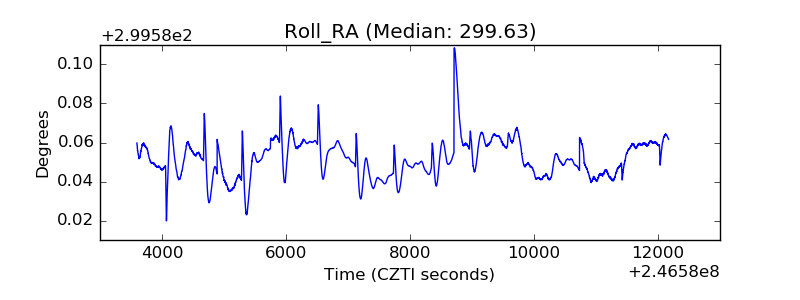 |
| Veto Counter | 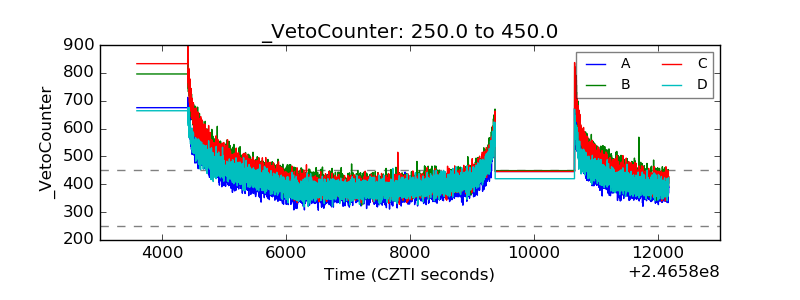 |