| Param | Original file | Final file |
|---|---|---|
| Filename | modeM0/AS1G08_075T01_9000001636_11219cztM0_level2.evt | modeM0/AS1G08_075T01_9000001636_11219cztM0_level2_quad_clean.evt |
| Size (bytes) | 256,170,240 | 29,969,280 |
| Size | 244.3 MB | 28.6 MB |
| Events in quadrant A | 2,276,598 | 167,177 |
| Events in quadrant B | 1,738,119 | 172,852 |
| Events in quadrant C | 1,509,065 | 170,404 |
| Events in quadrant D | 2,002,938 | 156,470 |
| Mode M0 | |||
|---|---|---|---|
| Quadrant | BADHDUFLAG | Total packets | Discarded packets |
| A | 0 | 9016 | 1 |
| B | 0 | 7339 | 1 |
| C | 0 | 6871 | 1 |
| D | 0 | 8208 | 1 |
| Mode M9 | |||
|---|---|---|---|
| Quadrant | BADHDUFLAG | Total packets | Discarded packets |
| A | 0 | 13 | 0 |
| B | 0 | 13 | 0 |
| C | 0 | 13 | 0 |
| D | 0 | 13 | 0 |
| Mode SS | |||
|---|---|---|---|
| Quadrant | BADHDUFLAG | Total packets | Discarded packets |
| A | 0 | 70 | 0 |
| B | 0 | 70 | 0 |
| C | 0 | 70 | 0 |
| D | 0 | 70 | 0 |
| Quadrant | Total seconds | Saturated seconds | Saturation percentage |
|---|---|---|---|
| A | 3381 | 42 | 1.242236% |
| B | 3381 | 37 | 1.094351% |
| C | 3381 | 7 | 0.207039% |
| D | 3381 | 104 | 3.076013% |
Noise dominated data is calculated using 1-second bins in cleaned event files. If a bin has >2000 counts, and if more than 50% of those come from <1% of pixels, then it is considered to be noise-dominated and hence unusable.
| Quadrant | # 1 sec bins | Bins with >0 counts | Bins with >2000 counts | High rate bins dominated by noise | Noise dominated (total time) | Noise dominated (detector-on time) | Marked lightcurve |
|---|---|---|---|---|---|---|---|
| A | 4661 | 3382 | 9 | 9 | 0.19% | 0.27% | 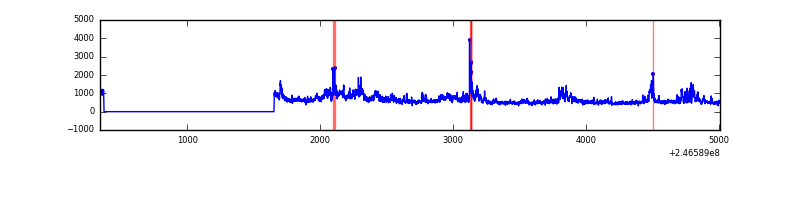 |
| B | 4661 | 3382 | 6 | 6 | 0.13% | 0.18% | 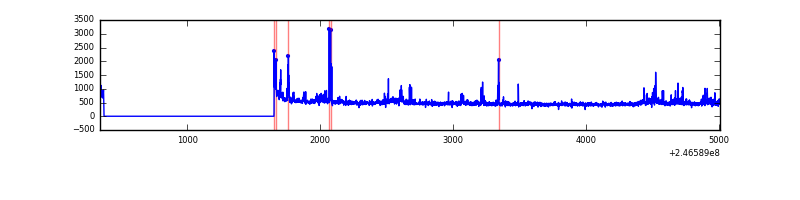 |
| C | 4661 | 3382 | 0 | 0 | 0.00% | 0.00% | 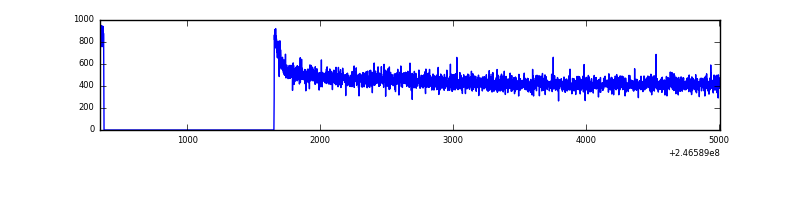 |
| D | 4661 | 3382 | 94 | 94 | 2.02% | 2.78% | 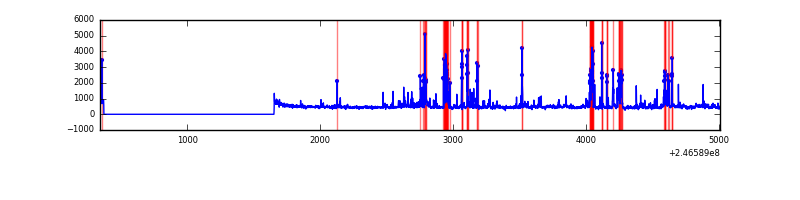 |
Top three noisy pixels from each quadrant. If the there are fewer than three noisy pixels in the level2.evt file, extra rows are filled as -1
| Pixel properties | Quadrant properties | ||||||
|---|---|---|---|---|---|---|---|
| Quadrant | DetID | PixID | Counts | Sigma | Mean | Median | Sigma |
| A | 8 | 15 | 505070 | 6311.48 | 393 | 386 | 80.0 |
| A | 15 | 174 | 182075 | 2272.17 | 393 | 386 | 80.0 |
| A | 14 | 238 | 54028 | 670.84 | 393 | 386 | 80.0 |
| B | 4 | 239 | 89456 | 1165.57 | 397 | 388 | 76.4 |
| B | 3 | 189 | 37264 | 482.57 | 397 | 388 | 76.4 |
| B | 0 | 214 | 25443 | 327.88 | 397 | 388 | 76.4 |
| C | 13 | 61 | 2765 | 26.49 | 386 | 389 | 89.7 |
| C | 4 | 254 | 1851 | 16.3 | 386 | 389 | 89.7 |
| C | 14 | 67 | 1096 | 7.88 | 386 | 389 | 89.7 |
| D | 10 | 253 | 305979 | 3366.76 | 373 | 363 | 90.8 |
| D | 13 | 249 | 101419 | 1113.26 | 373 | 363 | 90.8 |
| D | 8 | 195 | 81671 | 895.71 | 373 | 363 | 90.8 |
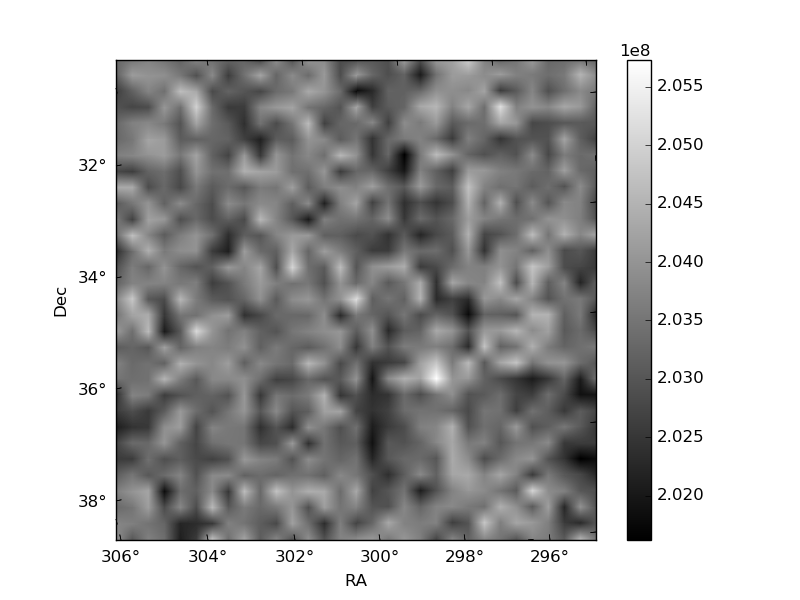
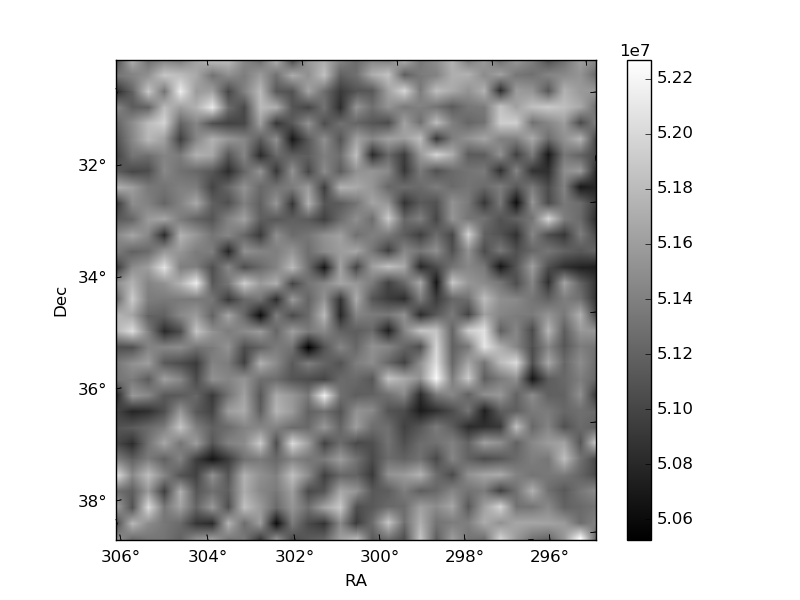
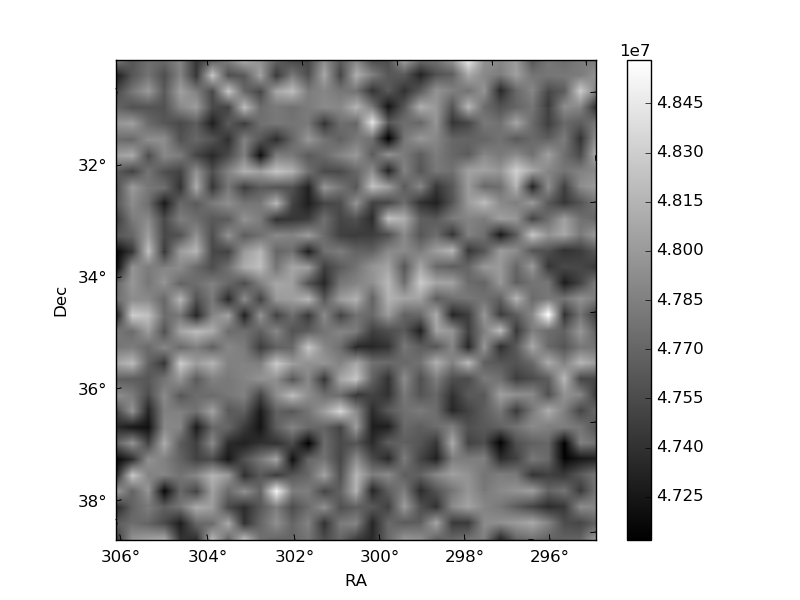
Histogram calculated using DETX and DETY for each event in the final _common_clean file
| Quadrant A | 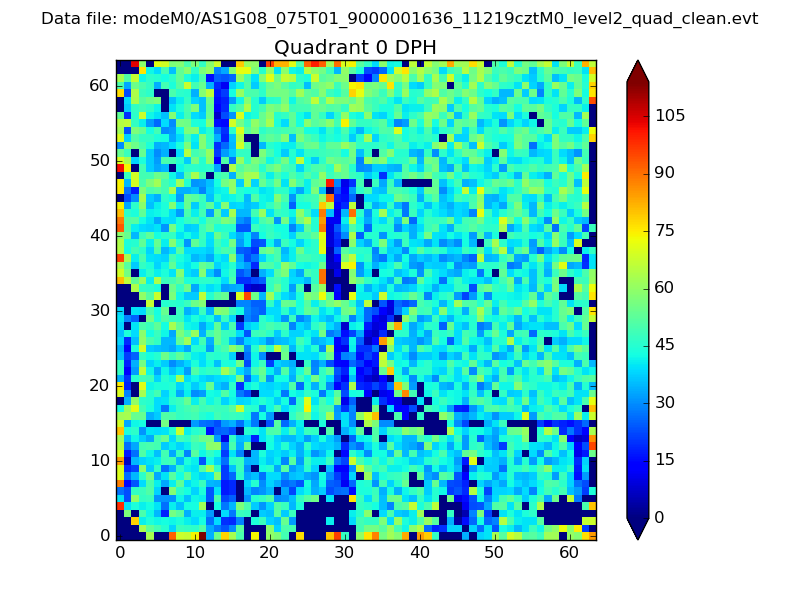 |
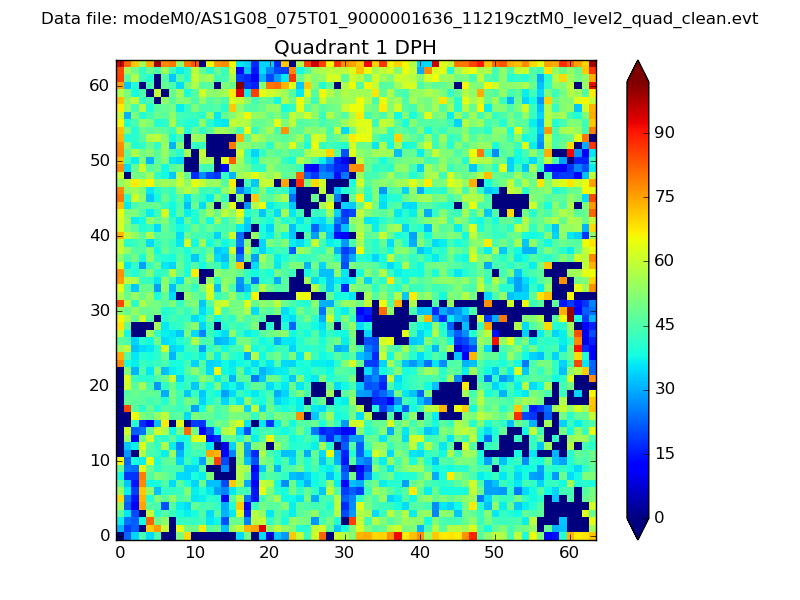 |
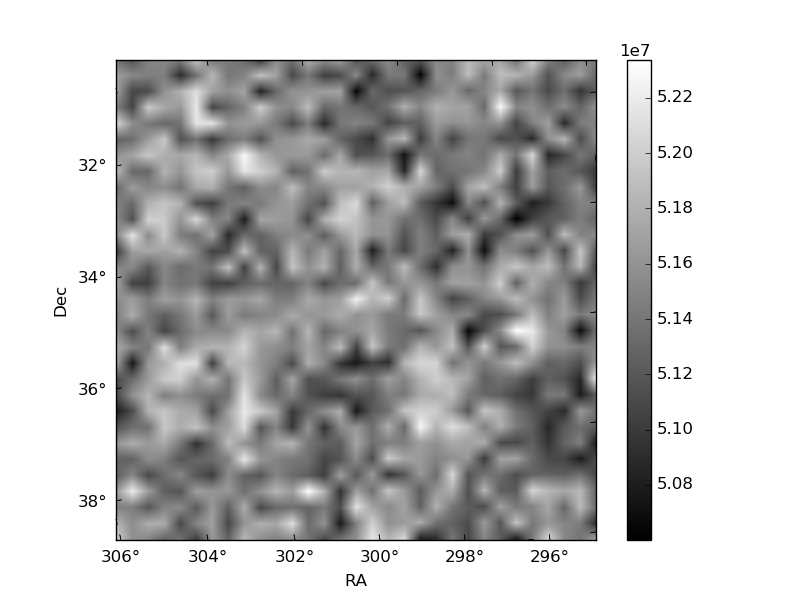
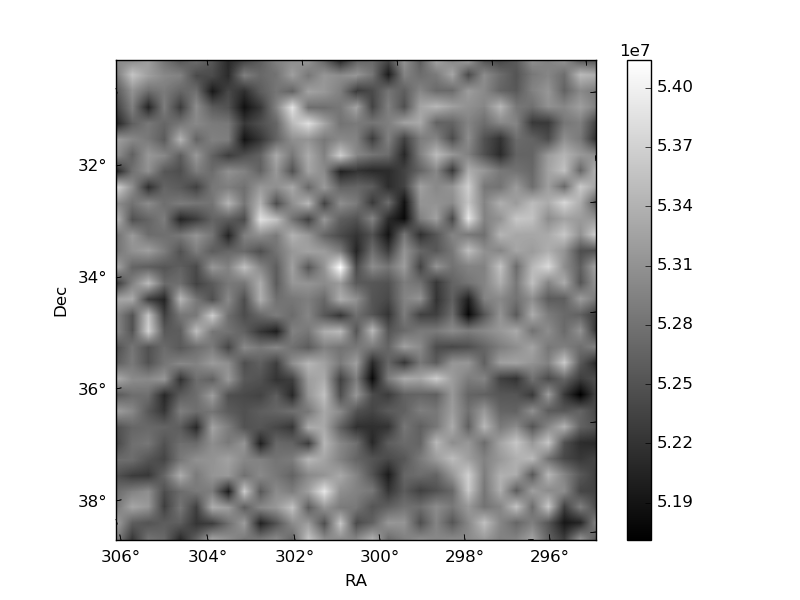
Quadrant B |
|---|---|---|---|
| Quadrant D | 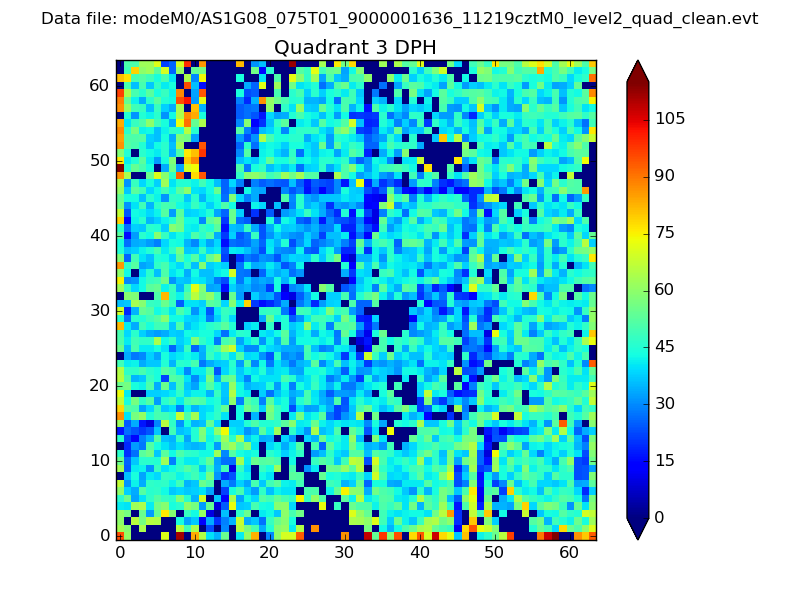 |
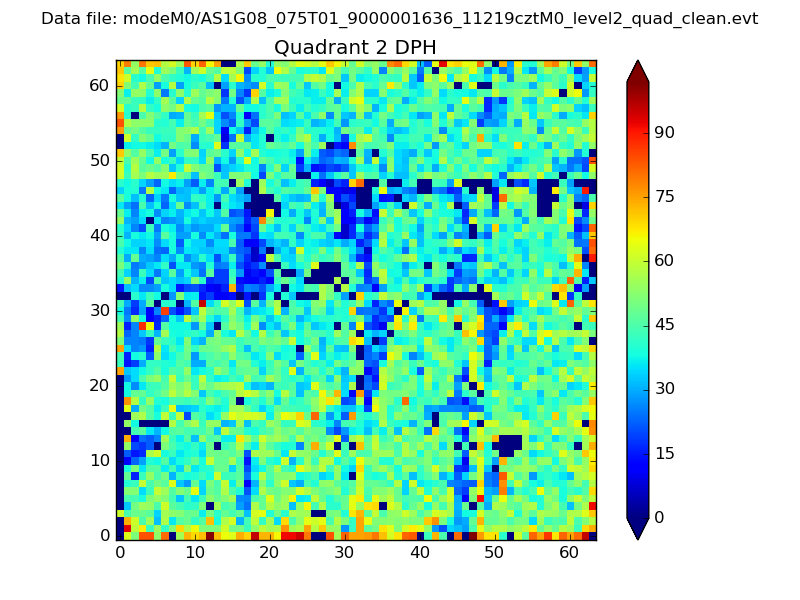 |
Quadrant C |
| Plot type | Count rate plots | Images |
|---|---|---|
| Comparison with Poisson distribution Blue bars denote a histogram of data divided into 1 sec bins. Red curve is a Poisson curve with rate = median count rate of data. |
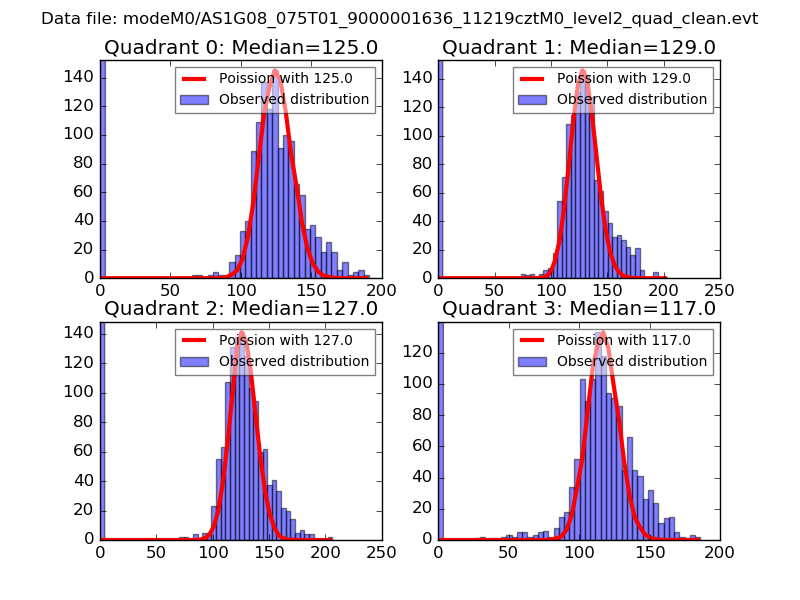 |
 |
| Quadrant-wise count rates Data is divided into 100 sec bins |
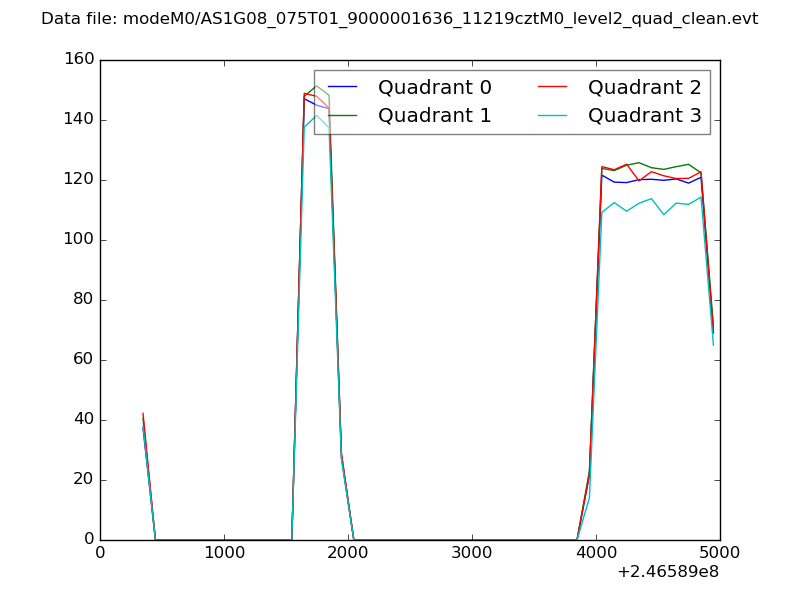 |
|
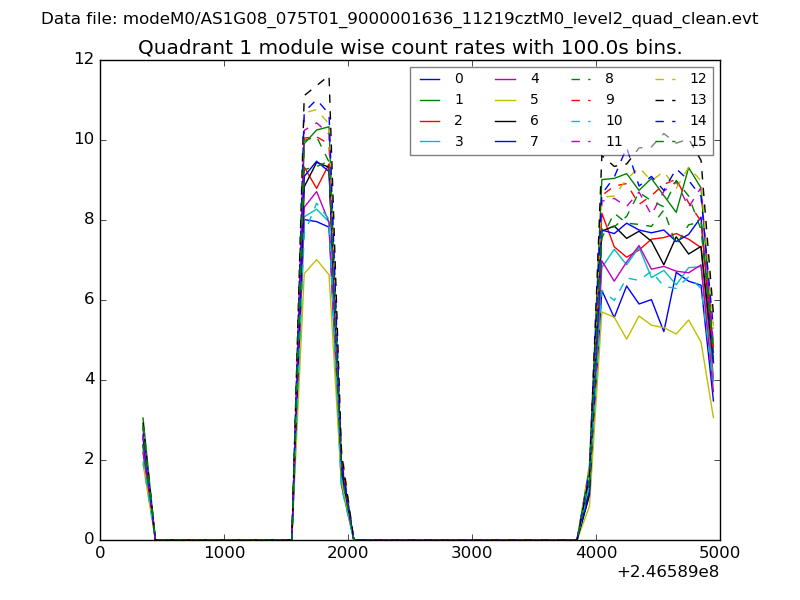
| Module-wise count rates for Quadrant A Data is divided into 100 sec bins |
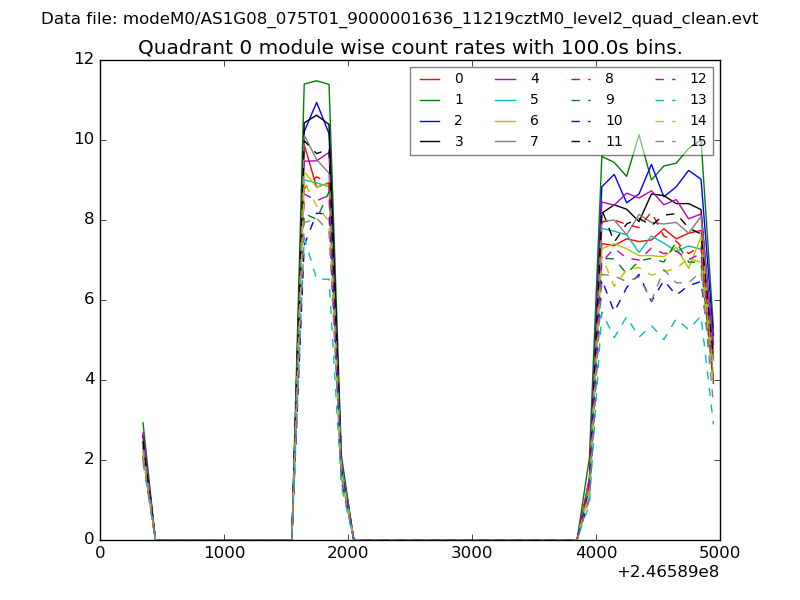 |
 |
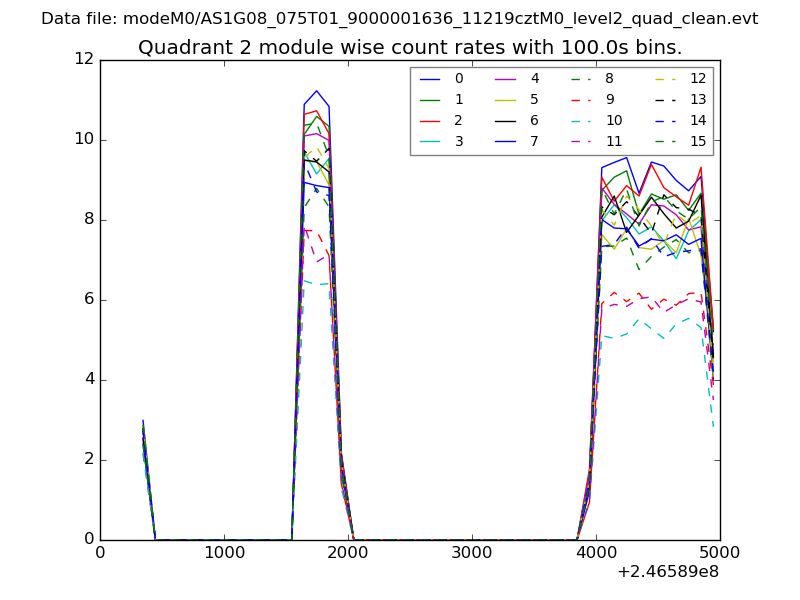
| Module-wise count rates for Quadrant B Data is divided into 100 sec bins |
 |
 |
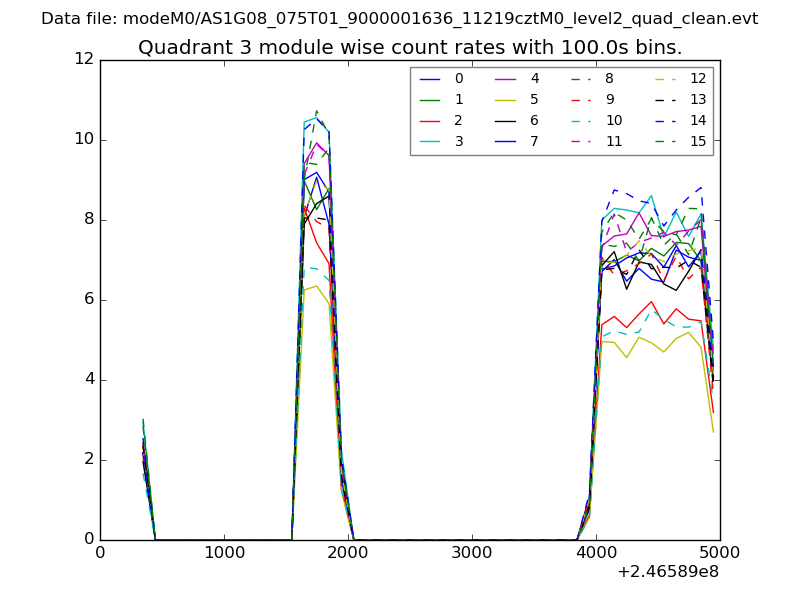
| Module-wise count rates for Quadrant C Data is divided into 100 sec bins |
 |
 |
| Module-wise count rates for Quadrant D Data is divided into 100 sec bins |
 |
 |
| Parameter | Plot |
|---|---|
| CZT HV Monitor | 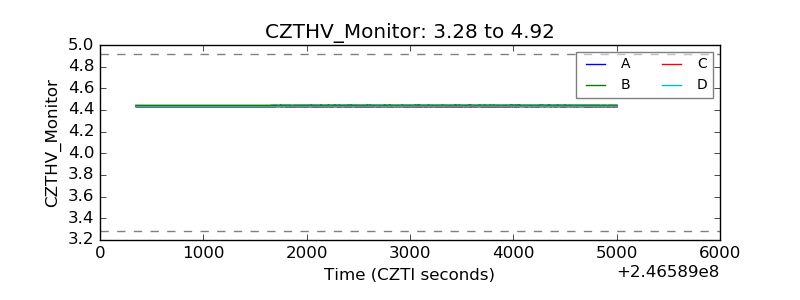 |
| D_VDD | 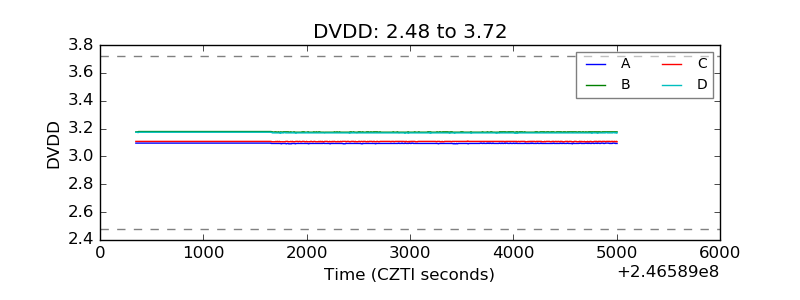 |
| Temperature 1 | 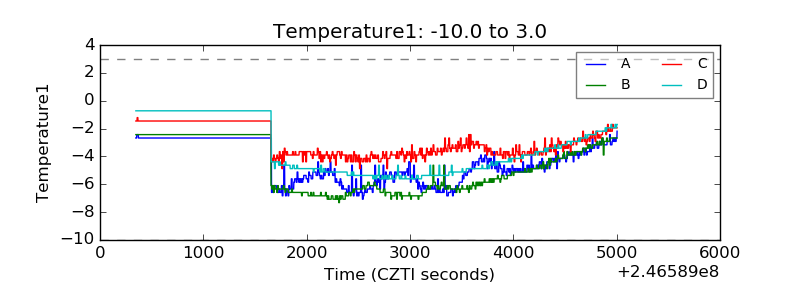 |
| Veto HV Monitor | 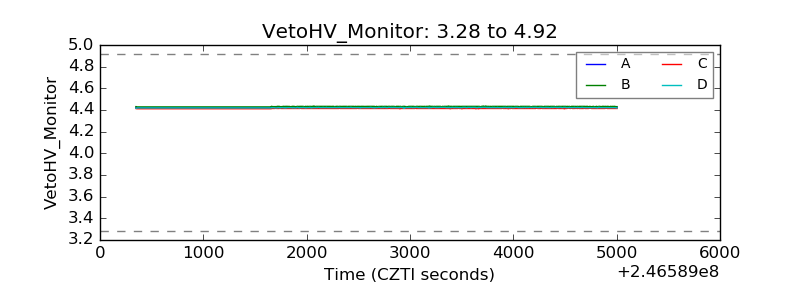 |
| Veto LLD | 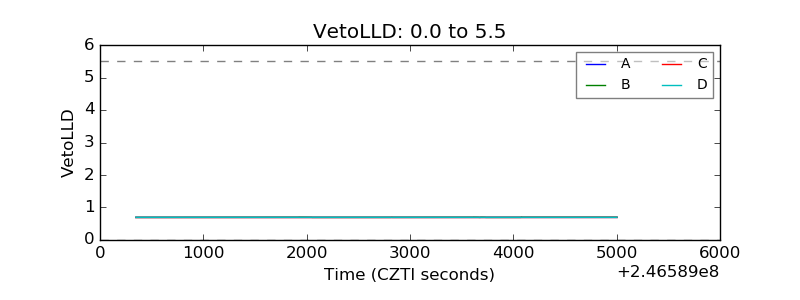 |
| Alpha Counter | 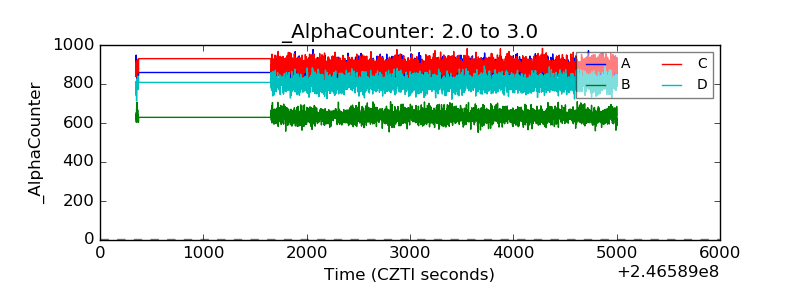 |
| _CPM_Rate | 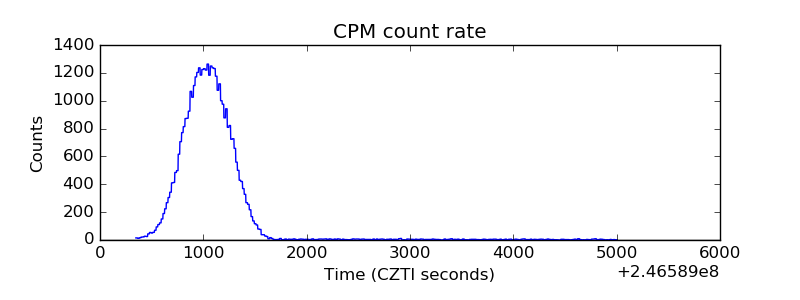 |
| CZT Counter | 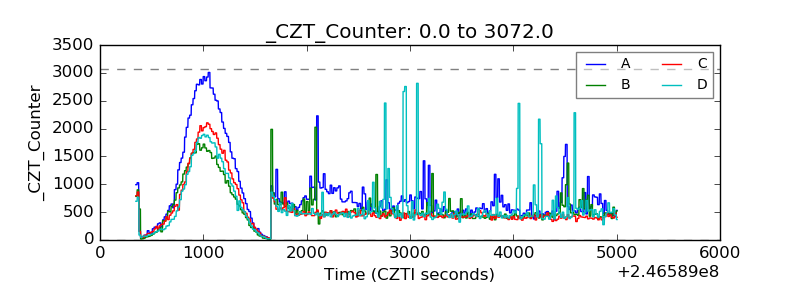 |
| +2.5 Volts monitor |  |
| +5 Volts monitor | 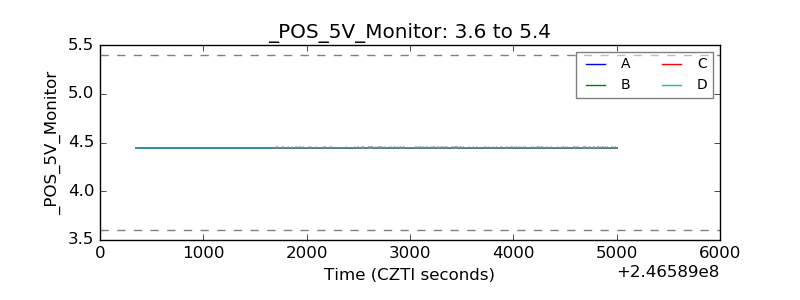 |
| _ROLL_ROT | 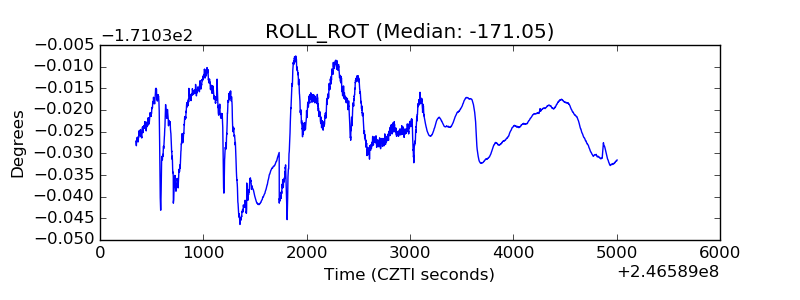 |
| _Roll_DEC | 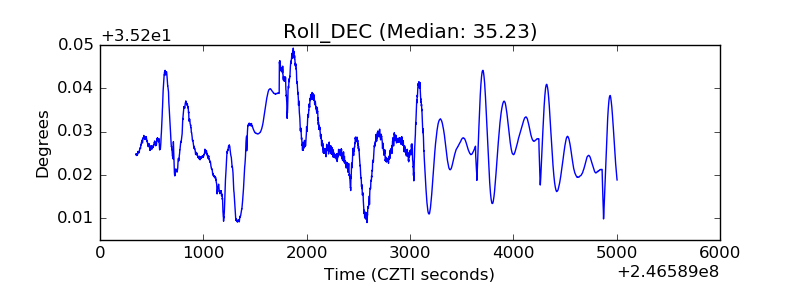 |
| _Roll_RA | 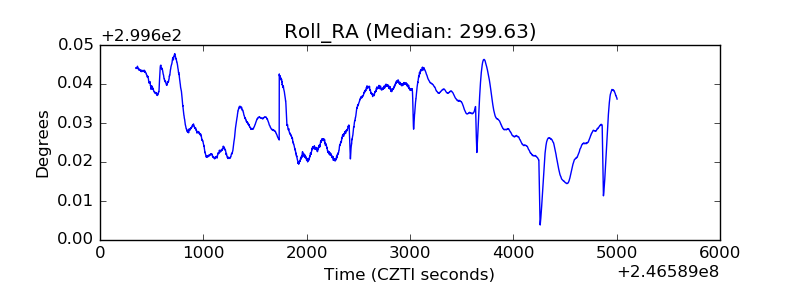 |
| Veto Counter | 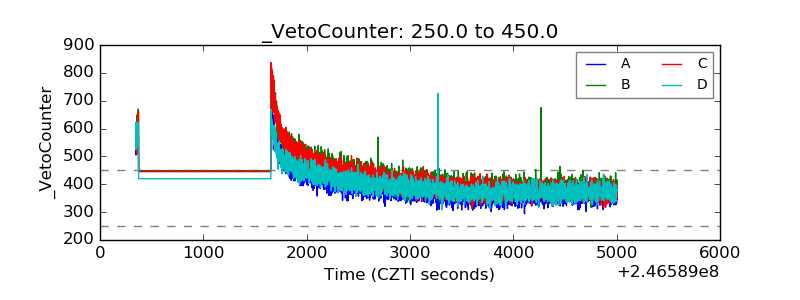 |