| Param | Original file | Final file |
|---|---|---|
| Filename | modeM0/AS1T01_200T01_9000001638cztM0_level2.fits | modeM0/AS1T01_200T01_9000001638cztM0_level2_quad_clean.evt |
| Size (bytes) | 1,019,874,240 | 1,487,937,600 |
| Size | 972.6 MB | 1.4 GB |
| Events in quadrant A | 5,757,316 | 8,992,151 |
| Events in quadrant B | 5,963,672 | 9,886,051 |
| Events in quadrant C | 6,114,248 | 9,686,510 |
| Events in quadrant D | 5,131,376 | 8,593,773 |
| Mode M9 | |||
|---|---|---|---|
| Quadrant | BADHDUFLAG | Total packets | Discarded packets |
| A | 0 | 148 | 0 |
| B | 0 | 148 | 0 |
| C | 0 | 148 | 0 |
| D | 0 | 148 | 0 |
| Mode SS | |||
|---|---|---|---|
| Quadrant | BADHDUFLAG | Total packets | Discarded packets |
| A | 0 | 2352 | 0 |
| B | 0 | 2352 | 0 |
| C | 0 | 2352 | 0 |
| D | 0 | 2352 | 0 |
| Mode M0 | |||
|---|---|---|---|
| Quadrant | BADHDUFLAG | Total packets | Discarded packets |
| A | 0 | 390897 | 0 |
| B | 0 | 271723 | 0 |
| C | 0 | 250416 | 0 |
| D | 0 | 326048 | 0 |
| Quadrant | Total seconds | Saturated seconds | Saturation percentage |
|---|---|---|---|
| A | 115396 | 14485 | 12.552428% |
| B | 115396 | 3704 | 3.209817% |
| C | 115396 | 2191 | 1.898679% |
| D | 115396 | 6551 | 5.676973% |
Noise dominated data is calculated using 1-second bins in cleaned event files. If a bin has >2000 counts, and if more than 50% of those come from <1% of pixels, then it is considered to be noise-dominated and hence unusable.
| Quadrant | # 1 sec bins | Bins with >0 counts | Bins with >2000 counts | High rate bins dominated by noise | Noise dominated (total time) | Noise dominated (detector-on time) | Marked lightcurve |
|---|---|---|---|---|---|---|---|
| A | 130396 | 115188 | 0 | 0 | 0.00% | 0.00% |  |
| B | 130396 | 115392 | 0 | 0 | 0.00% | 0.00% |  |
| C | 130396 | 115368 | 0 | 0 | 0.00% | 0.00% |  |
| D | 130396 | 115234 | 0 | 0 | 0.00% | 0.00% |  |
Top three noisy pixels from each quadrant. If the there are fewer than three noisy pixels in the level2.evt file, extra rows are filled as -1
| Pixel properties | Quadrant properties | ||||||
|---|---|---|---|---|---|---|---|
| Quadrant | DetID | PixID | Counts | Sigma | Mean | Median | Sigma |
| A | 0 | 29 | 5594 | 11.02 | 1499 | 1402 | 380.5 |
| A | 7 | 110 | 4879 | 9.14 | 1499 | 1402 | 380.5 |
| A | 9 | 19 | 4310 | 7.64 | 1499 | 1402 | 380.5 |
| B | 2 | 9 | 5270 | 12.37 | 1573 | 1498 | 305.0 |
| B | 14 | 254 | 4067 | 8.42 | 1573 | 1498 | 305.0 |
| B | 3 | 17 | 4001 | 8.21 | 1573 | 1498 | 305.0 |
| C | 12 | 241 | 4464 | 7.12 | 1615 | 1501 | 416.3 |
| C | 2 | 191 | 4224 | 6.54 | 1615 | 1501 | 416.3 |
| C | 1 | 65 | 4034 | 6.08 | 1615 | 1501 | 416.3 |
| D | 4 | 246 | 4106 | 7.03 | 1465 | 1332 | 394.4 |
| D | 3 | 14 | 3937 | 6.61 | 1465 | 1332 | 394.4 |
| D | 6 | 231 | 3753 | 6.14 | 1465 | 1332 | 394.4 |
Histogram calculated using DETX and DETY for each event in the final _common_clean file
| Quadrant A | 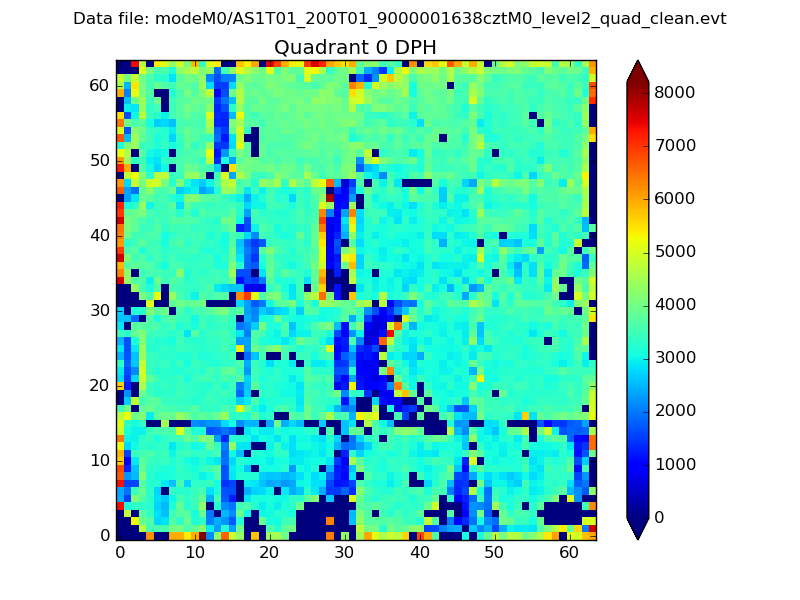 |
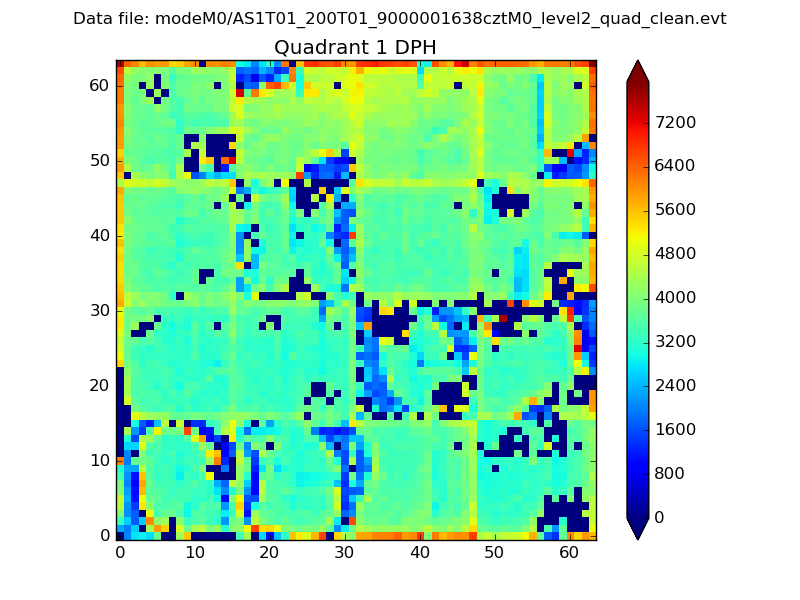 |
Quadrant B |
|---|---|---|---|
| Quadrant D |  |
 |
Quadrant C |
| Plot type | Count rate plots | Images |
|---|---|---|
| Comparison with Poisson distribution Blue bars denote a histogram of data divided into 1 sec bins. Red curve is a Poisson curve with rate = median count rate of data. |
 |
 |
| Quadrant-wise count rates Data is divided into 100 sec bins |
 |
|
| Module-wise count rates for Quadrant A Data is divided into 100 sec bins |
 |
 |
| Module-wise count rates for Quadrant B Data is divided into 100 sec bins |
 |
 |
| Module-wise count rates for Quadrant C Data is divided into 100 sec bins |
 |
 |
| Module-wise count rates for Quadrant D Data is divided into 100 sec bins |
 |
 |
| Parameter | Plot |
|---|---|
| CZT HV Monitor |  |
| D_VDD |  |
| Temperature 1 |  |
| Veto HV Monitor |  |
| Veto LLD |  |
| Alpha Counter |  |
| _CPM_Rate |  |
| CZT Counter |  |
| +2.5 Volts monitor |  |
| +5 Volts monitor |  |
| _ROLL_ROT |  |
| _Roll_DEC |  |
| _Roll_RA |  |
| Veto Counter |  |