| Param | Original file | Final file |
|---|---|---|
| Filename | modeM0/AS1T01_200T01_9000001638_11219cztM0_level2.evt | modeM0/AS1T01_200T01_9000001638_11219cztM0_level2_quad_clean.evt |
| Size (bytes) | 257,106,240 | 54,267,840 |
| Size | 245.2 MB | 51.8 MB |
| Events in quadrant A | 2,672,762 | 340,513 |
| Events in quadrant B | 1,694,103 | 369,338 |
| Events in quadrant C | 1,363,325 | 374,571 |
| Events in quadrant D | 1,857,020 | 351,131 |
| Mode M9 | |||
|---|---|---|---|
| Quadrant | BADHDUFLAG | Total packets | Discarded packets |
| A | 0 | 10 | 0 |
| B | 0 | 10 | 0 |
| C | 0 | 10 | 0 |
| D | 0 | 10 | 0 |
| Mode SS | |||
|---|---|---|---|
| Quadrant | BADHDUFLAG | Total packets | Discarded packets |
| A | 0 | 60 | 0 |
| B | 0 | 60 | 0 |
| C | 0 | 60 | 0 |
| D | 0 | 60 | 0 |
| Mode M0 | |||
|---|---|---|---|
| Quadrant | BADHDUFLAG | Total packets | Discarded packets |
| A | 0 | 9937 | 2 |
| B | 0 | 6936 | 1 |
| C | 0 | 6042 | 1 |
| D | 0 | 7450 | 1 |
| Quadrant | Total seconds | Saturated seconds | Saturation percentage |
|---|---|---|---|
| A | 2903 | 379 | 13.055460% |
| B | 2903 | 135 | 4.650362% |
| C | 2903 | 20 | 0.688942% |
| D | 2903 | 108 | 3.720289% |
Noise dominated data is calculated using 1-second bins in cleaned event files. If a bin has >2000 counts, and if more than 50% of those come from <1% of pixels, then it is considered to be noise-dominated and hence unusable.
| Quadrant | # 1 sec bins | Bins with >0 counts | Bins with >2000 counts | High rate bins dominated by noise | Noise dominated (total time) | Noise dominated (detector-on time) | Marked lightcurve |
|---|---|---|---|---|---|---|---|
| A | 3968 | 2904 | 238 | 238 | 6.00% | 8.20% |  |
| B | 3968 | 2904 | 39 | 39 | 0.98% | 1.34% | 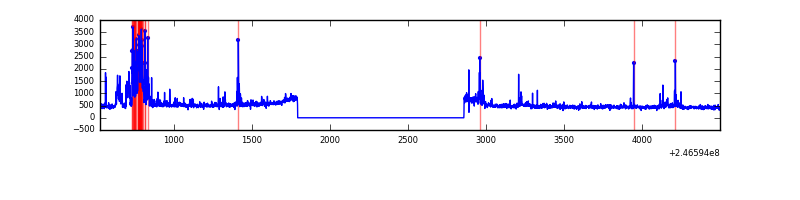 |
| C | 3968 | 2904 | 0 | 0 | 0.00% | 0.00% | 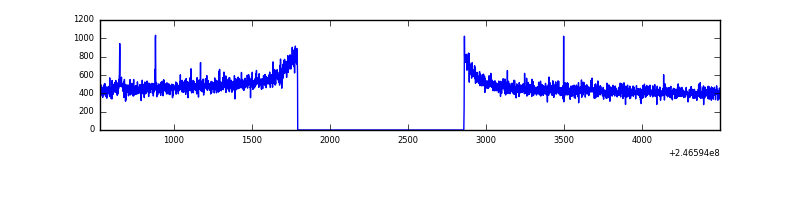 |
| D | 3968 | 2904 | 56 | 56 | 1.41% | 1.93% | 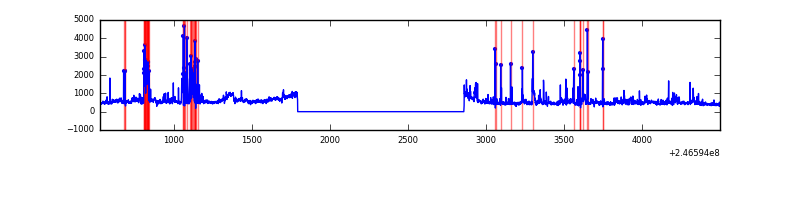 |
Top three noisy pixels from each quadrant. If the there are fewer than three noisy pixels in the level2.evt file, extra rows are filled as -1
| Pixel properties | Quadrant properties | ||||||
|---|---|---|---|---|---|---|---|
| Quadrant | DetID | PixID | Counts | Sigma | Mean | Median | Sigma |
| A | 8 | 5 | 1192801 | 17373.95 | 331 | 322 | 68.6 |
| A | 14 | 238 | 79379 | 1151.83 | 331 | 322 | 68.6 |
| A | 8 | 15 | 40873 | 590.81 | 331 | 322 | 68.6 |
| B | 4 | 239 | 258947 | 3857.05 | 351 | 342 | 67.0 |
| B | 15 | 204 | 18527 | 271.23 | 351 | 342 | 67.0 |
| B | 4 | 80 | 17374 | 254.03 | 351 | 342 | 67.0 |
| C | 4 | 254 | 9633 | 114.06 | 347 | 348 | 81.4 |
| C | 13 | 61 | 2462 | 25.97 | 347 | 348 | 81.4 |
| C | 14 | 67 | 938 | 7.25 | 347 | 348 | 81.4 |
| D | 1 | 52 | 193825 | 2381.04 | 336 | 326 | 81.3 |
| D | 8 | 195 | 135348 | 1661.47 | 336 | 326 | 81.3 |
| D | 10 | 253 | 86590 | 1061.49 | 336 | 326 | 81.3 |
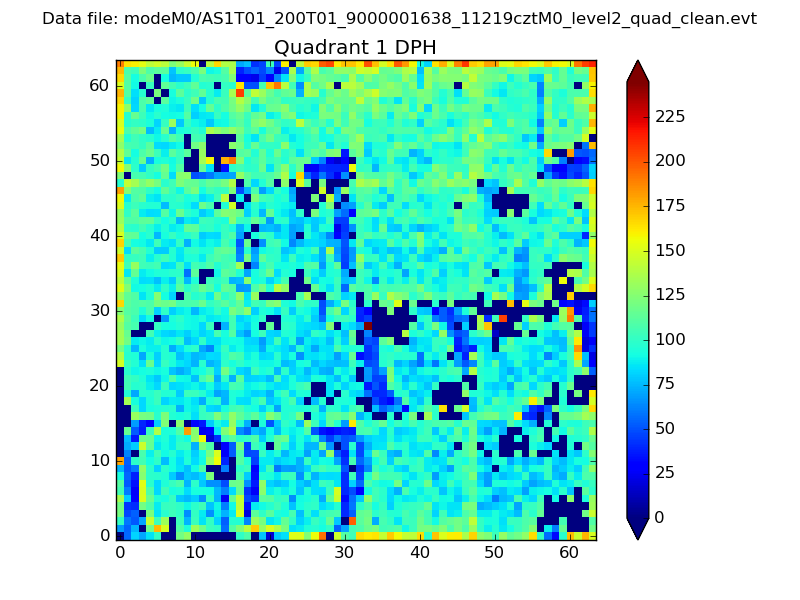
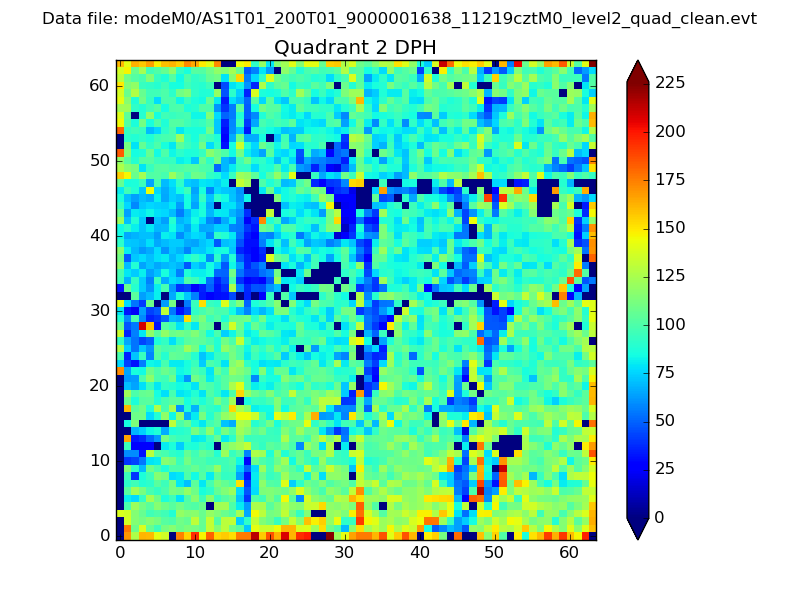
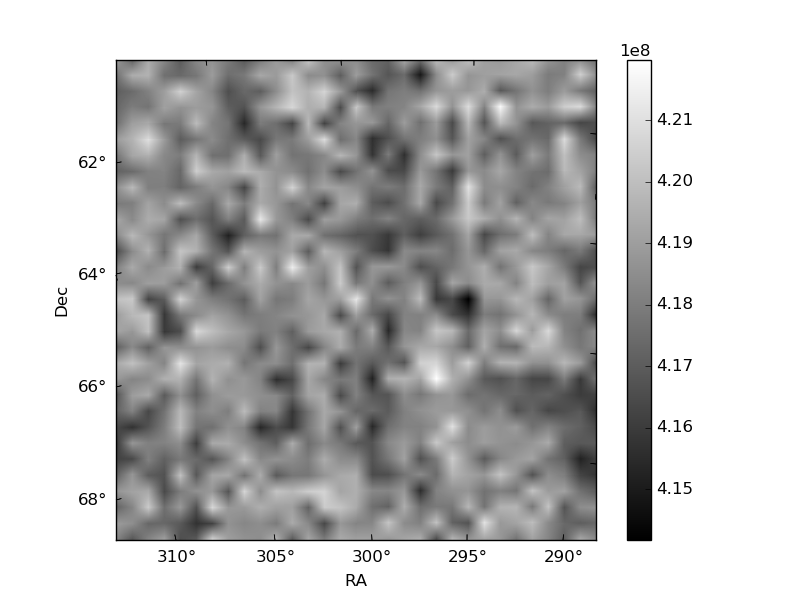
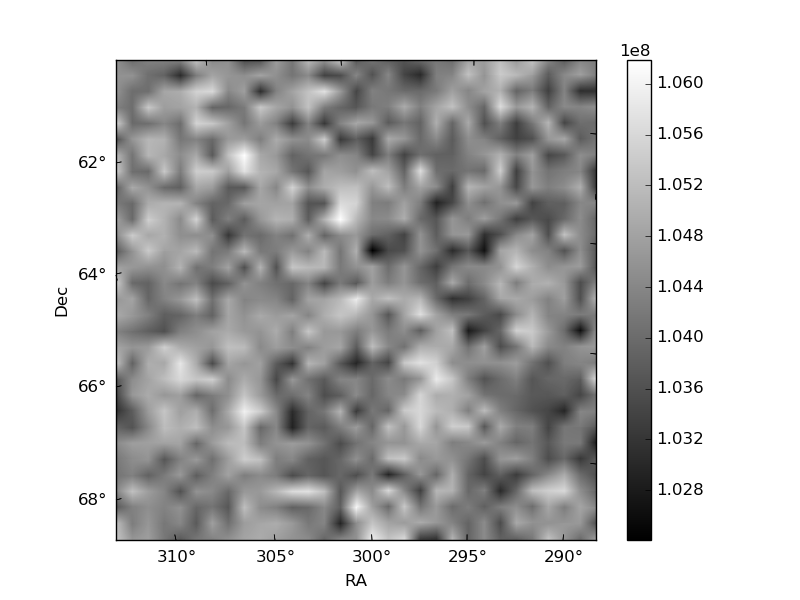
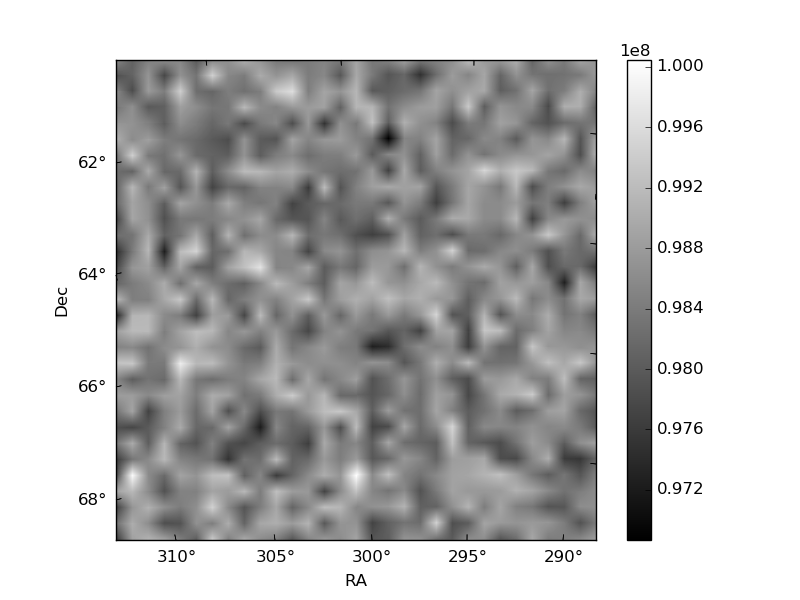
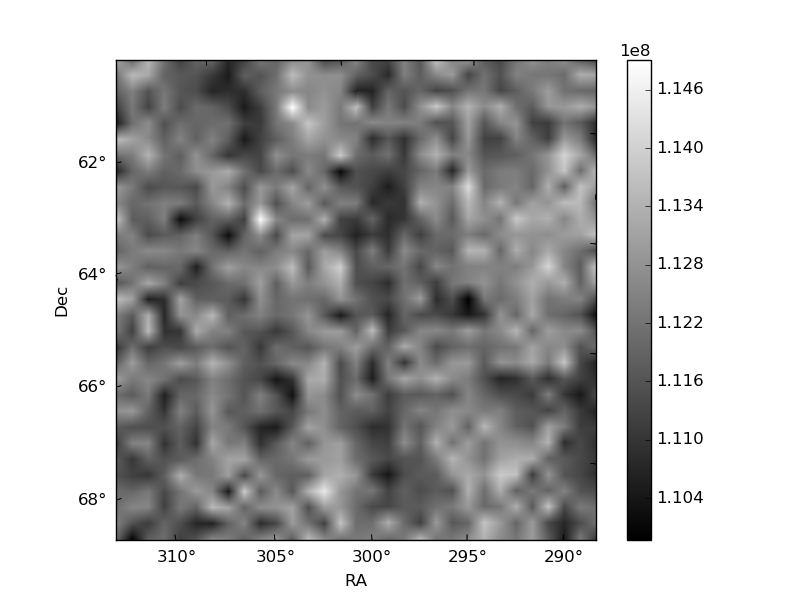
Histogram calculated using DETX and DETY for each event in the final _common_clean file
| Quadrant A | 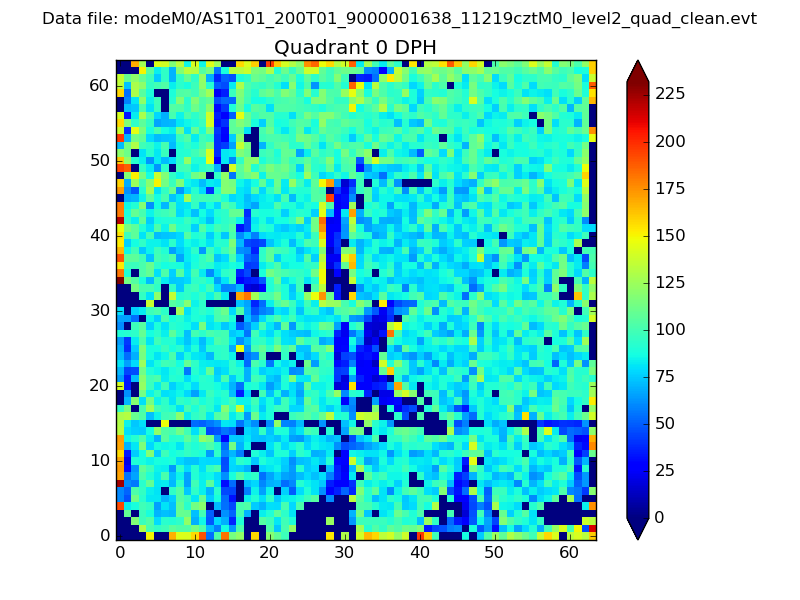 |
 |
Quadrant B |
|---|---|---|---|
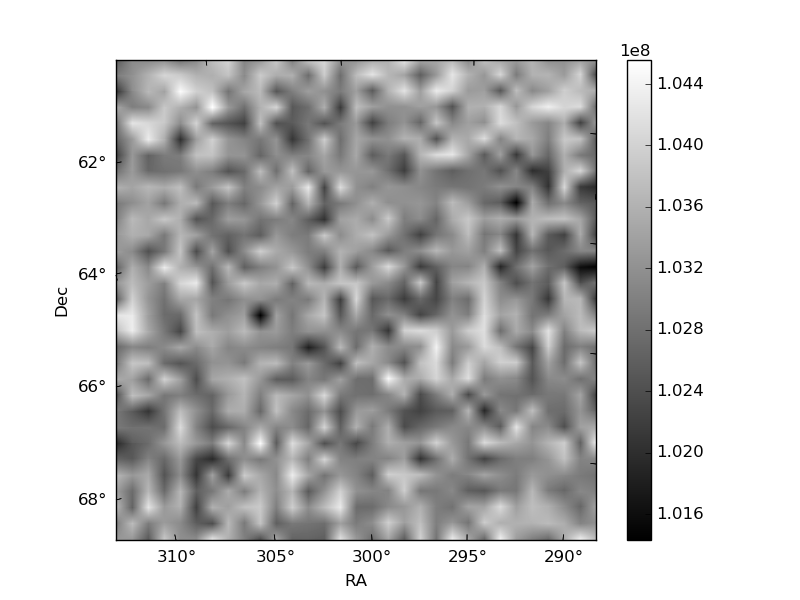
| Quadrant D | 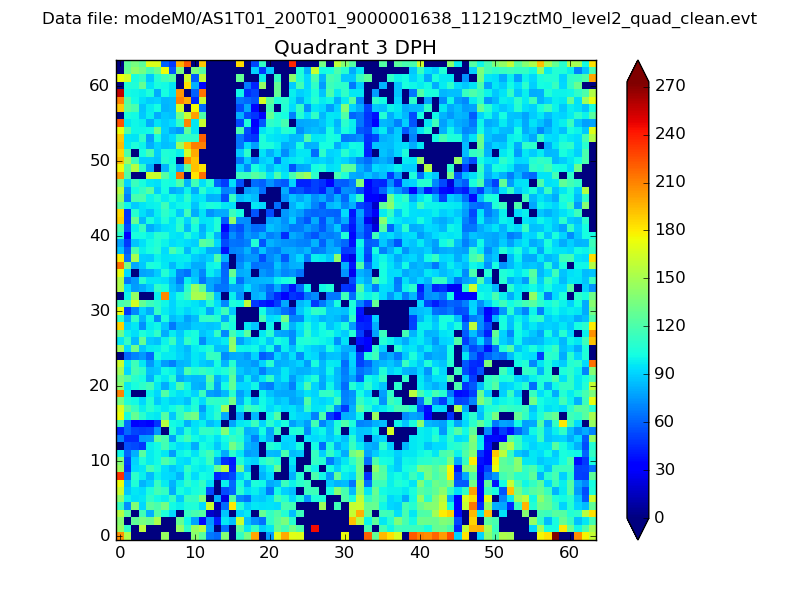 |
 |
Quadrant C |
| Plot type | Count rate plots | Images |
|---|---|---|
| Comparison with Poisson distribution Blue bars denote a histogram of data divided into 1 sec bins. Red curve is a Poisson curve with rate = median count rate of data. |
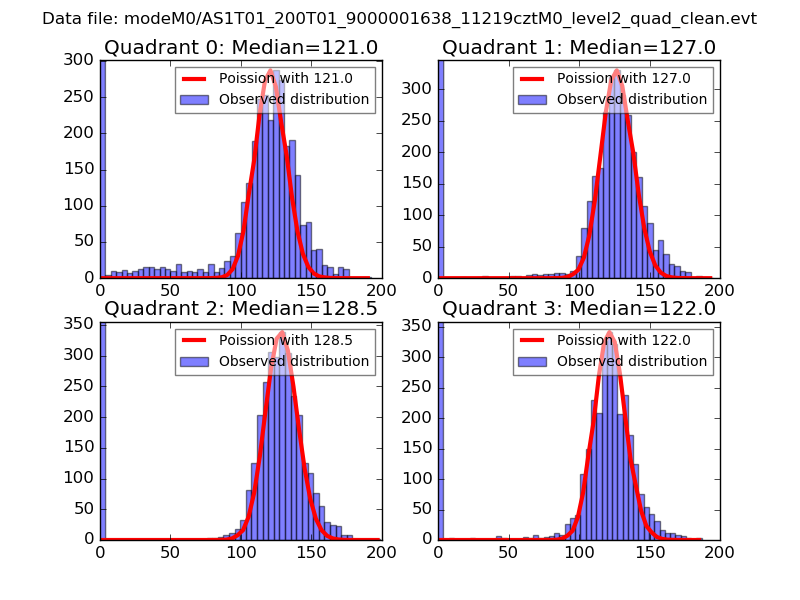 |
 |
| Quadrant-wise count rates Data is divided into 100 sec bins |
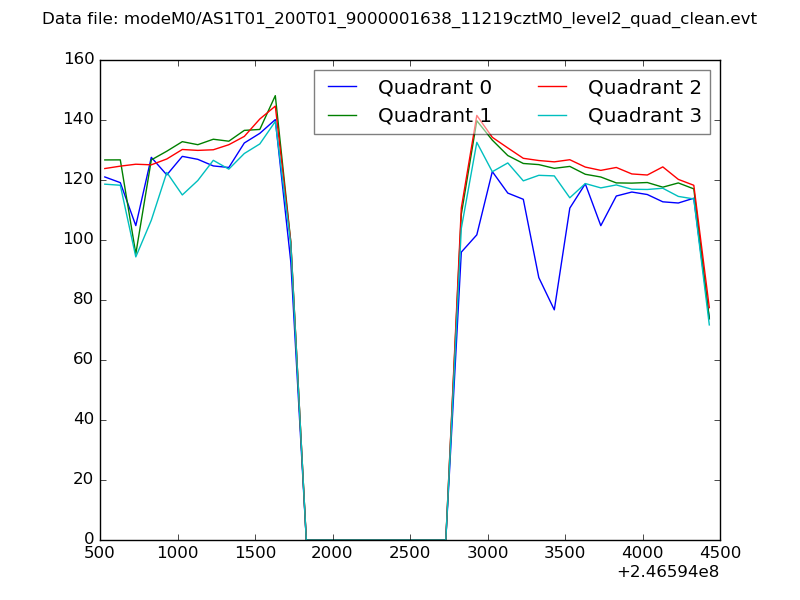 |
|
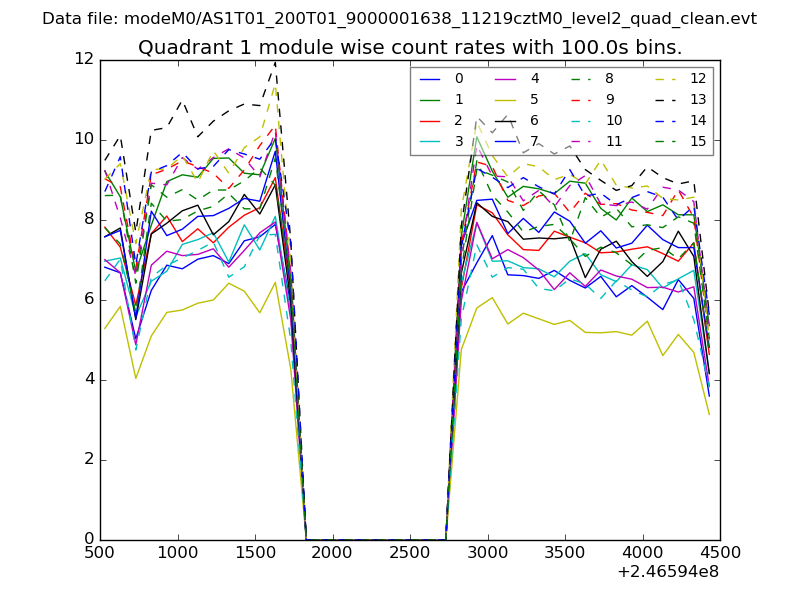
| Module-wise count rates for Quadrant A Data is divided into 100 sec bins |
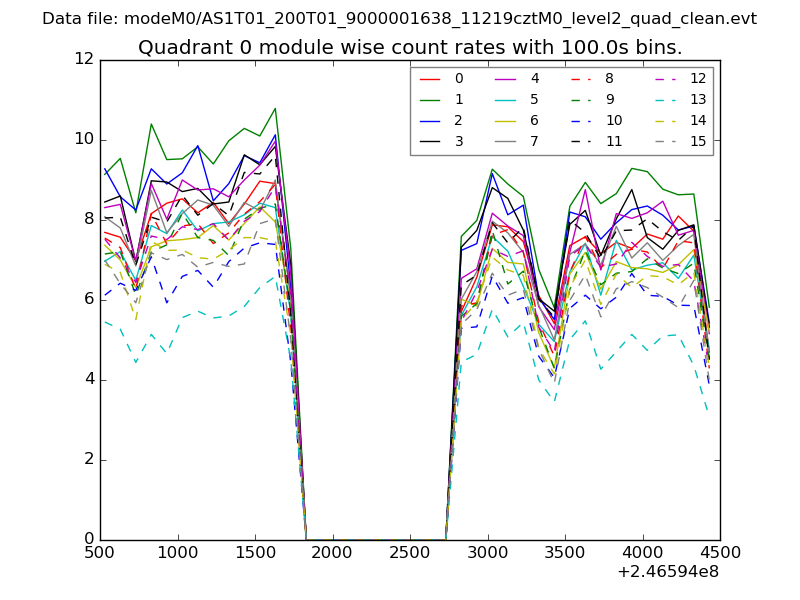 |
 |
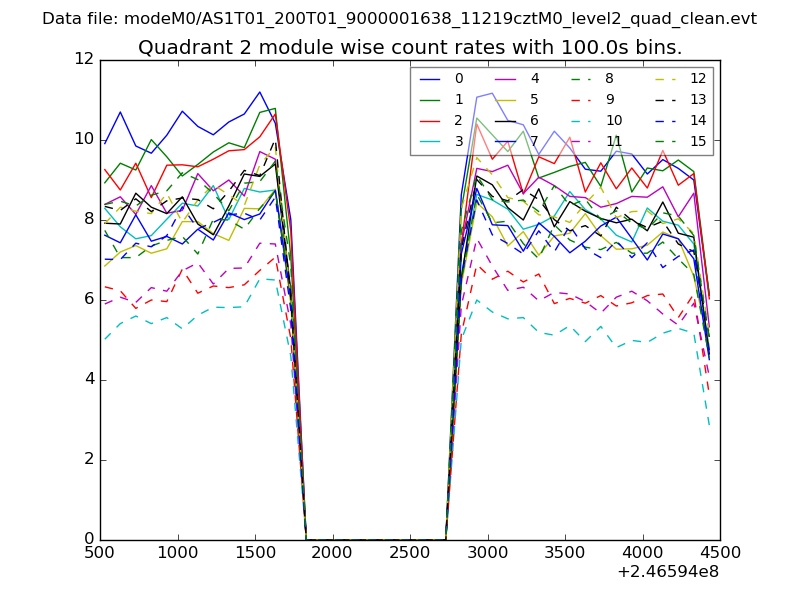
| Module-wise count rates for Quadrant B Data is divided into 100 sec bins |
 |
 |
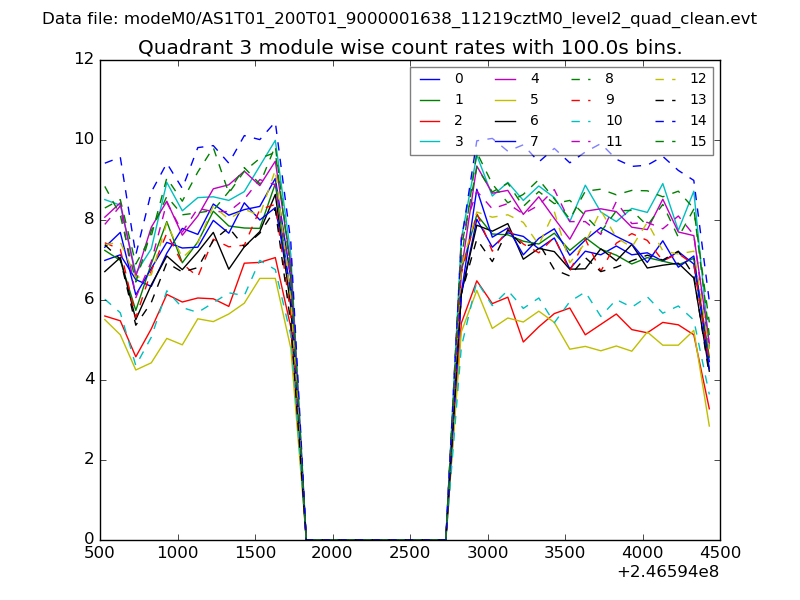
| Module-wise count rates for Quadrant C Data is divided into 100 sec bins |
 |
 |
| Module-wise count rates for Quadrant D Data is divided into 100 sec bins |
 |
 |
| Parameter | Plot |
|---|---|
| CZT HV Monitor | 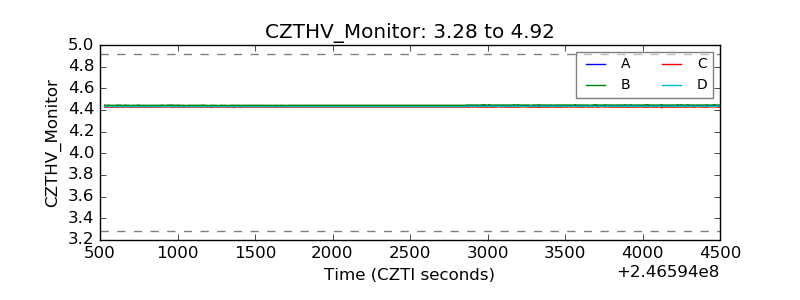 |
| D_VDD | 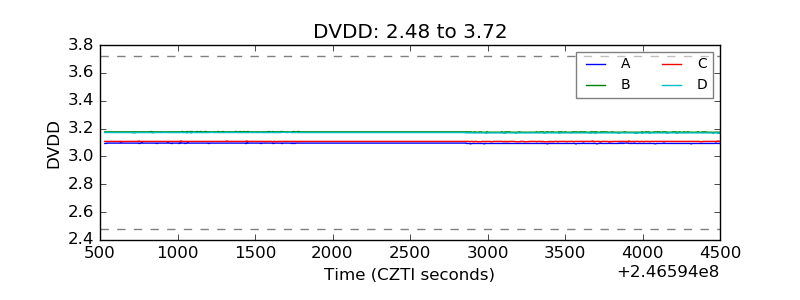 |
| Temperature 1 | 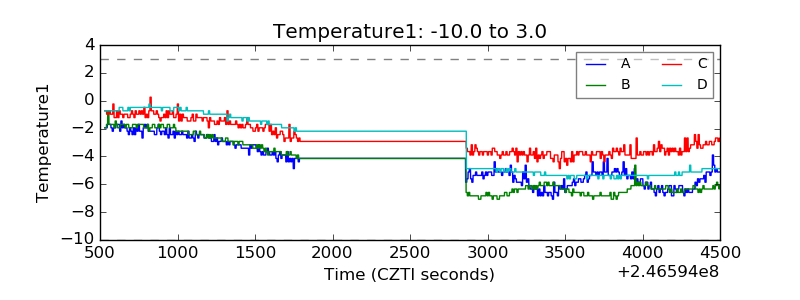 |
| Veto HV Monitor | 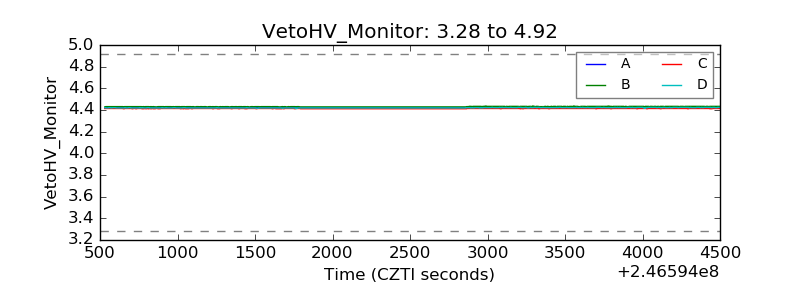 |
| Veto LLD | 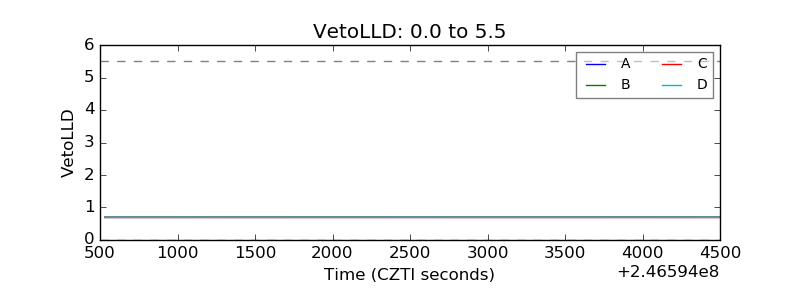 |
| Alpha Counter | 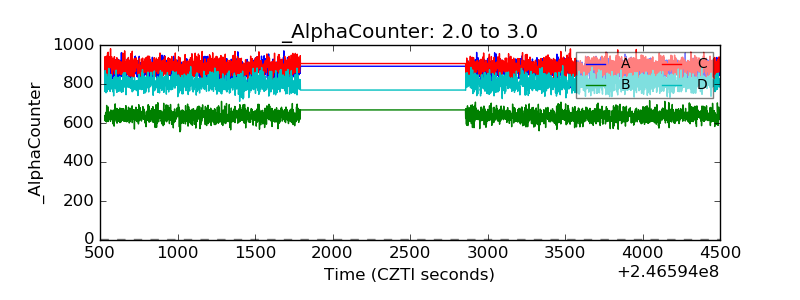 |
| _CPM_Rate | 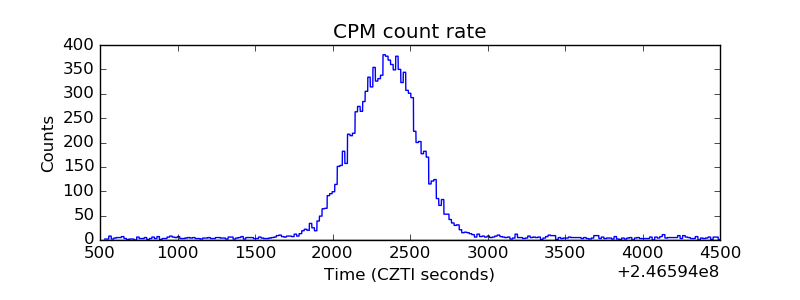 |
| CZT Counter | 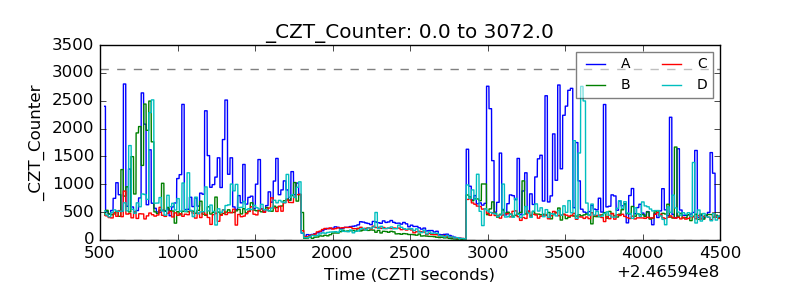 |
| +2.5 Volts monitor |  |
| +5 Volts monitor |  |
| _ROLL_ROT | 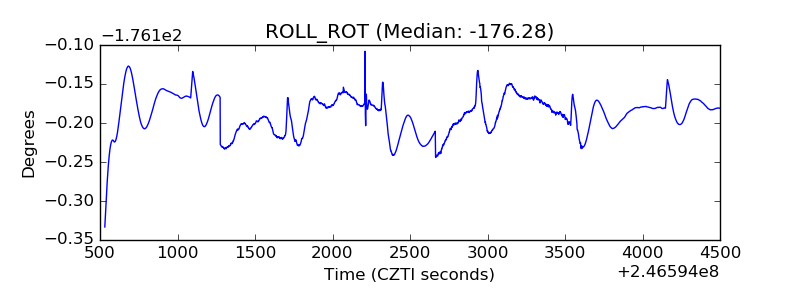 |
| _Roll_DEC | 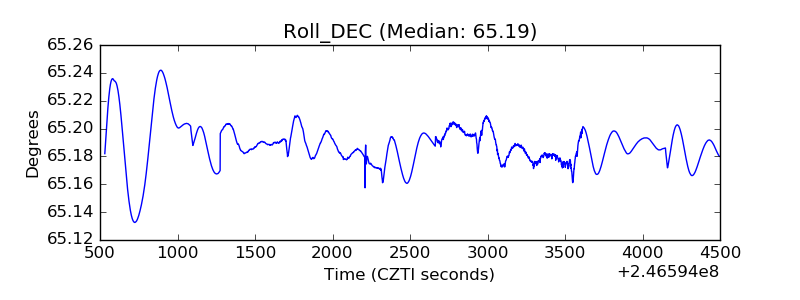 |
| _Roll_RA | 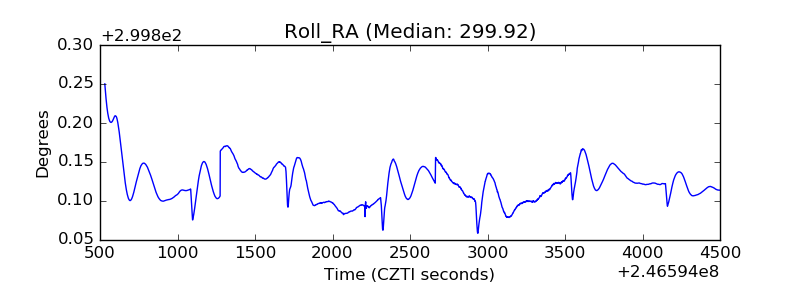 |
| Veto Counter | 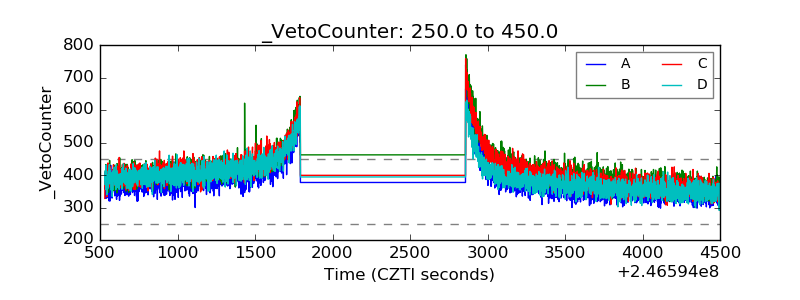 |