| Param | Original file | Final file |
|---|---|---|
| Filename | modeM0/AS1T01_200T01_9000001638_11220cztM0_level2.evt | modeM0/AS1T01_200T01_9000001638_11220cztM0_level2_quad_clean.evt |
| Size (bytes) | 603,492,480 | 127,431,360 |
| Size | 575.5 MB | 121.5 MB |
| Events in quadrant A | 6,342,079 | 800,650 |
| Events in quadrant B | 3,883,369 | 865,830 |
| Events in quadrant C | 3,088,780 | 878,114 |
| Events in quadrant D | 4,484,618 | 823,364 |
| Mode M9 | |||
|---|---|---|---|
| Quadrant | BADHDUFLAG | Total packets | Discarded packets |
| A | 0 | 12 | 0 |
| B | 0 | 12 | 0 |
| C | 0 | 12 | 0 |
| D | 0 | 13 | 0 |
| Mode SS | |||
|---|---|---|---|
| Quadrant | BADHDUFLAG | Total packets | Discarded packets |
| A | 0 | 144 | 0 |
| B | 0 | 144 | 0 |
| C | 0 | 144 | 0 |
| D | 0 | 144 | 0 |
| Mode M0 | |||
|---|---|---|---|
| Quadrant | BADHDUFLAG | Total packets | Discarded packets |
| A | 0 | 23647 | 3 |
| B | 0 | 16369 | 2 |
| C | 0 | 14420 | 2 |
| D | 0 | 18212 | 2 |
| Quadrant | Total seconds | Saturated seconds | Saturation percentage |
|---|---|---|---|
| A | 7050 | 907 | 12.865248% |
| B | 7050 | 209 | 2.964539% |
| C | 7050 | 50 | 0.709220% |
| D | 7050 | 267 | 3.787234% |
Noise dominated data is calculated using 1-second bins in cleaned event files. If a bin has >2000 counts, and if more than 50% of those come from <1% of pixels, then it is considered to be noise-dominated and hence unusable.
| Quadrant | # 1 sec bins | Bins with >0 counts | Bins with >2000 counts | High rate bins dominated by noise | Noise dominated (total time) | Noise dominated (detector-on time) | Marked lightcurve |
|---|---|---|---|---|---|---|---|
| A | 7760 | 7052 | 590 | 590 | 7.60% | 8.37% | 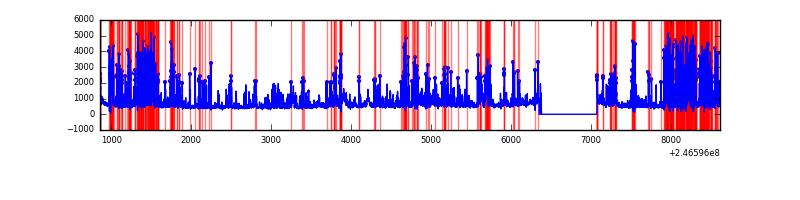 |
| B | 7760 | 7052 | 60 | 60 | 0.77% | 0.85% | 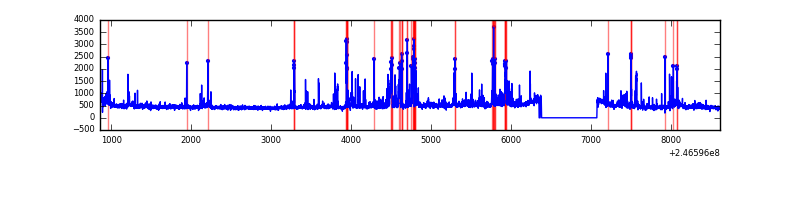 |
| C | 7760 | 7052 | 0 | 0 | 0.00% | 0.00% | 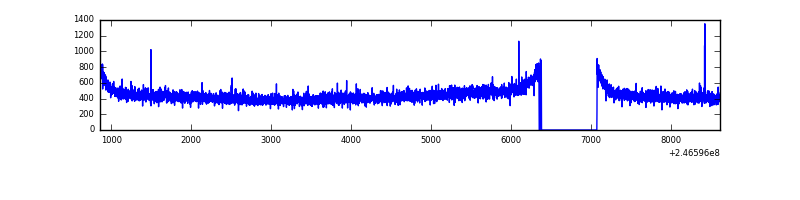 |
| D | 7760 | 7052 | 181 | 181 | 2.33% | 2.57% | 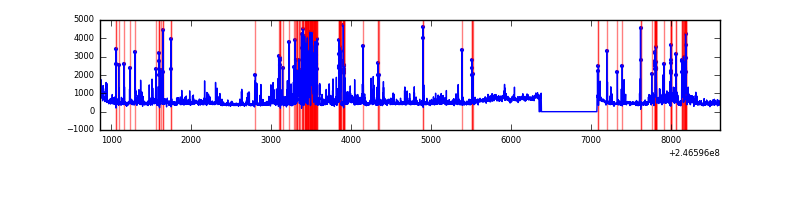 |
Top three noisy pixels from each quadrant. If the there are fewer than three noisy pixels in the level2.evt file, extra rows are filled as -1
| Pixel properties | Quadrant properties | ||||||
|---|---|---|---|---|---|---|---|
| Quadrant | DetID | PixID | Counts | Sigma | Mean | Median | Sigma |
| A | 8 | 5 | 3163589 | 20640.37 | 759 | 745 | 153.2 |
| A | 15 | 174 | 66762 | 430.82 | 759 | 745 | 153.2 |
| A | 1 | 162 | 40952 | 262.39 | 759 | 745 | 153.2 |
| B | 4 | 239 | 553468 | 3633.28 | 807 | 787 | 152.1 |
| B | 15 | 204 | 67881 | 441.07 | 807 | 787 | 152.1 |
| B | 4 | 81 | 37882 | 243.86 | 807 | 787 | 152.1 |
| C | 4 | 254 | 7382 | 36.14 | 789 | 791 | 182.4 |
| C | 13 | 61 | 5812 | 27.53 | 789 | 791 | 182.4 |
| C | 12 | 4 | 3796 | 16.47 | 789 | 791 | 182.4 |
| D | 1 | 52 | 546433 | 2975.51 | 770 | 748 | 183.4 |
| D | 13 | 152 | 235508 | 1280.1 | 770 | 748 | 183.4 |
| D | 2 | 14 | 196514 | 1067.47 | 770 | 748 | 183.4 |
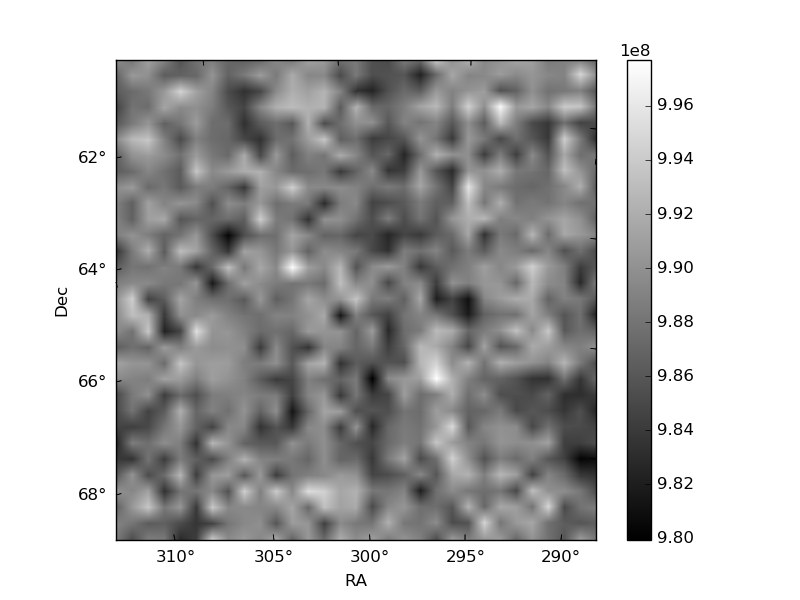
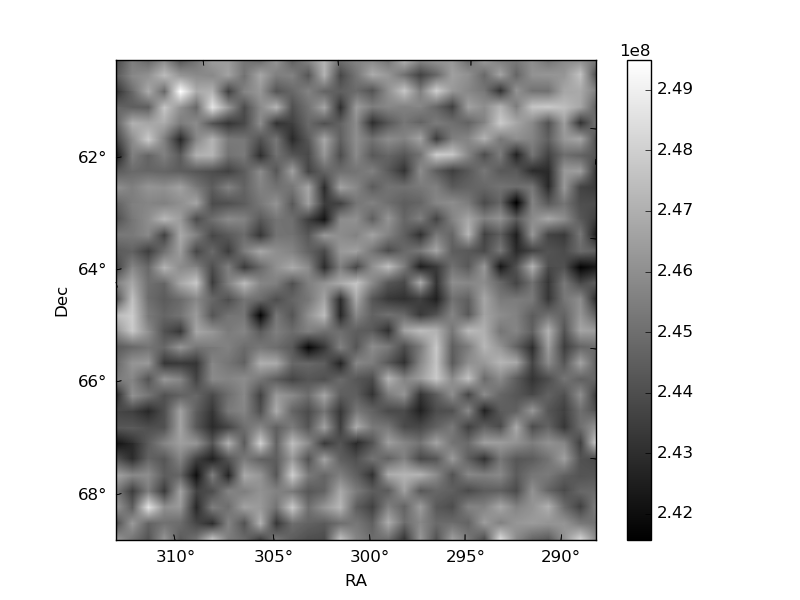
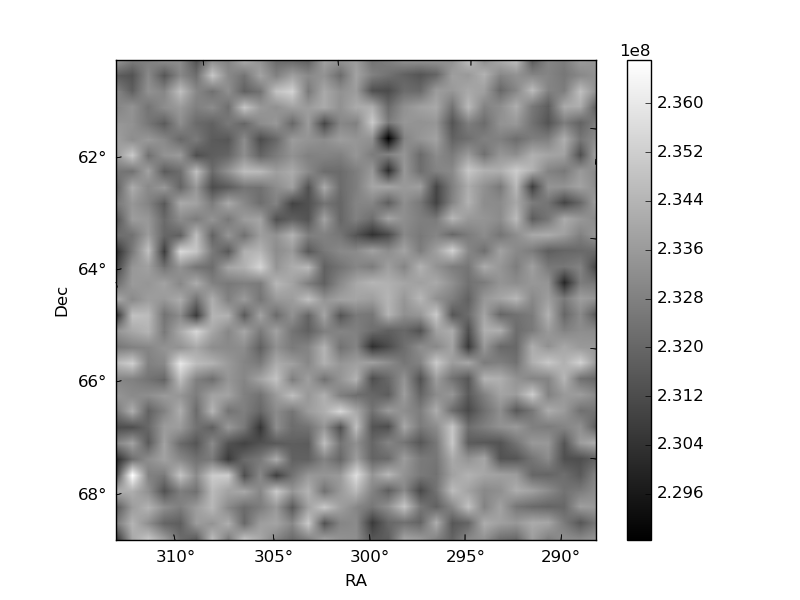
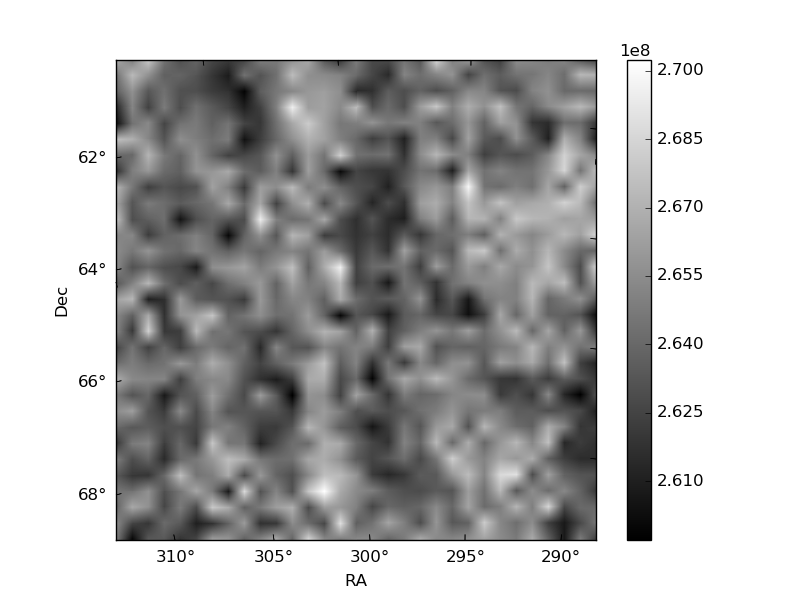
Histogram calculated using DETX and DETY for each event in the final _common_clean file
| Quadrant A | 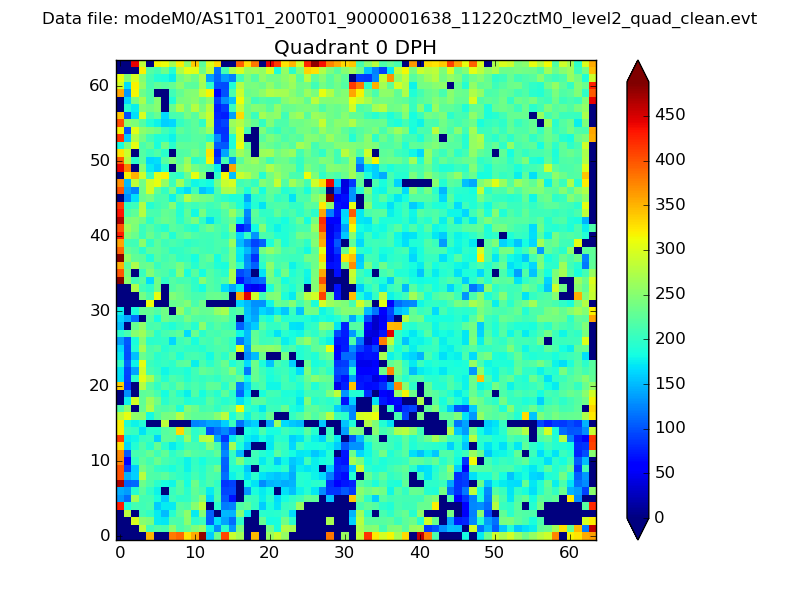 |
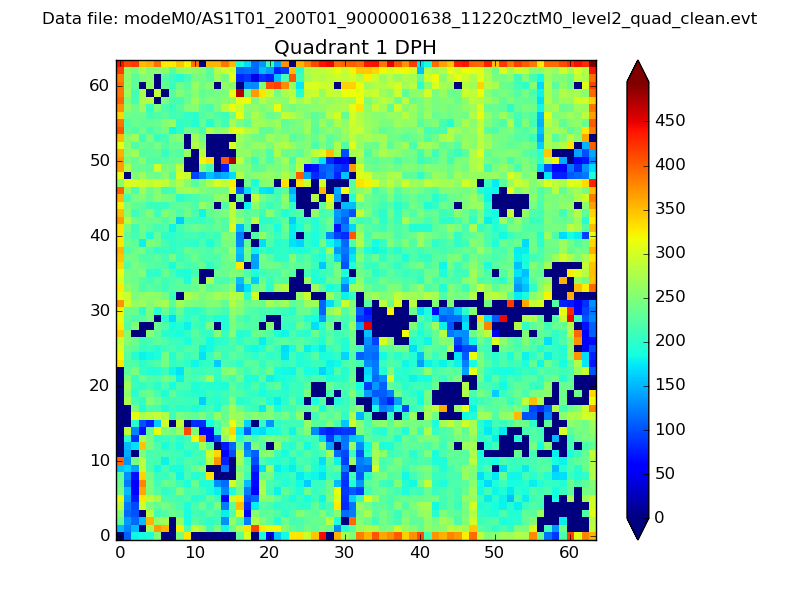 |
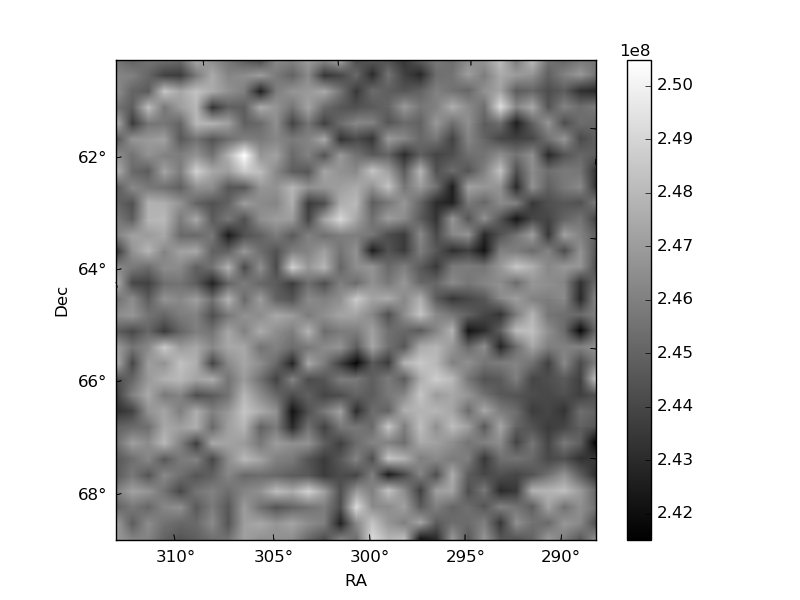
Quadrant B |
|---|---|---|---|
| Quadrant D | 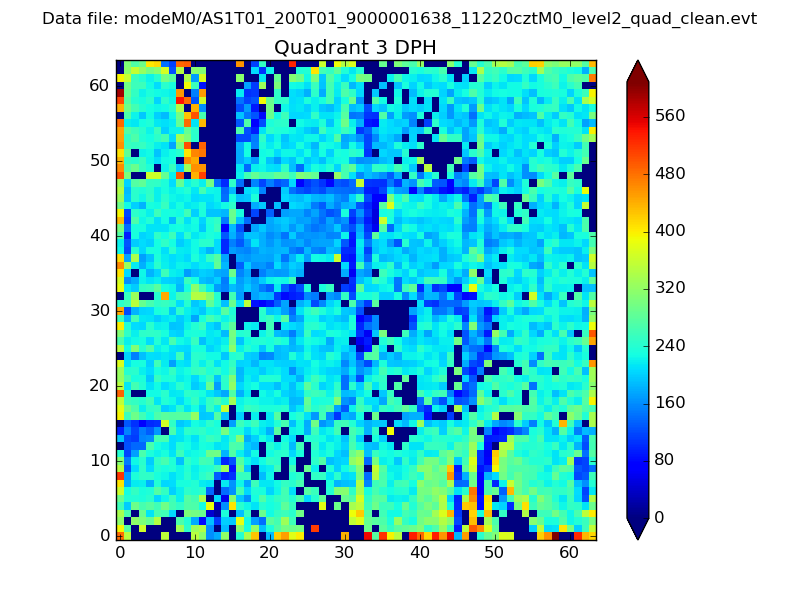 |
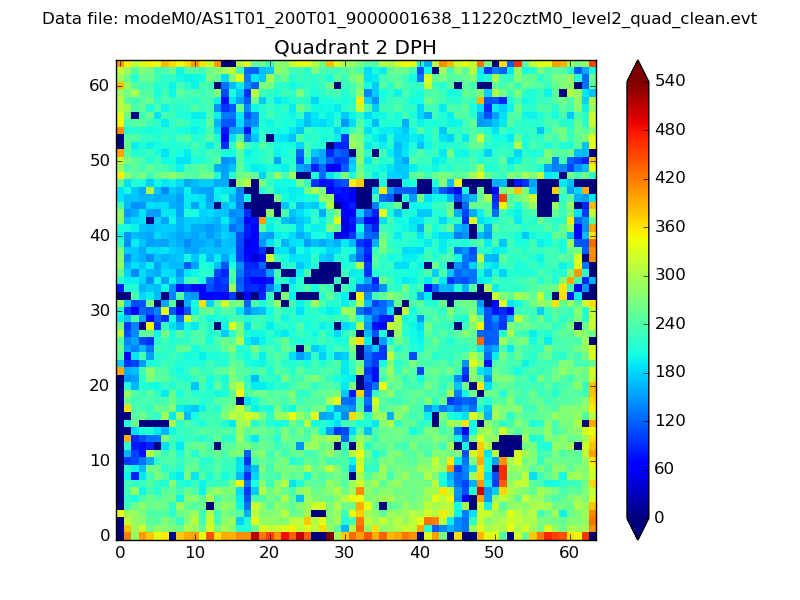 |
Quadrant C |
| Plot type | Count rate plots | Images |
|---|---|---|
| Comparison with Poisson distribution Blue bars denote a histogram of data divided into 1 sec bins. Red curve is a Poisson curve with rate = median count rate of data. |
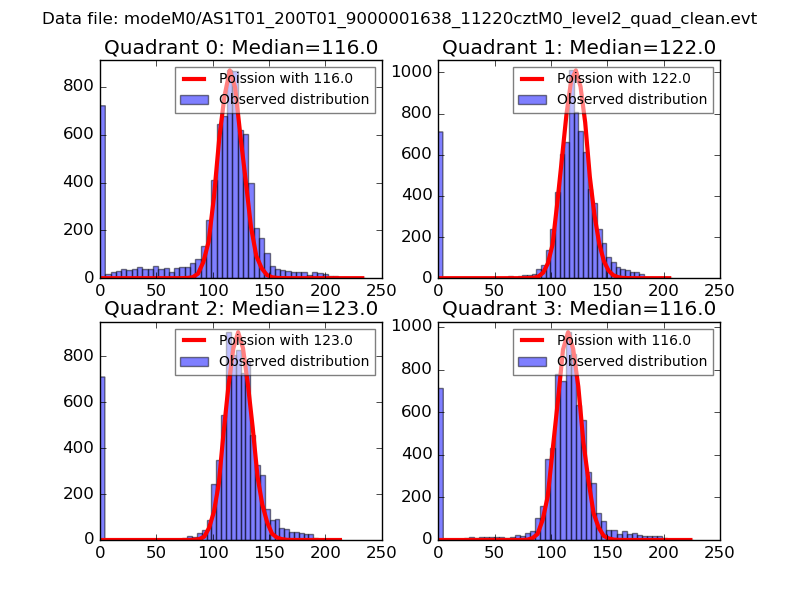 |
 |
| Quadrant-wise count rates Data is divided into 100 sec bins |
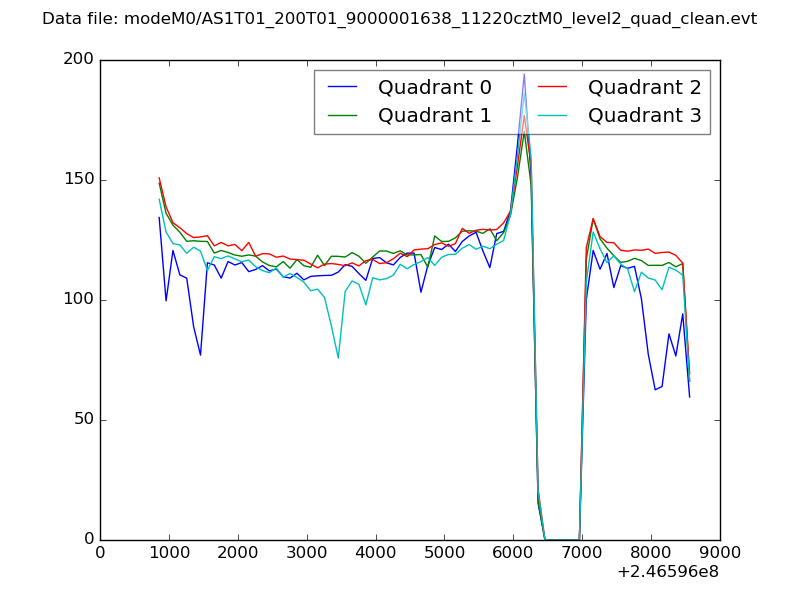 |
|
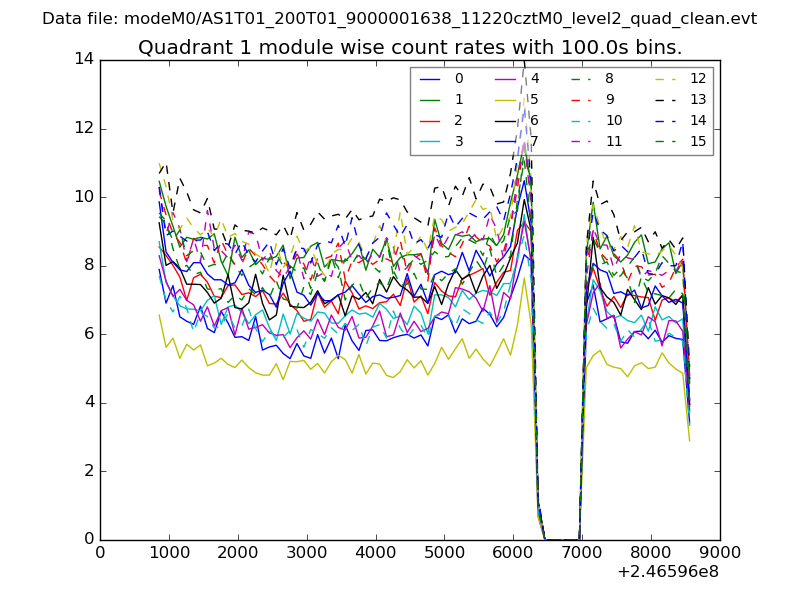
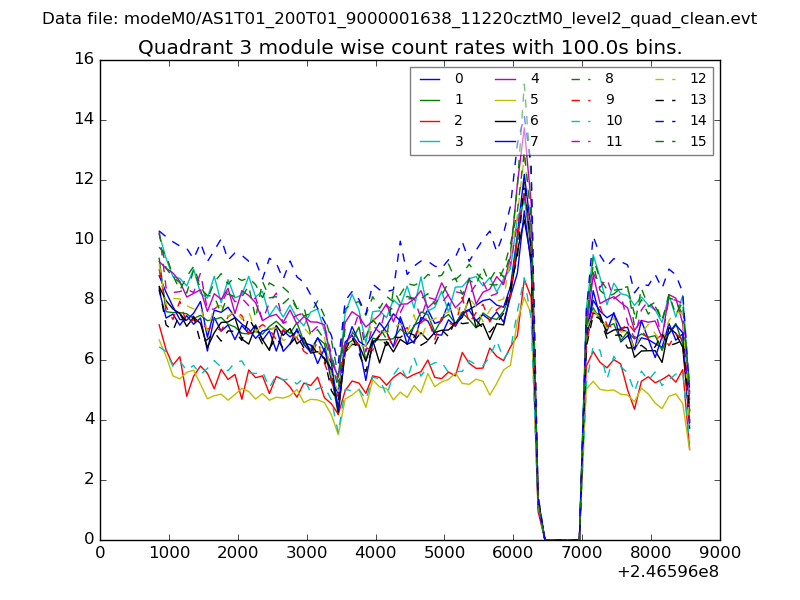
| Module-wise count rates for Quadrant A Data is divided into 100 sec bins |
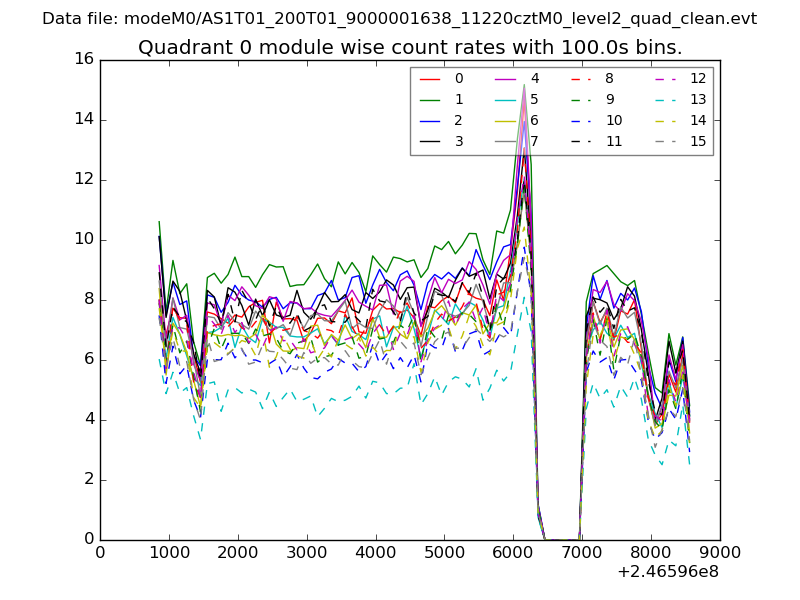 |
 |
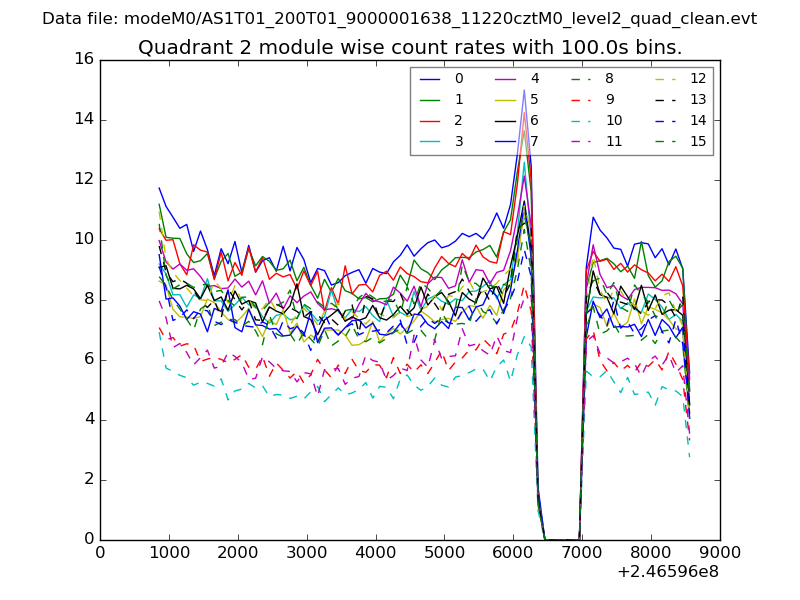
| Module-wise count rates for Quadrant B Data is divided into 100 sec bins |
 |
 |
| Module-wise count rates for Quadrant C Data is divided into 100 sec bins |
 |
 |
| Module-wise count rates for Quadrant D Data is divided into 100 sec bins |
 |
 |
| Parameter | Plot |
|---|---|
| CZT HV Monitor | 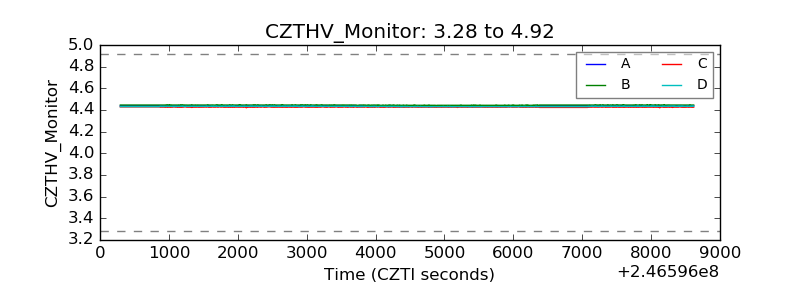 |
| D_VDD | 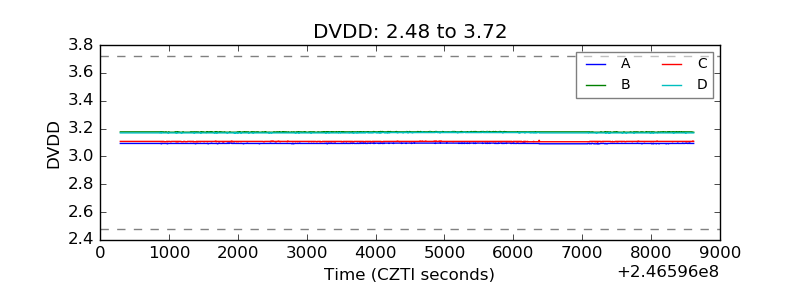 |
| Temperature 1 | 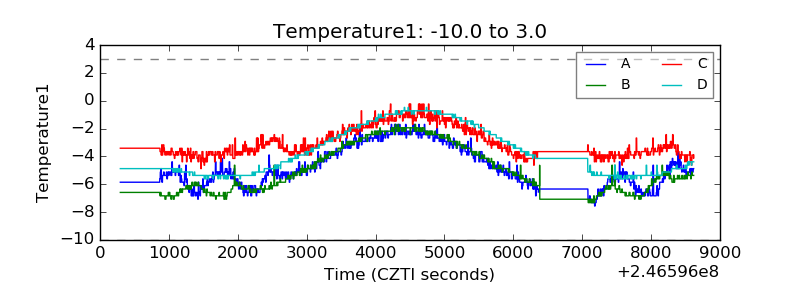 |
| Veto HV Monitor | 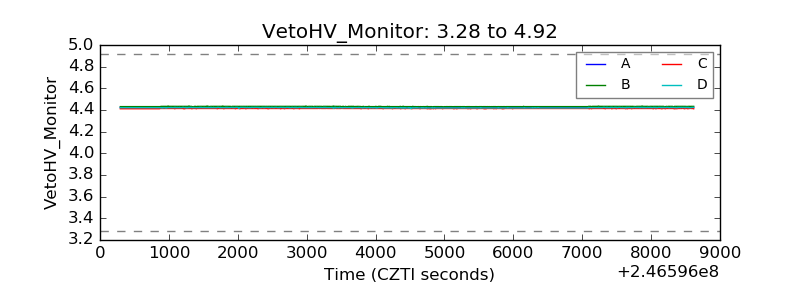 |
| Veto LLD | 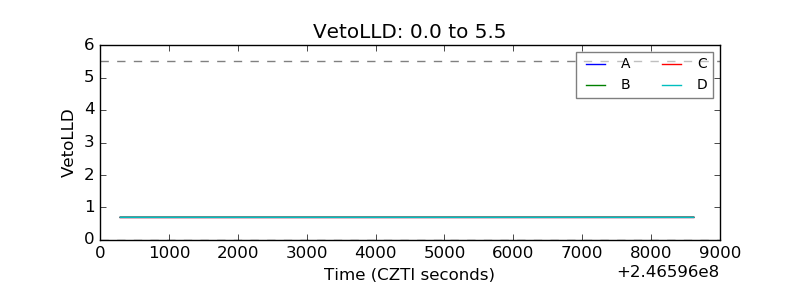 |
| Alpha Counter | 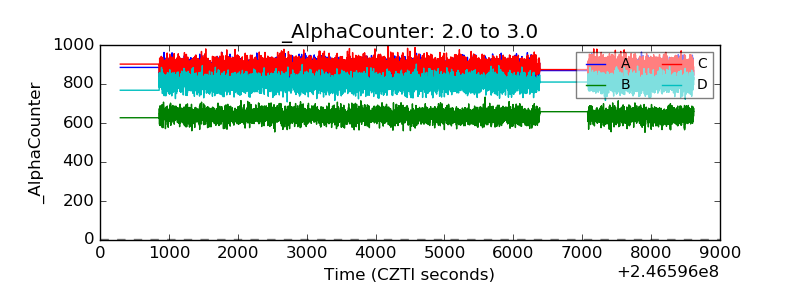 |
| _CPM_Rate | 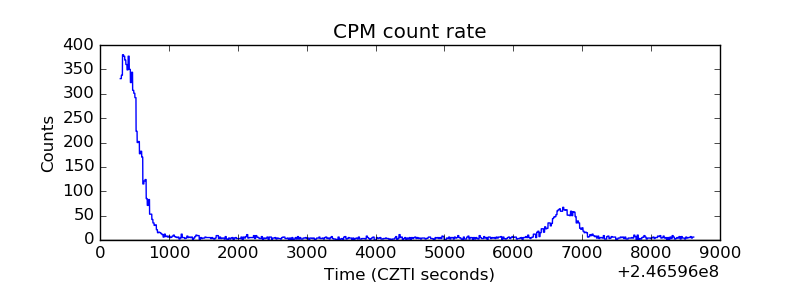 |
| CZT Counter | 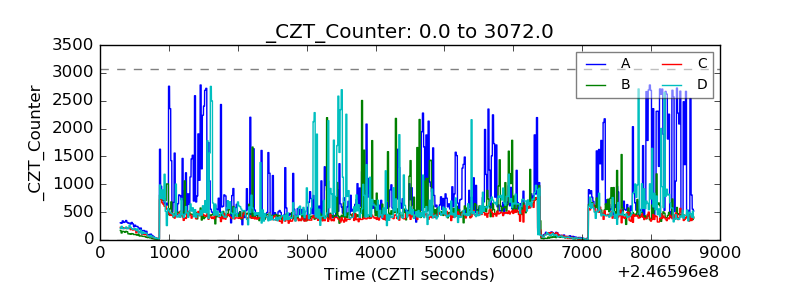 |
| +2.5 Volts monitor |  |
| +5 Volts monitor |  |
| _ROLL_ROT | 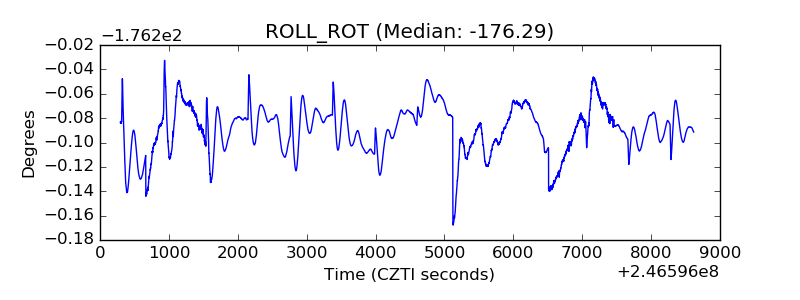 |
| _Roll_DEC | 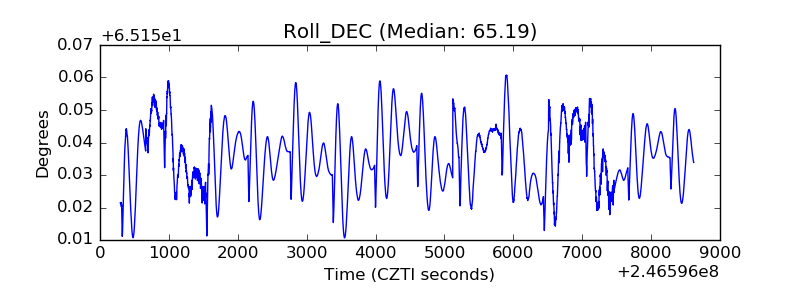 |
| _Roll_RA | 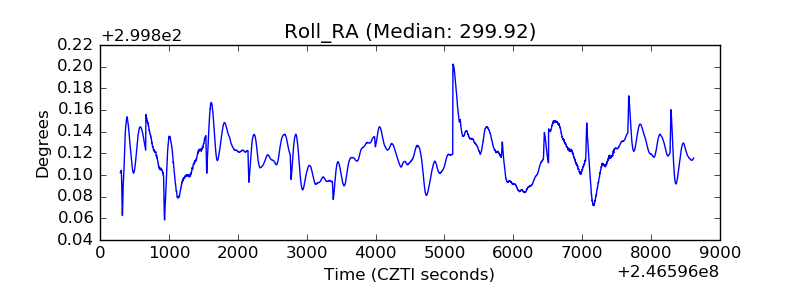 |
| Veto Counter | 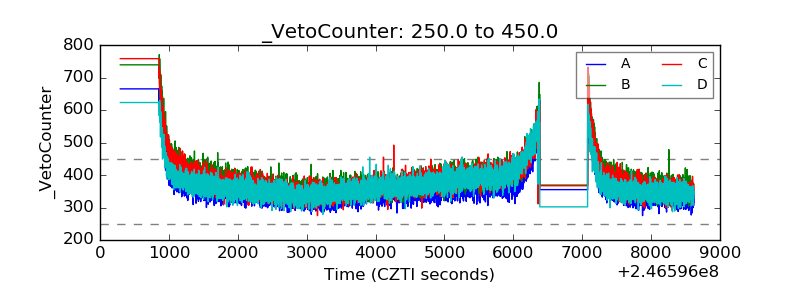 |