| Param | Original file | Final file |
|---|---|---|
| Filename | modeM0/AS1T01_200T01_9000001638_11221cztM0_level2.evt | modeM0/AS1T01_200T01_9000001638_11221cztM0_level2_quad_clean.evt |
| Size (bytes) | 604,391,040 | 118,353,600 |
| Size | 576.4 MB | 112.9 MB |
| Events in quadrant A | 7,281,472 | 714,971 |
| Events in quadrant B | 3,756,334 | 808,094 |
| Events in quadrant C | 3,075,685 | 814,275 |
| Events in quadrant D | 3,729,824 | 772,880 |
| Mode M9 | |||
|---|---|---|---|
| Quadrant | BADHDUFLAG | Total packets | Discarded packets |
| A | 0 | 2 | 0 |
| B | 0 | 2 | 0 |
| C | 0 | 2 | 0 |
| D | 0 | 2 | 0 |
| Mode SS | |||
|---|---|---|---|
| Quadrant | BADHDUFLAG | Total packets | Discarded packets |
| A | 0 | 138 | 0 |
| B | 0 | 138 | 0 |
| C | 0 | 138 | 0 |
| D | 0 | 138 | 0 |
| Mode M0 | |||
|---|---|---|---|
| Quadrant | BADHDUFLAG | Total packets | Discarded packets |
| A | 0 | 26262 | 2 |
| B | 0 | 15732 | 1 |
| C | 0 | 14196 | 1 |
| D | 0 | 15689 | 1 |
| Quadrant | Total seconds | Saturated seconds | Saturation percentage |
|---|---|---|---|
| A | 6796 | 1288 | 18.952325% |
| B | 6796 | 203 | 2.987051% |
| C | 6796 | 36 | 0.529723% |
| D | 6796 | 124 | 1.824603% |
Noise dominated data is calculated using 1-second bins in cleaned event files. If a bin has >2000 counts, and if more than 50% of those come from <1% of pixels, then it is considered to be noise-dominated and hence unusable.
| Quadrant | # 1 sec bins | Bins with >0 counts | Bins with >2000 counts | High rate bins dominated by noise | Noise dominated (total time) | Noise dominated (detector-on time) | Marked lightcurve |
|---|---|---|---|---|---|---|---|
| A | 7061 | 6797 | 888 | 888 | 12.58% | 13.06% | 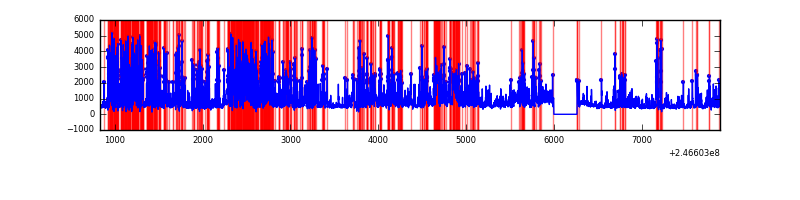 |
| B | 7061 | 6797 | 71 | 71 | 1.01% | 1.04% | 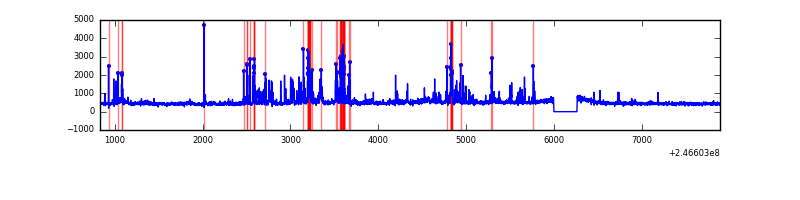 |
| C | 7061 | 6797 | 4 | 4 | 0.06% | 0.06% |  |
| D | 7061 | 6797 | 56 | 56 | 0.79% | 0.82% | 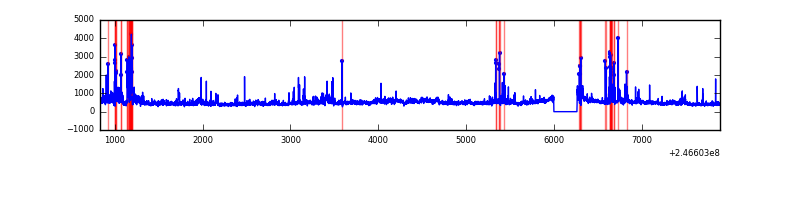 |
Top three noisy pixels from each quadrant. If the there are fewer than three noisy pixels in the level2.evt file, extra rows are filled as -1
| Pixel properties | Quadrant properties | ||||||
|---|---|---|---|---|---|---|---|
| Quadrant | DetID | PixID | Counts | Sigma | Mean | Median | Sigma |
| A | 8 | 5 | 4234346 | 28919.91 | 706 | 690 | 146.4 |
| A | 15 | 174 | 120055 | 815.38 | 706 | 690 | 146.4 |
| A | 14 | 238 | 100342 | 680.72 | 706 | 690 | 146.4 |
| B | 4 | 239 | 536083 | 3701.92 | 766 | 749 | 144.6 |
| B | 0 | 219 | 79801 | 546.66 | 766 | 749 | 144.6 |
| B | 15 | 204 | 57311 | 391.14 | 766 | 749 | 144.6 |
| C | 1 | 3 | 106468 | 609.96 | 747 | 750 | 173.3 |
| C | 4 | 254 | 54750 | 311.56 | 747 | 750 | 173.3 |
| C | 13 | 61 | 5535 | 27.61 | 747 | 750 | 173.3 |
| D | 13 | 152 | 196216 | 1102.22 | 737 | 714 | 177.4 |
| D | 8 | 195 | 168501 | 945.96 | 737 | 714 | 177.4 |
| D | 1 | 52 | 150028 | 841.82 | 737 | 714 | 177.4 |
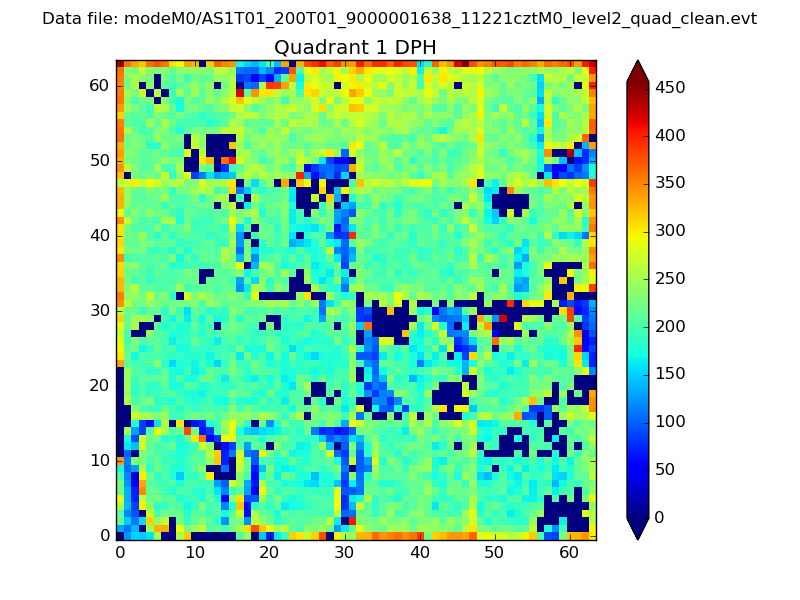
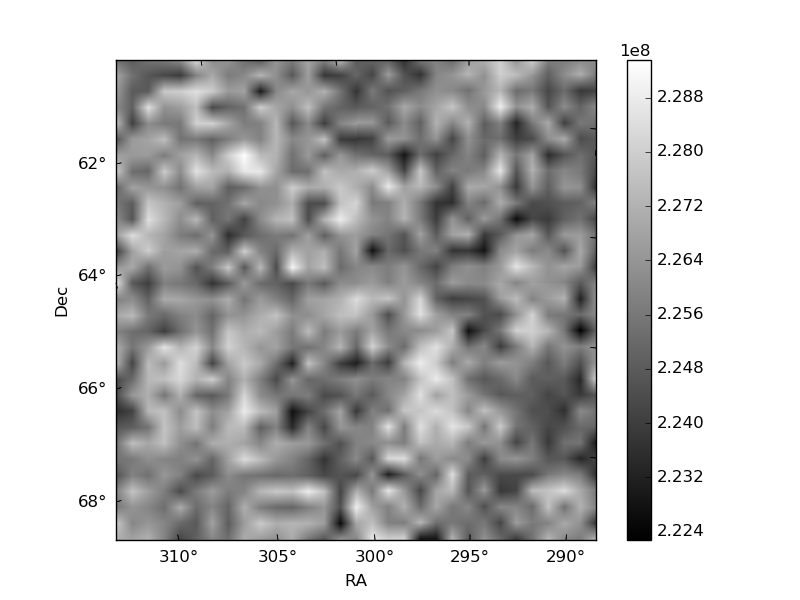
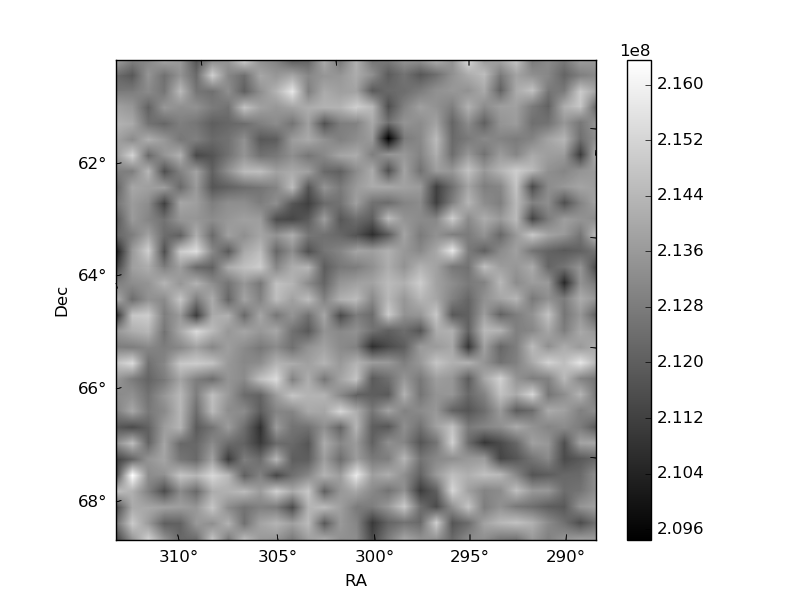
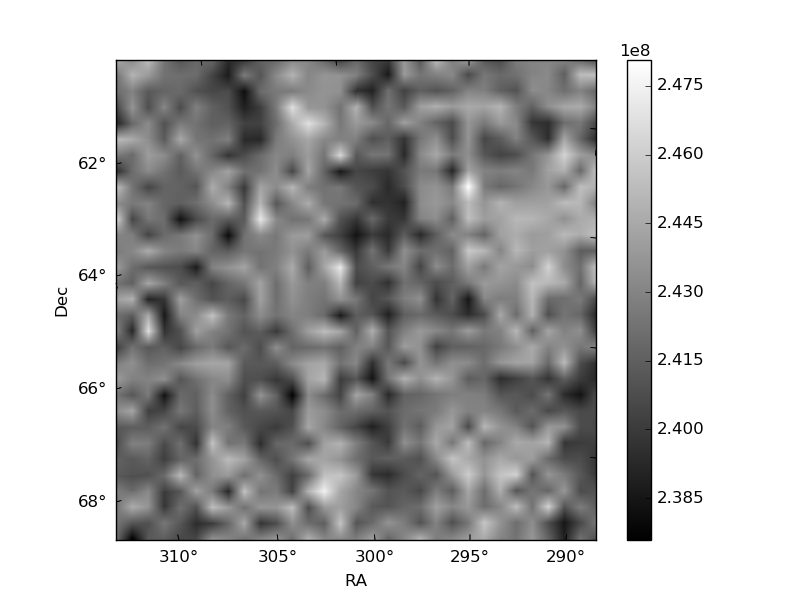
Histogram calculated using DETX and DETY for each event in the final _common_clean file
| Quadrant A | 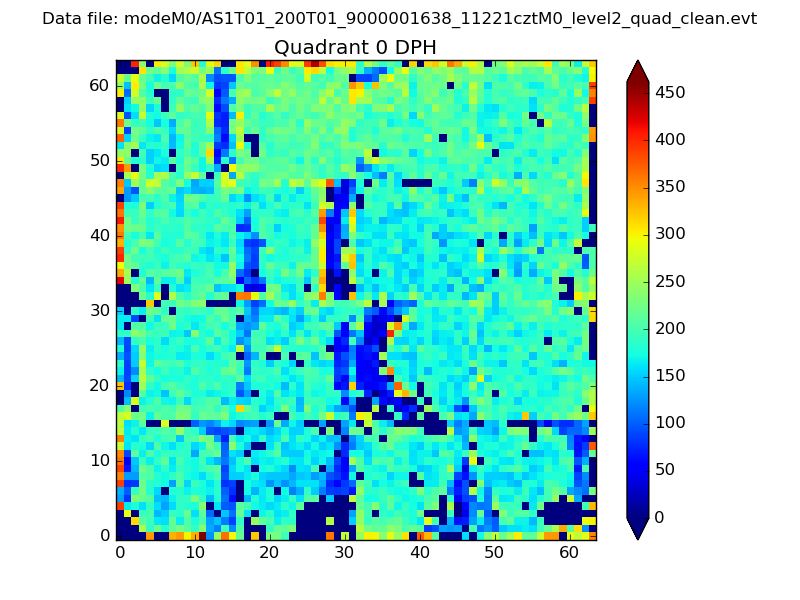 |
 |
Quadrant B |
|---|---|---|---|
| Quadrant D | 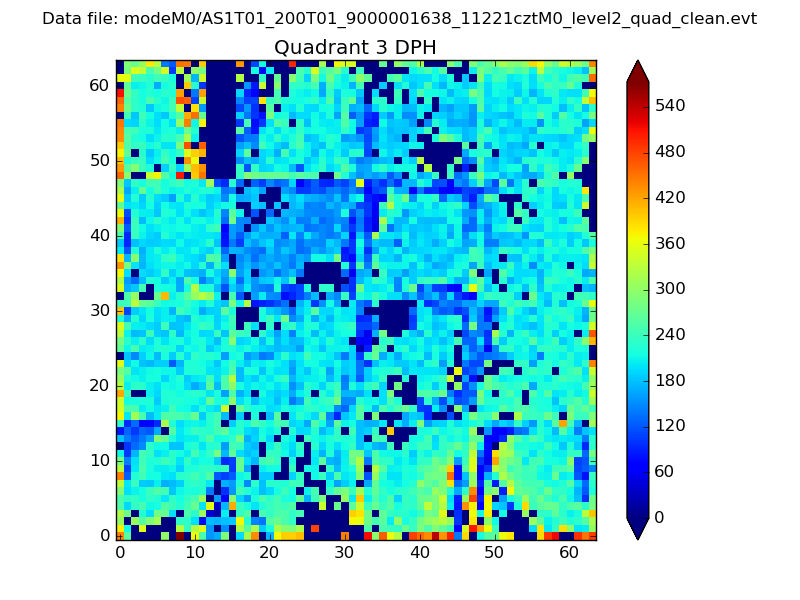 |
 |
Quadrant C |
| Plot type | Count rate plots | Images |
|---|---|---|
| Comparison with Poisson distribution Blue bars denote a histogram of data divided into 1 sec bins. Red curve is a Poisson curve with rate = median count rate of data. |
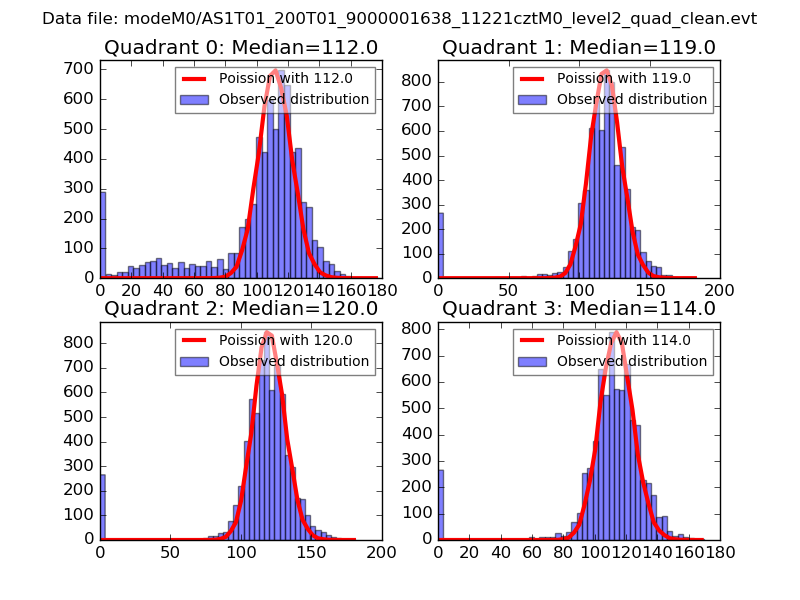 |
 |
| Quadrant-wise count rates Data is divided into 100 sec bins |
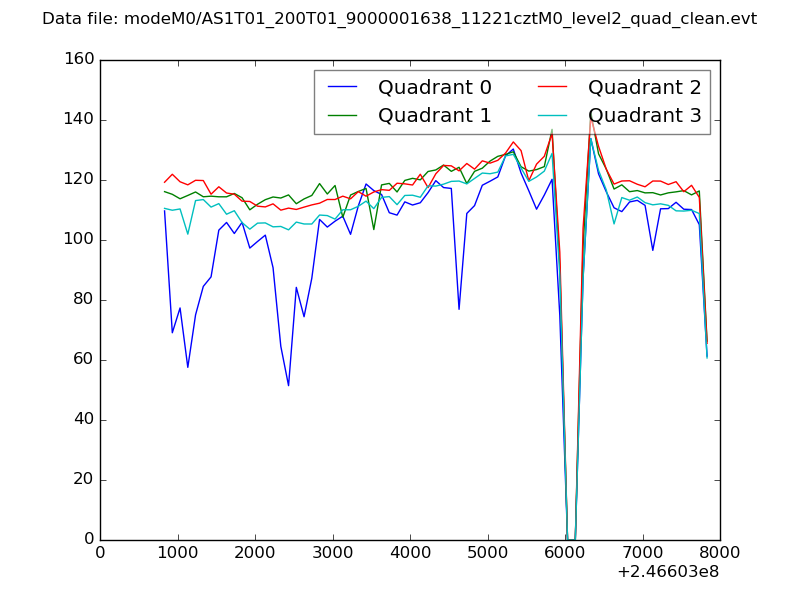 |
|
| Module-wise count rates for Quadrant A Data is divided into 100 sec bins |
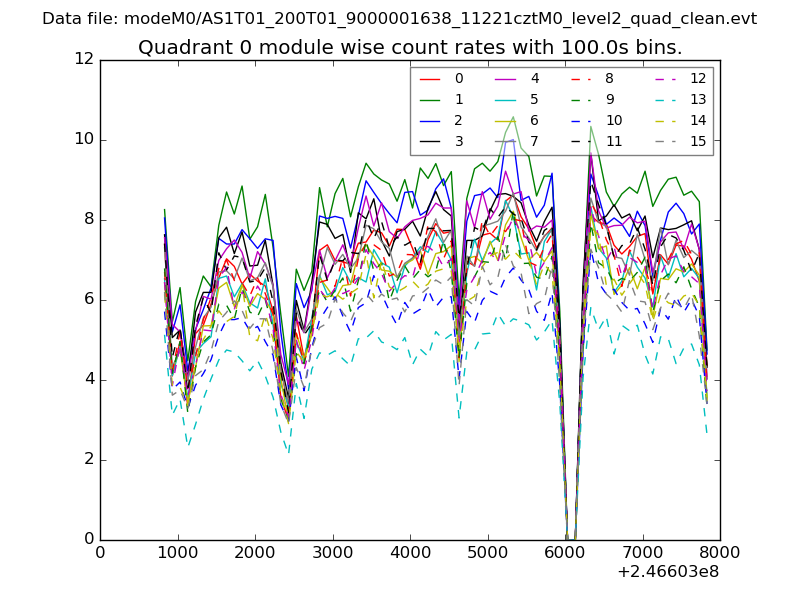 |
 |
| Module-wise count rates for Quadrant B Data is divided into 100 sec bins |
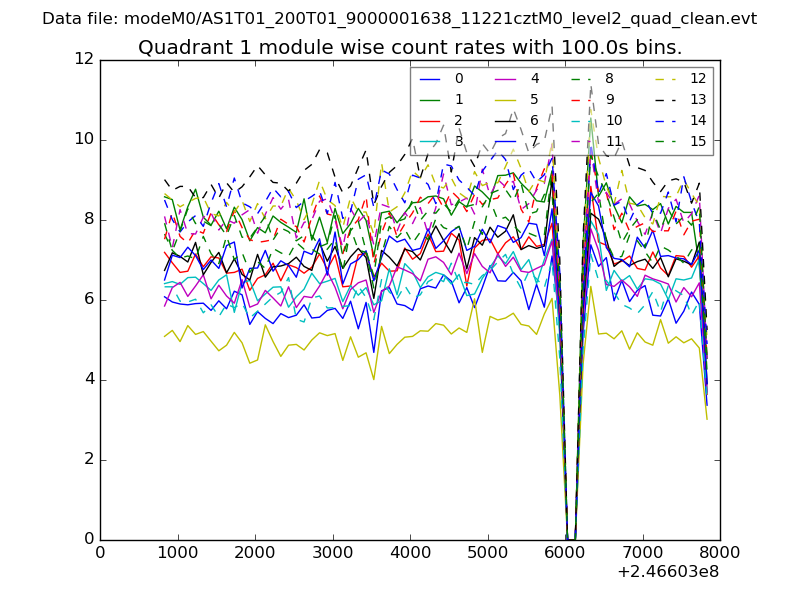 |
 |
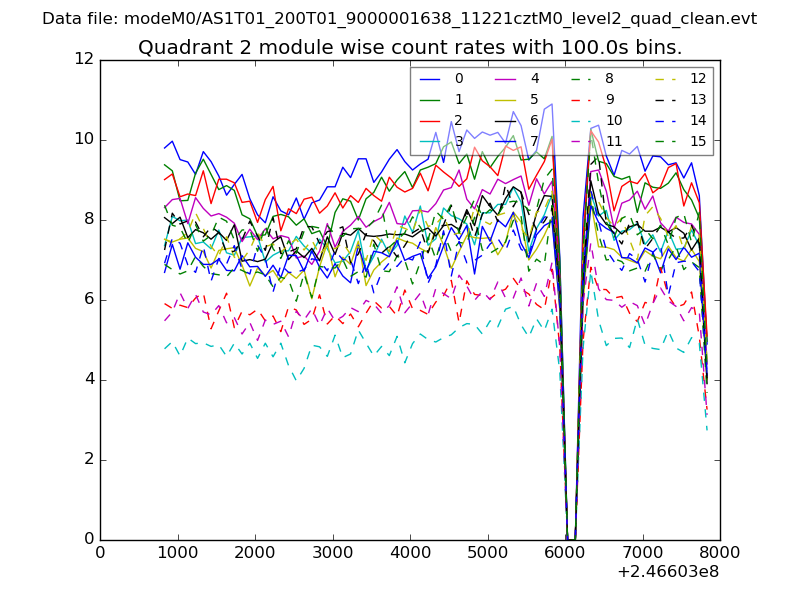
| Module-wise count rates for Quadrant C Data is divided into 100 sec bins |
 |
 |
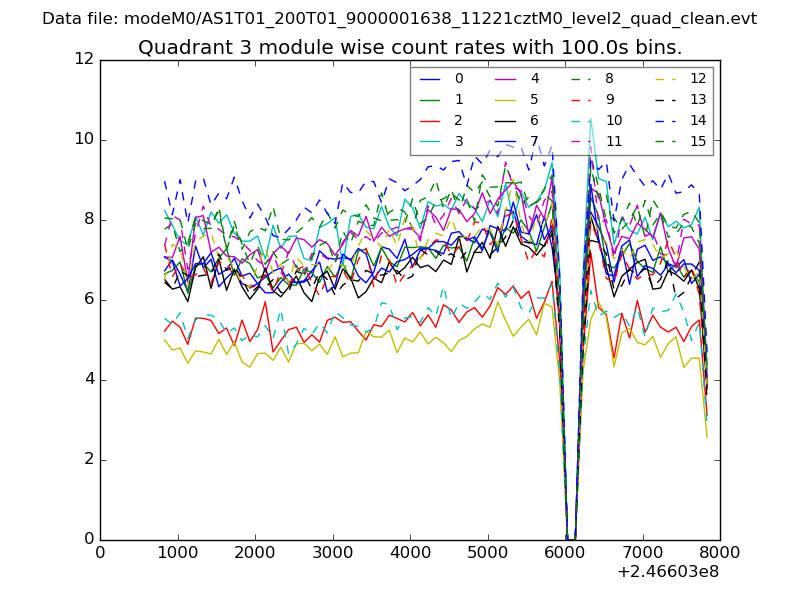
| Module-wise count rates for Quadrant D Data is divided into 100 sec bins |
 |
 |
| Parameter | Plot |
|---|---|
| CZT HV Monitor | 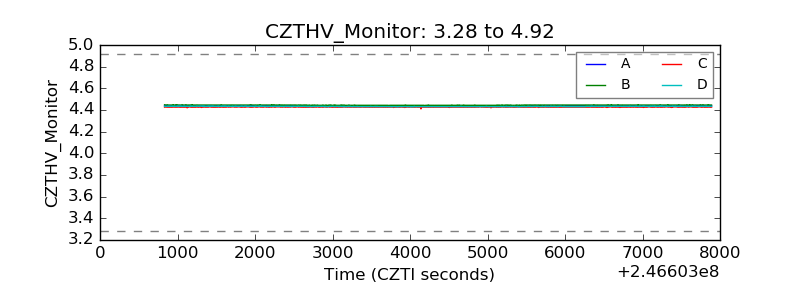 |
| D_VDD | 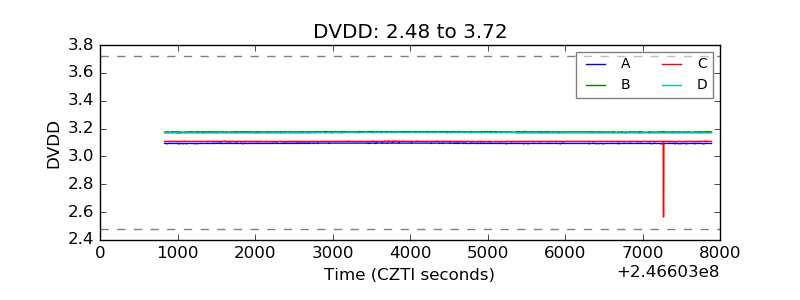 |
| Temperature 1 | 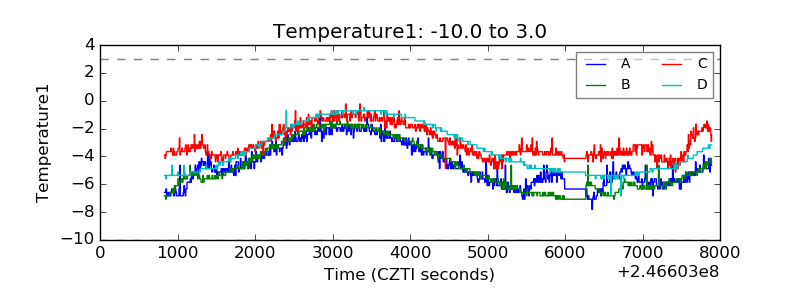 |
| Veto HV Monitor | 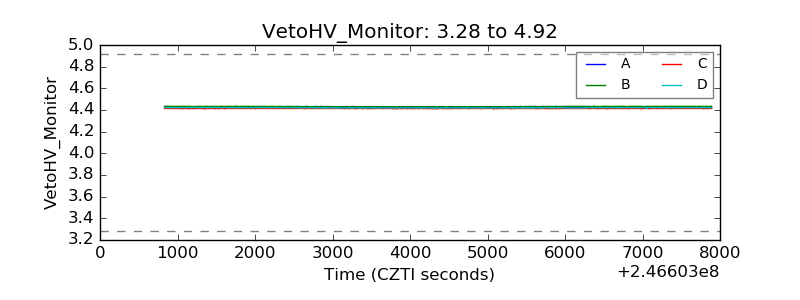 |
| Veto LLD | 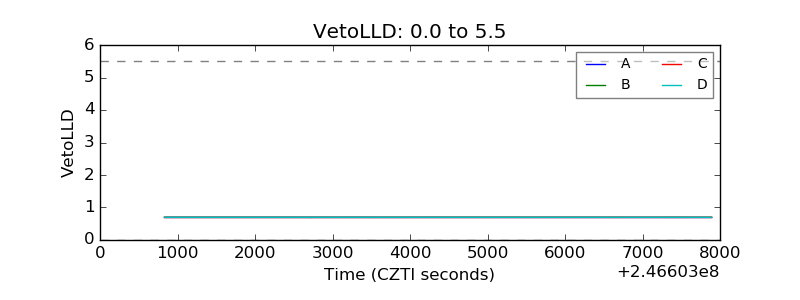 |
| Alpha Counter | 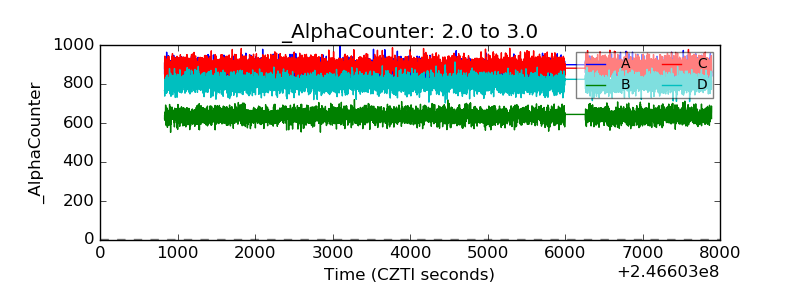 |
| _CPM_Rate | 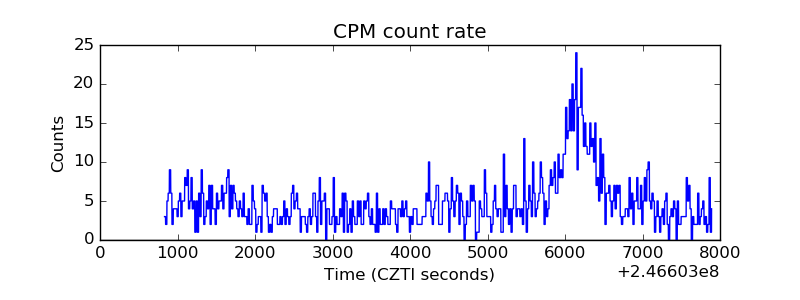 |
| CZT Counter |  |
| +2.5 Volts monitor |  |
| +5 Volts monitor |  |
| _ROLL_ROT | 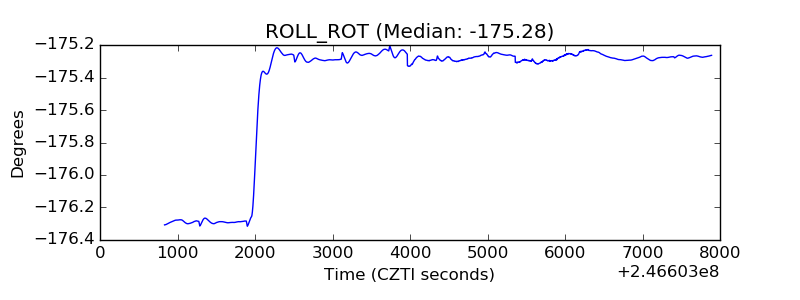 |
| _Roll_DEC | 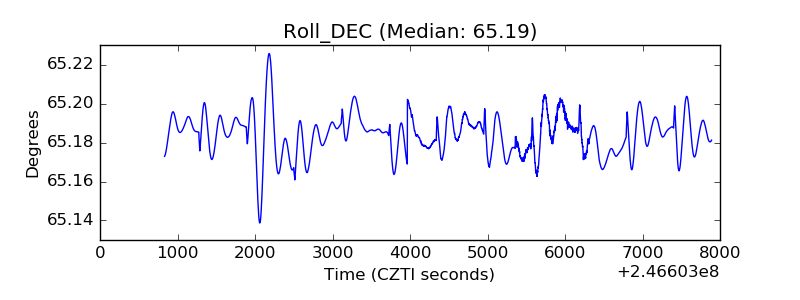 |
| _Roll_RA | 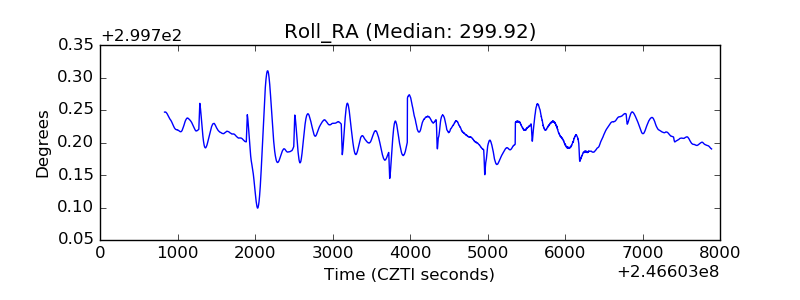 |
| Veto Counter | 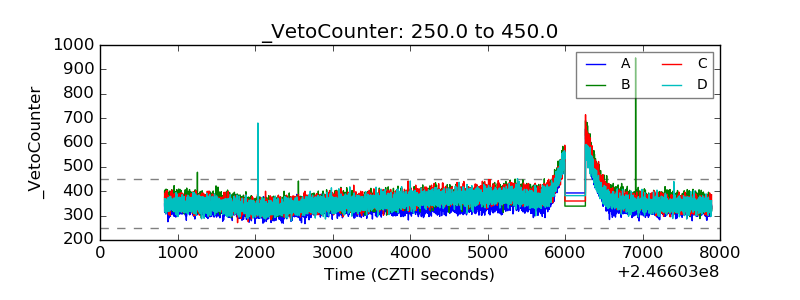 |