| Param | Original file | Final file |
|---|---|---|
| Filename | modeM0/AS1T01_200T01_9000001638_11222cztM0_level2.evt | modeM0/AS1T01_200T01_9000001638_11222cztM0_level2_quad_clean.evt |
| Size (bytes) | 676,526,400 | 131,137,920 |
| Size | 645.2 MB | 125.1 MB |
| Events in quadrant A | 8,223,526 | 804,001 |
| Events in quadrant B | 3,822,226 | 897,046 |
| Events in quadrant C | 3,352,920 | 901,629 |
| Events in quadrant D | 4,578,212 | 842,588 |
| Mode M9 | |||
|---|---|---|---|
| Quadrant | BADHDUFLAG | Total packets | Discarded packets |
| A | 0 | 1 | 0 |
| B | 0 | 1 | 0 |
| C | 0 | 1 | 0 |
| D | 0 | 1 | 0 |
| Mode SS | |||
|---|---|---|---|
| Quadrant | BADHDUFLAG | Total packets | Discarded packets |
| A | 0 | 154 | 0 |
| B | 0 | 154 | 0 |
| C | 0 | 154 | 0 |
| D | 0 | 154 | 0 |
| Mode M0 | |||
|---|---|---|---|
| Quadrant | BADHDUFLAG | Total packets | Discarded packets |
| A | 0 | 29623 | 2 |
| B | 0 | 16484 | 1 |
| C | 0 | 15572 | 1 |
| D | 0 | 18659 | 1 |
| Quadrant | Total seconds | Saturated seconds | Saturation percentage |
|---|---|---|---|
| A | 7554 | 1411 | 18.678846% |
| B | 7554 | 194 | 2.568176% |
| C | 7554 | 56 | 0.741329% |
| D | 7554 | 292 | 3.865502% |
Noise dominated data is calculated using 1-second bins in cleaned event files. If a bin has >2000 counts, and if more than 50% of those come from <1% of pixels, then it is considered to be noise-dominated and hence unusable.
| Quadrant | # 1 sec bins | Bins with >0 counts | Bins with >2000 counts | High rate bins dominated by noise | Noise dominated (total time) | Noise dominated (detector-on time) | Marked lightcurve |
|---|---|---|---|---|---|---|---|
| A | 7654 | 7555 | 912 | 912 | 11.92% | 12.07% | 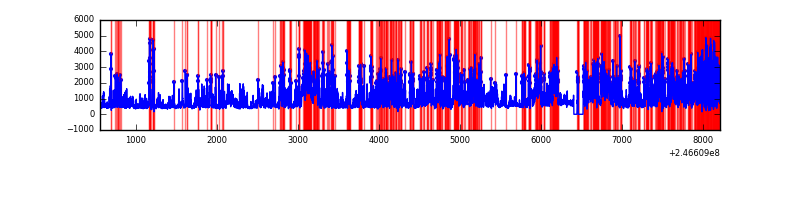 |
| B | 7654 | 7556 | 43 | 43 | 0.56% | 0.57% | 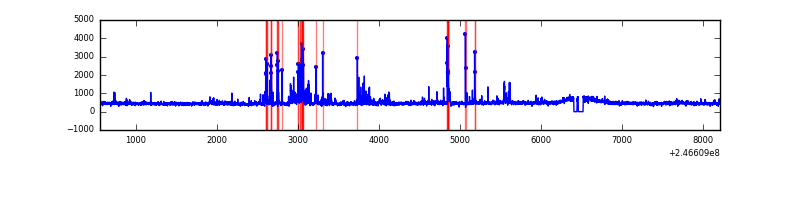 |
| C | 7654 | 7556 | 8 | 8 | 0.10% | 0.11% | 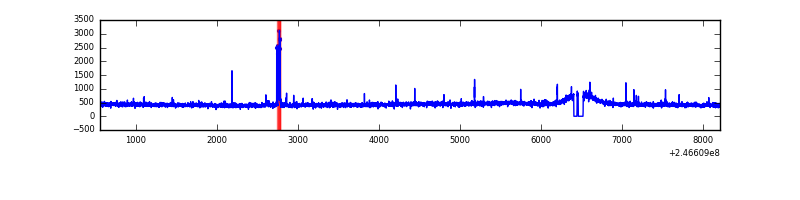 |
| D | 7654 | 7556 | 165 | 165 | 2.16% | 2.18% | 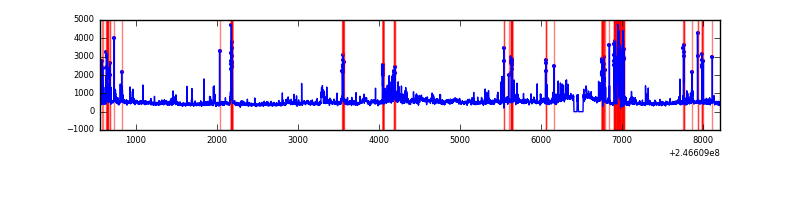 |
Top three noisy pixels from each quadrant. If the there are fewer than three noisy pixels in the level2.evt file, extra rows are filled as -1
| Pixel properties | Quadrant properties | ||||||
|---|---|---|---|---|---|---|---|
| Quadrant | DetID | PixID | Counts | Sigma | Mean | Median | Sigma |
| A | 8 | 5 | 3552282 | 21423.98 | 800 | 778 | 165.8 |
| A | 14 | 238 | 1470900 | 8868.32 | 800 | 778 | 165.8 |
| A | 15 | 174 | 61007 | 363.32 | 800 | 778 | 165.8 |
| B | 4 | 239 | 313095 | 1891.9 | 859 | 836 | 165.1 |
| B | 15 | 204 | 59767 | 357.05 | 859 | 836 | 165.1 |
| B | 4 | 80 | 46412 | 276.13 | 859 | 836 | 165.1 |
| C | 4 | 254 | 85125 | 434.3 | 838 | 840 | 194.1 |
| C | 13 | 61 | 6383 | 28.56 | 838 | 840 | 194.1 |
| C | 3 | 202 | 2107 | 6.53 | 838 | 840 | 194.1 |
| D | 8 | 195 | 428600 | 2130.02 | 822 | 794 | 200.8 |
| D | 10 | 253 | 367386 | 1825.24 | 822 | 794 | 200.8 |
| D | 1 | 52 | 341324 | 1695.48 | 822 | 794 | 200.8 |
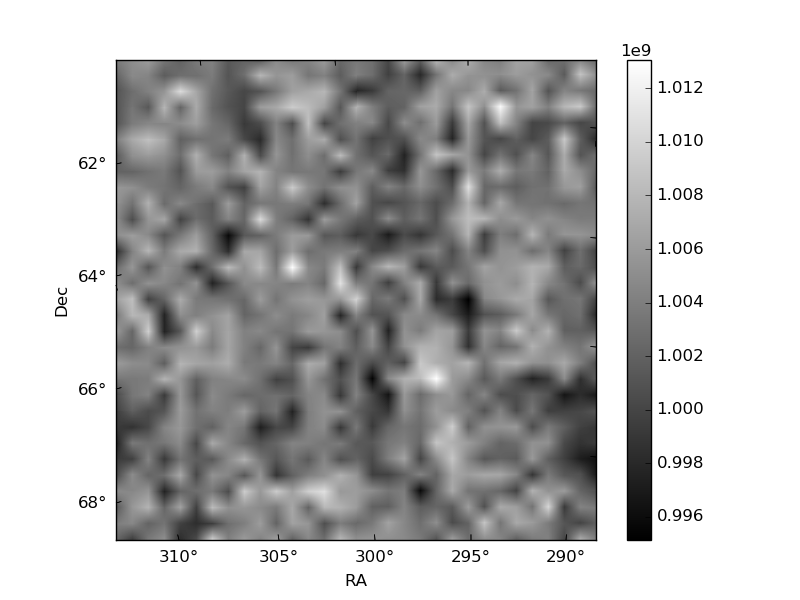
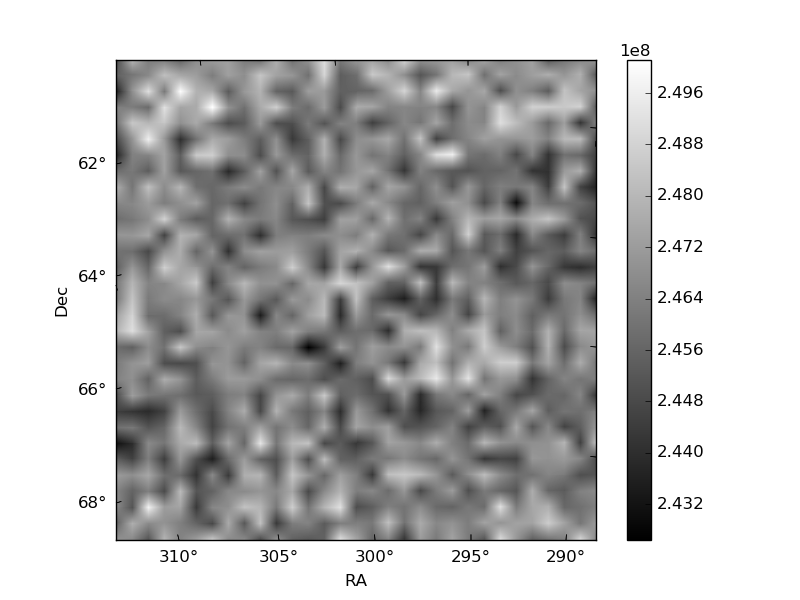
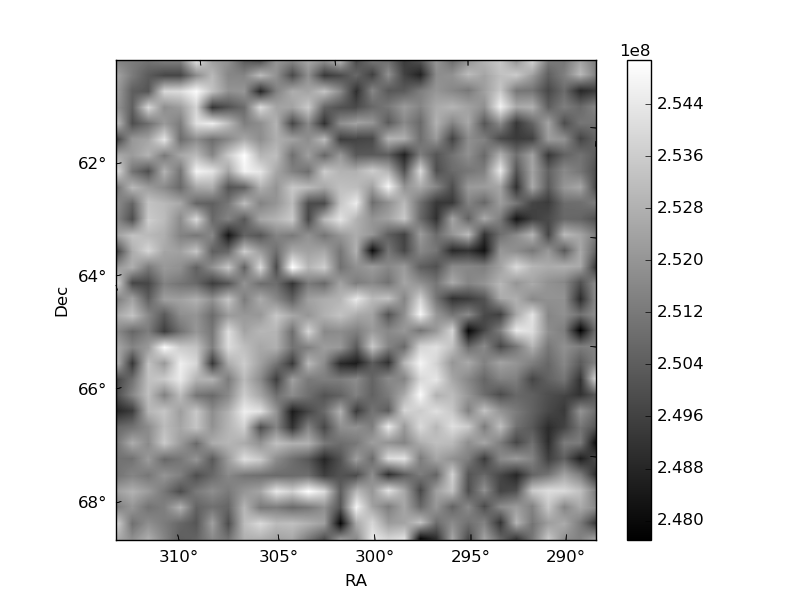
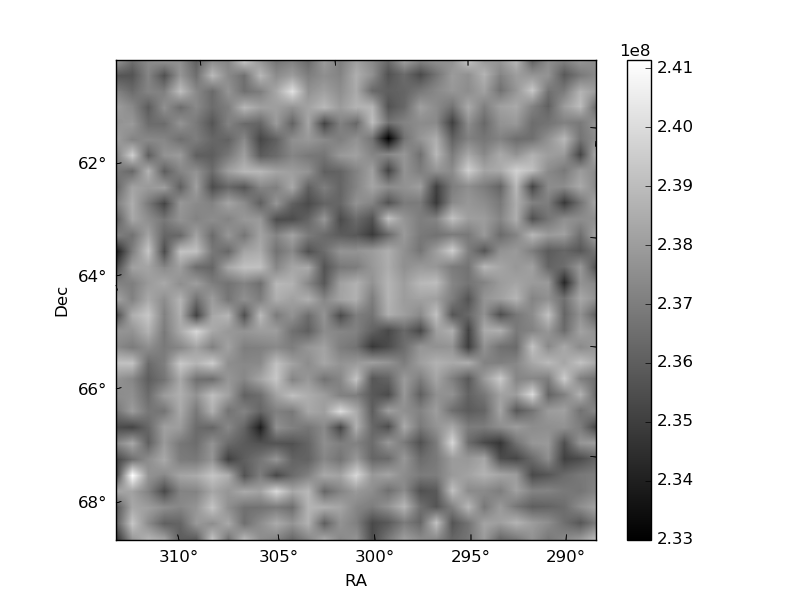
Histogram calculated using DETX and DETY for each event in the final _common_clean file
| Quadrant A | 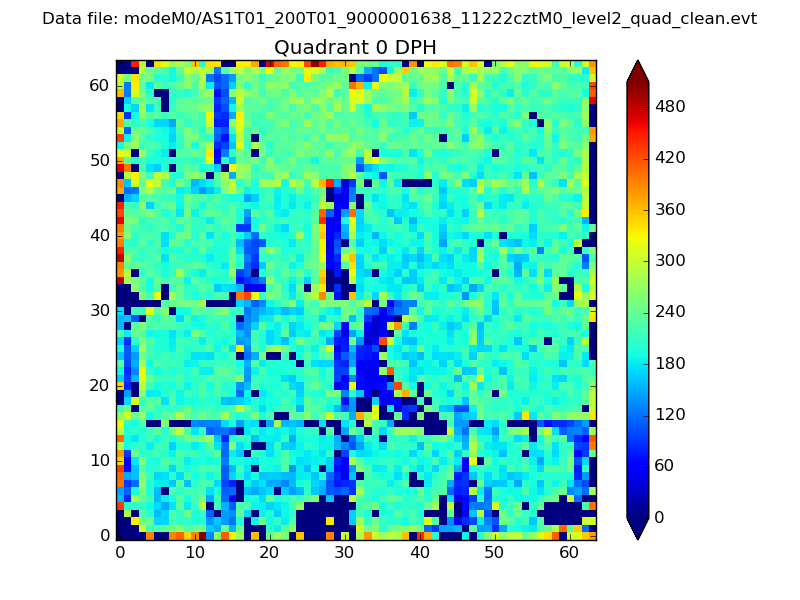 |
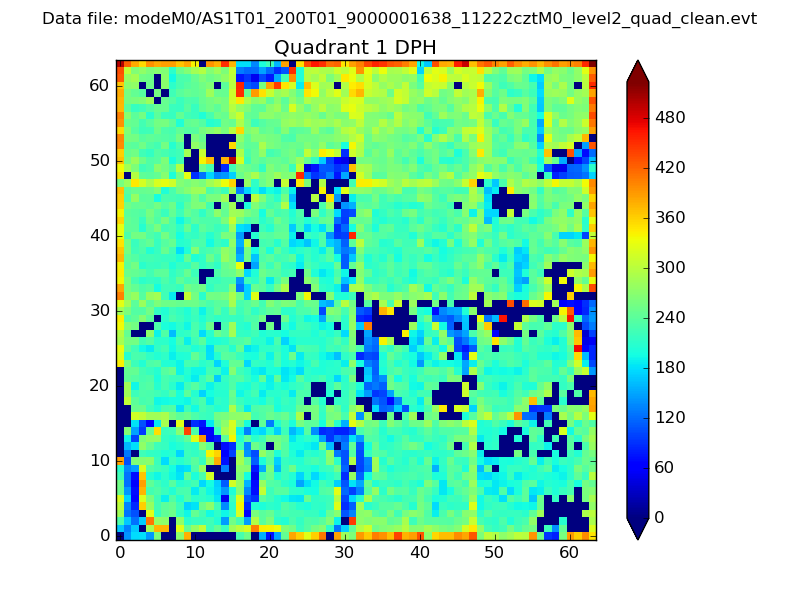 |
Quadrant B |
|---|---|---|---|
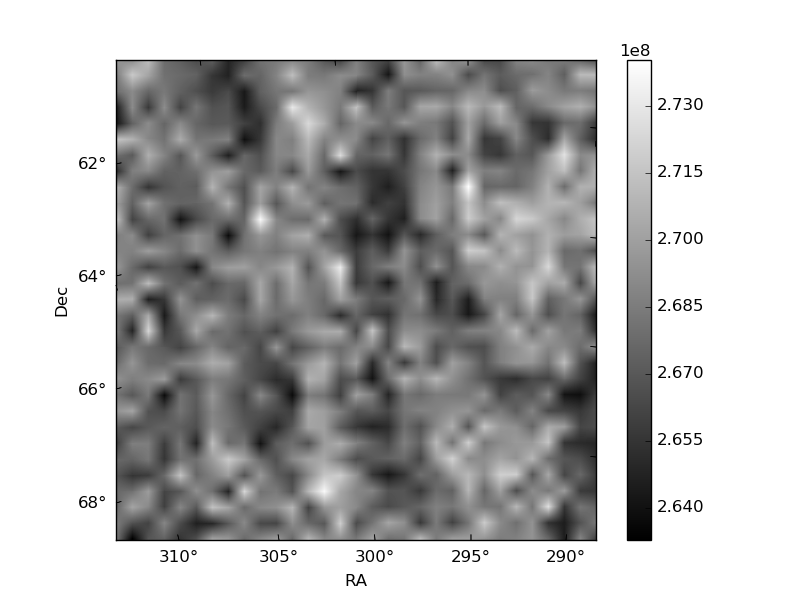
| Quadrant D | 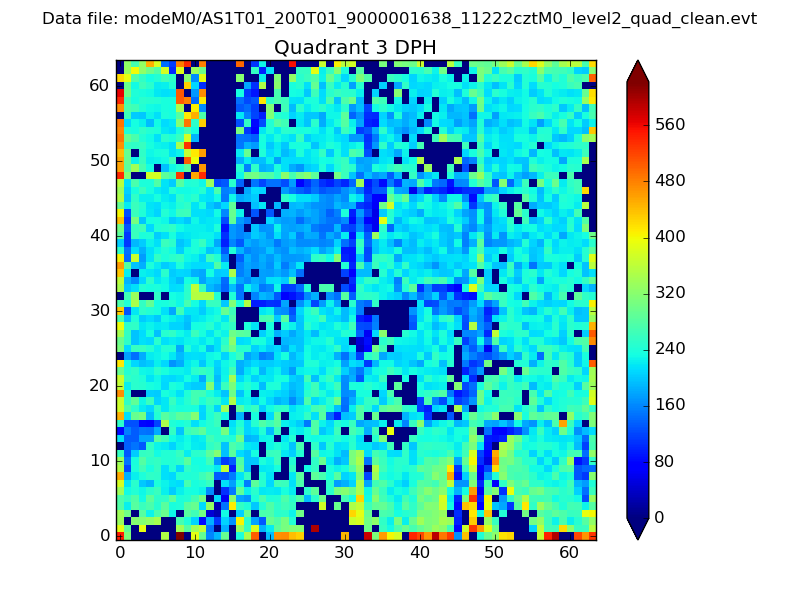 |
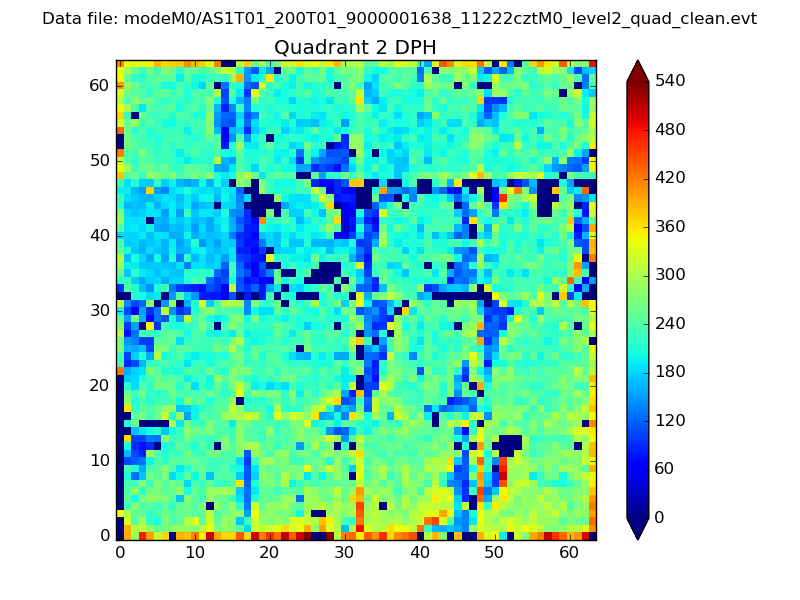 |
Quadrant C |
| Plot type | Count rate plots | Images |
|---|---|---|
| Comparison with Poisson distribution Blue bars denote a histogram of data divided into 1 sec bins. Red curve is a Poisson curve with rate = median count rate of data. |
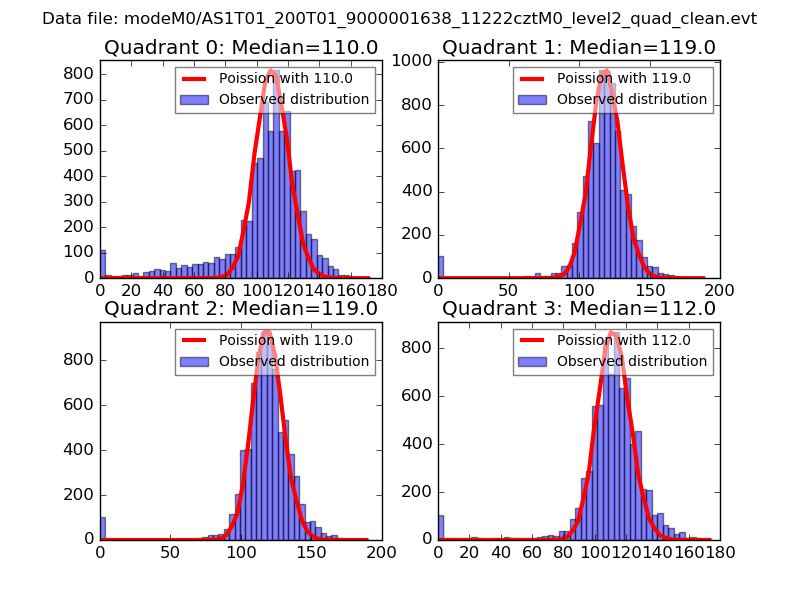 |
 |
| Quadrant-wise count rates Data is divided into 100 sec bins |
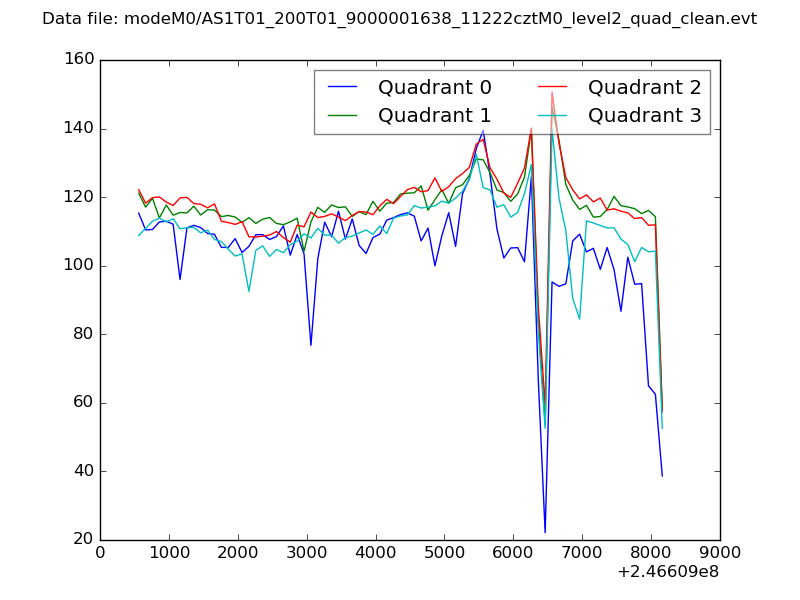 |
|
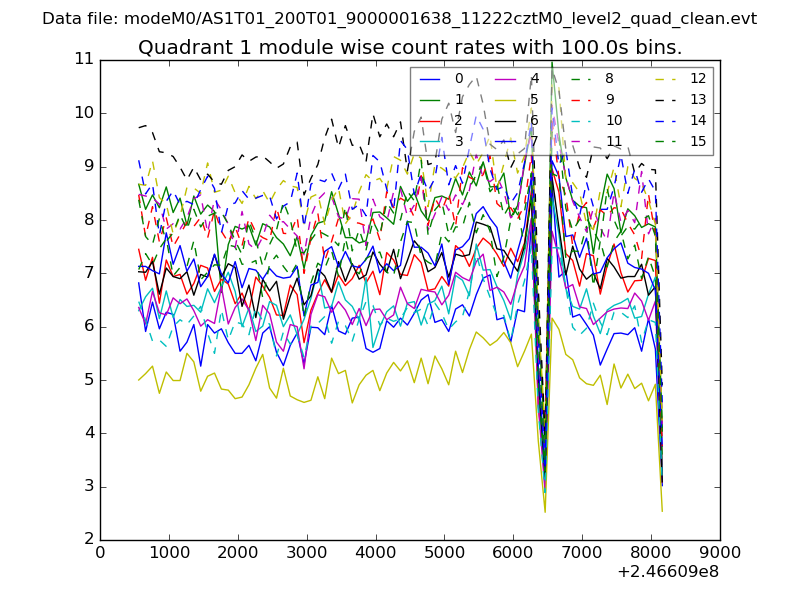
| Module-wise count rates for Quadrant A Data is divided into 100 sec bins |
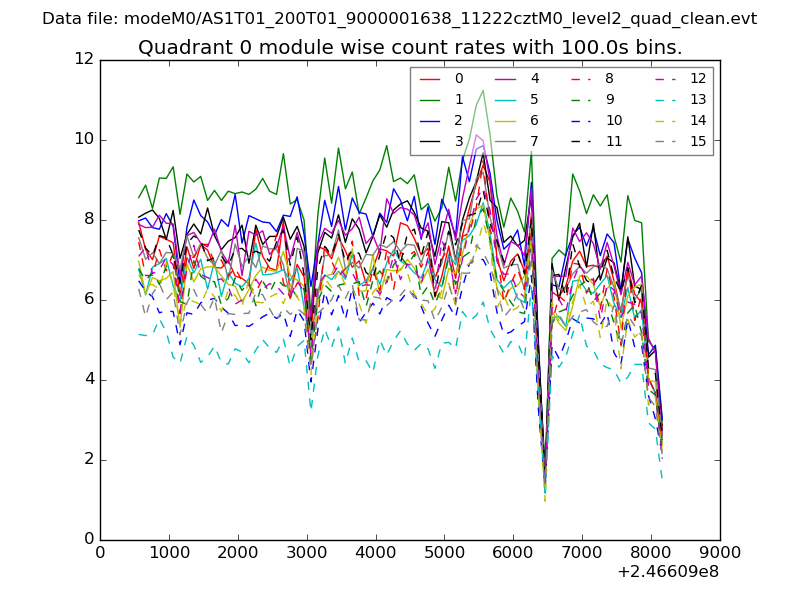 |
 |
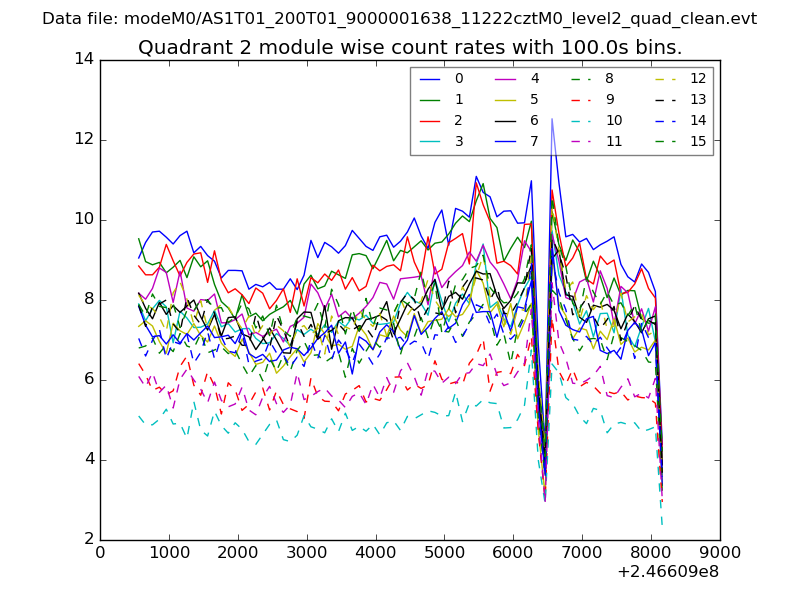
| Module-wise count rates for Quadrant B Data is divided into 100 sec bins |
 |
 |
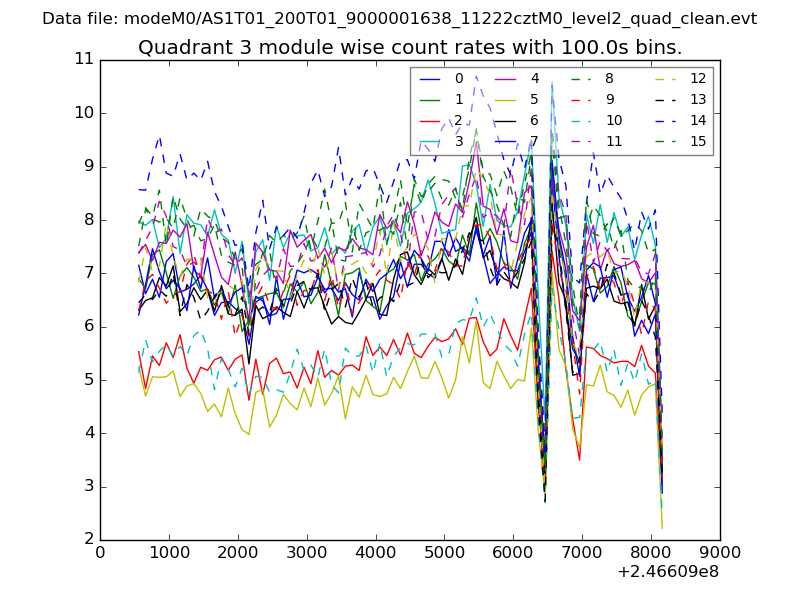
| Module-wise count rates for Quadrant C Data is divided into 100 sec bins |
 |
 |
| Module-wise count rates for Quadrant D Data is divided into 100 sec bins |
 |
 |
| Parameter | Plot |
|---|---|
| CZT HV Monitor | 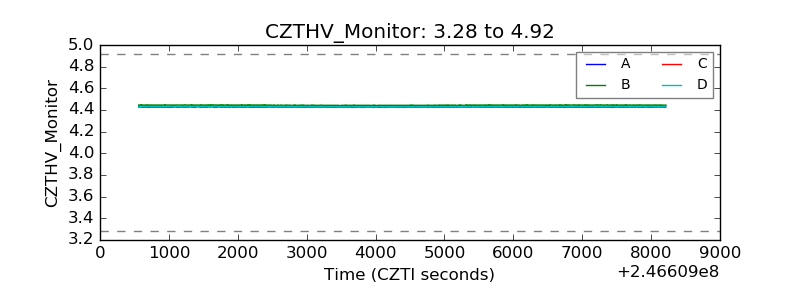 |
| D_VDD | 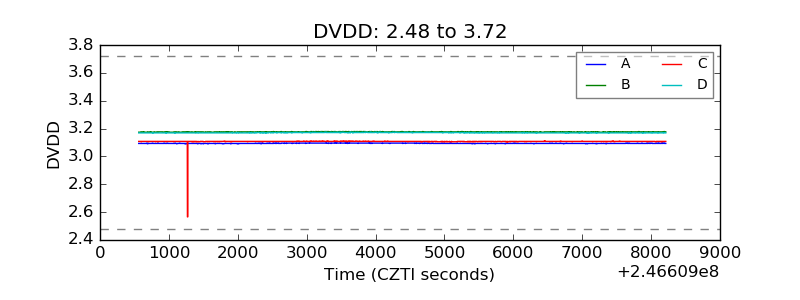 |
| Temperature 1 | 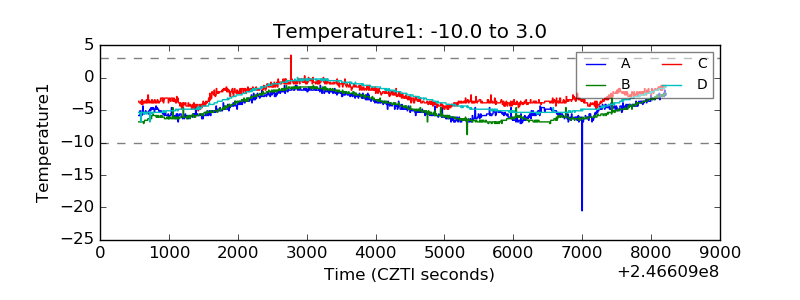 |
| Veto HV Monitor | 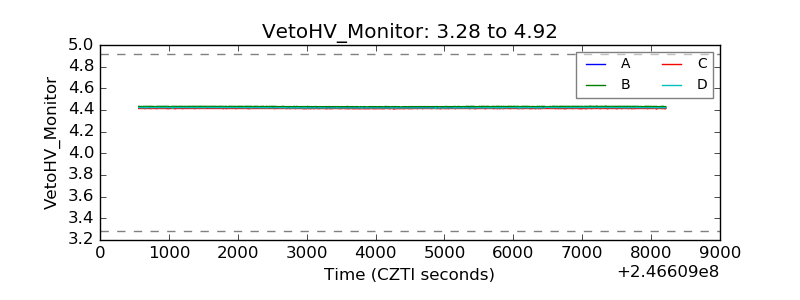 |
| Veto LLD | 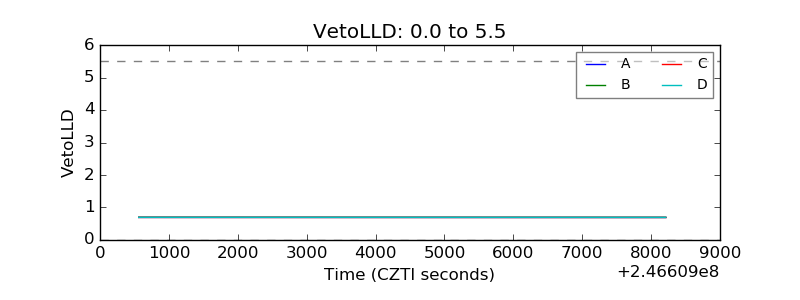 |
| Alpha Counter | 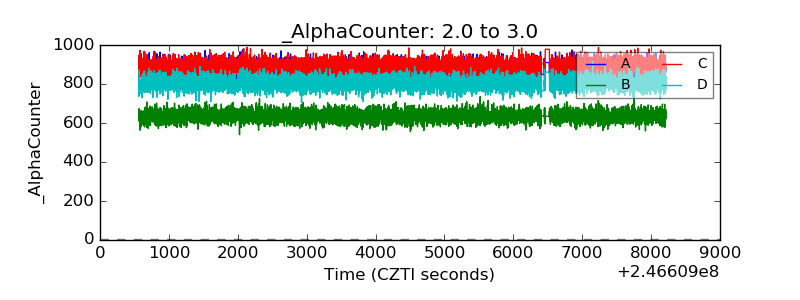 |
| _CPM_Rate | 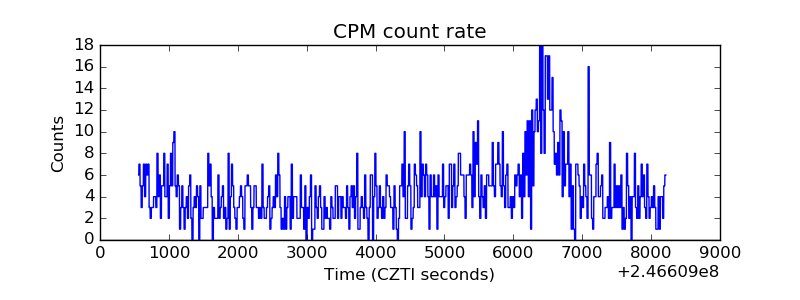 |
| CZT Counter | 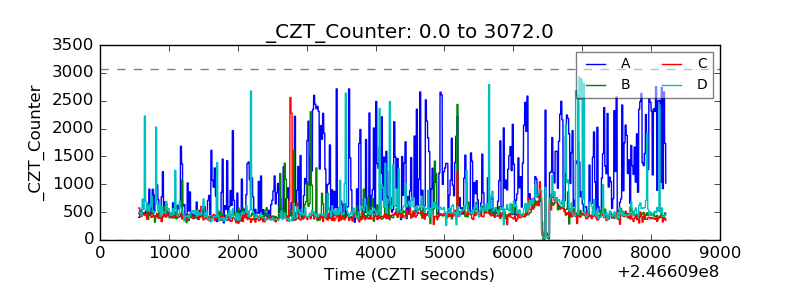 |
| +2.5 Volts monitor |  |
| +5 Volts monitor |  |
| _ROLL_ROT | 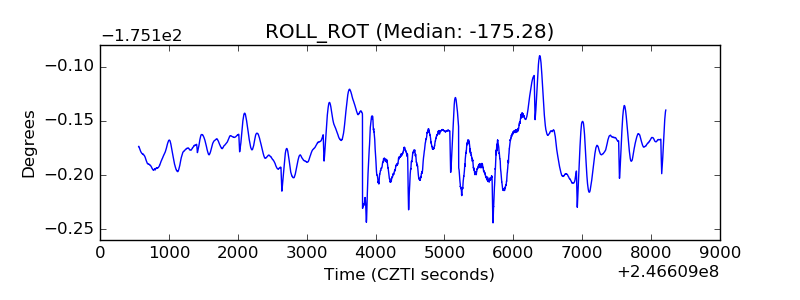 |
| _Roll_DEC | 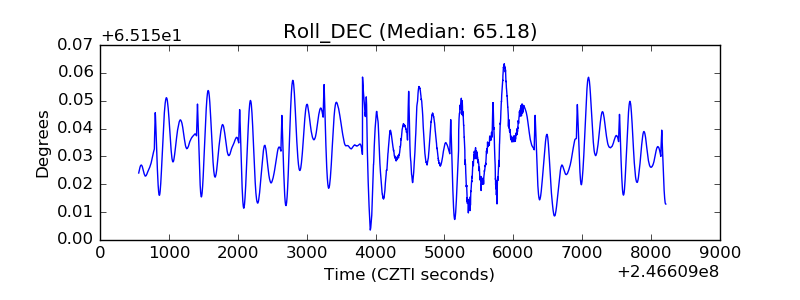 |
| _Roll_RA | 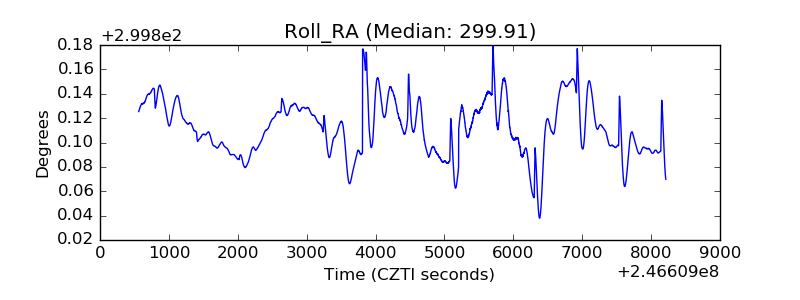 |
| Veto Counter | 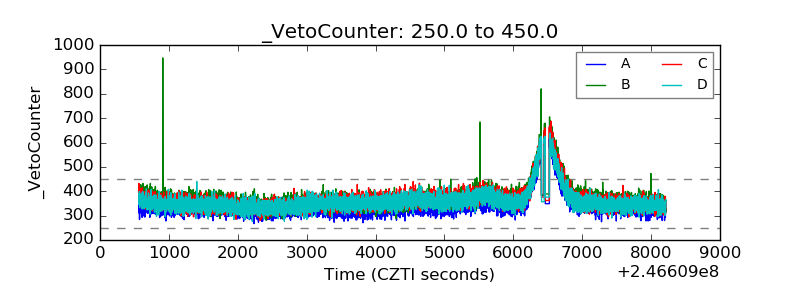 |