| Param | Original file | Final file |
|---|---|---|
| Filename | modeM0/AS1T01_200T01_9000001638_11225cztM0_level2.evt | modeM0/AS1T01_200T01_9000001638_11225cztM0_level2_quad_clean.evt |
| Size (bytes) | 360,613,440 | 49,800,960 |
| Size | 343.9 MB | 47.5 MB |
| Events in quadrant A | 5,640,226 | 240,692 |
| Events in quadrant B | 1,712,818 | 358,021 |
| Events in quadrant C | 1,361,946 | 352,206 |
| Events in quadrant D | 1,992,671 | 333,610 |
| Mode SS | |||
|---|---|---|---|
| Quadrant | BADHDUFLAG | Total packets | Discarded packets |
| A | 0 | 64 | 0 |
| B | 0 | 64 | 0 |
| C | 0 | 64 | 0 |
| D | 0 | 64 | 0 |
| Mode M0 | |||
|---|---|---|---|
| Quadrant | BADHDUFLAG | Total packets | Discarded packets |
| A | 0 | 18916 | 1 |
| B | 0 | 7211 | 0 |
| C | 0 | 6467 | 0 |
| D | 0 | 8023 | 0 |
| Quadrant | Total seconds | Saturated seconds | Saturation percentage |
|---|---|---|---|
| A | 3123 | 1627 | 52.097342% |
| B | 3123 | 52 | 1.665066% |
| C | 3123 | 14 | 0.448287% |
| D | 3123 | 73 | 2.337496% |
Noise dominated data is calculated using 1-second bins in cleaned event files. If a bin has >2000 counts, and if more than 50% of those come from <1% of pixels, then it is considered to be noise-dominated and hence unusable.
| Quadrant | # 1 sec bins | Bins with >0 counts | Bins with >2000 counts | High rate bins dominated by noise | Noise dominated (total time) | Noise dominated (detector-on time) | Marked lightcurve |
|---|---|---|---|---|---|---|---|
| A | 3123 | 3123 | 1245 | 1245 | 39.87% | 39.87% | 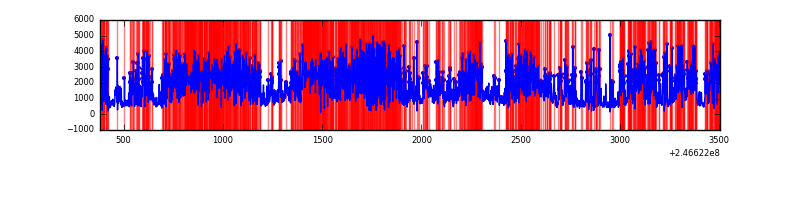 |
| B | 3123 | 3123 | 33 | 33 | 1.06% | 1.06% | 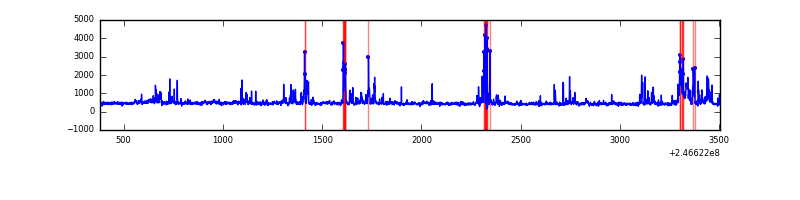 |
| C | 3123 | 3123 | 9 | 9 | 0.29% | 0.29% | 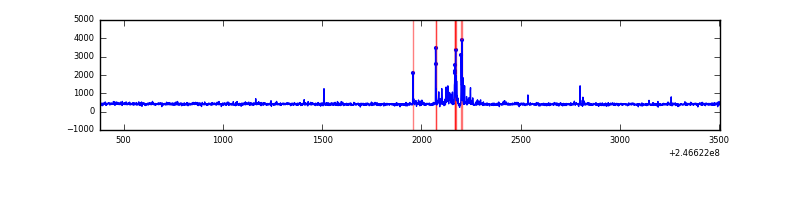 |
| D | 3123 | 3123 | 72 | 72 | 2.31% | 2.31% | 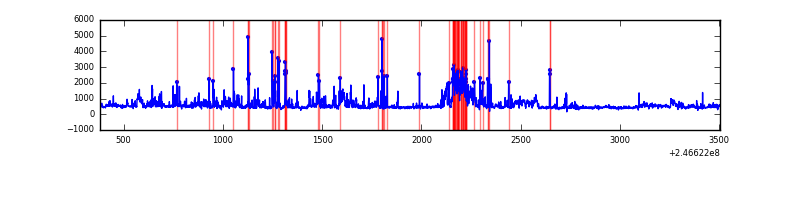 |
Top three noisy pixels from each quadrant. If the there are fewer than three noisy pixels in the level2.evt file, extra rows are filled as -1
| Pixel properties | Quadrant properties | ||||||
|---|---|---|---|---|---|---|---|
| Quadrant | DetID | PixID | Counts | Sigma | Mean | Median | Sigma |
| A | 8 | 5 | 2531006 | 49570.51 | 243 | 238 | 51.1 |
| A | 14 | 238 | 2049288 | 40135.03 | 243 | 238 | 51.1 |
| A | 8 | 15 | 44465 | 866.28 | 243 | 238 | 51.1 |
| B | 4 | 239 | 240840 | 3658.04 | 333 | 325 | 65.7 |
| B | 4 | 80 | 67875 | 1027.38 | 333 | 325 | 65.7 |
| B | 15 | 204 | 65760 | 995.21 | 333 | 325 | 65.7 |
| C | 4 | 254 | 97597 | 1274.77 | 324 | 325 | 76.3 |
| C | 13 | 61 | 2388 | 27.04 | 324 | 325 | 76.3 |
| C | 3 | 202 | 734 | 5.36 | 324 | 325 | 76.3 |
| D | 14 | 34 | 343977 | 4363.89 | 324 | 316 | 78.8 |
| D | 8 | 195 | 114955 | 1455.72 | 324 | 316 | 78.8 |
| D | 10 | 253 | 106581 | 1349.38 | 324 | 316 | 78.8 |
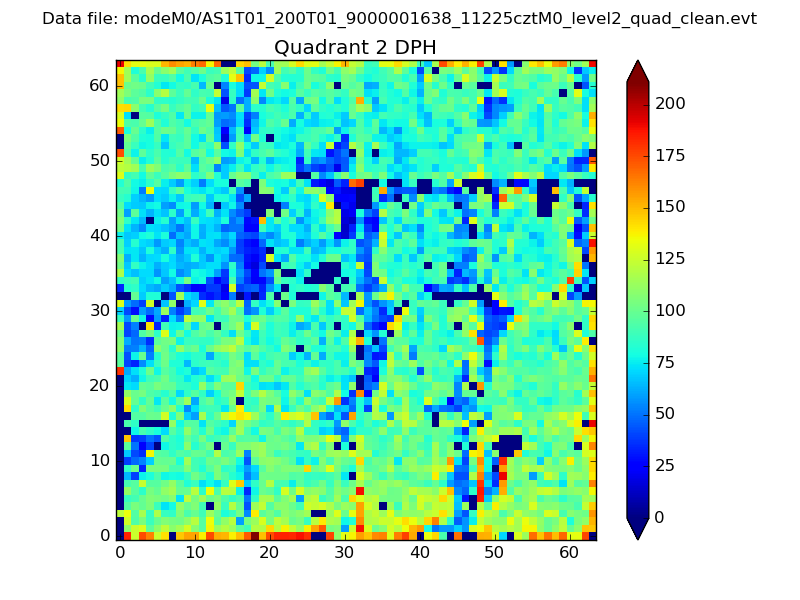
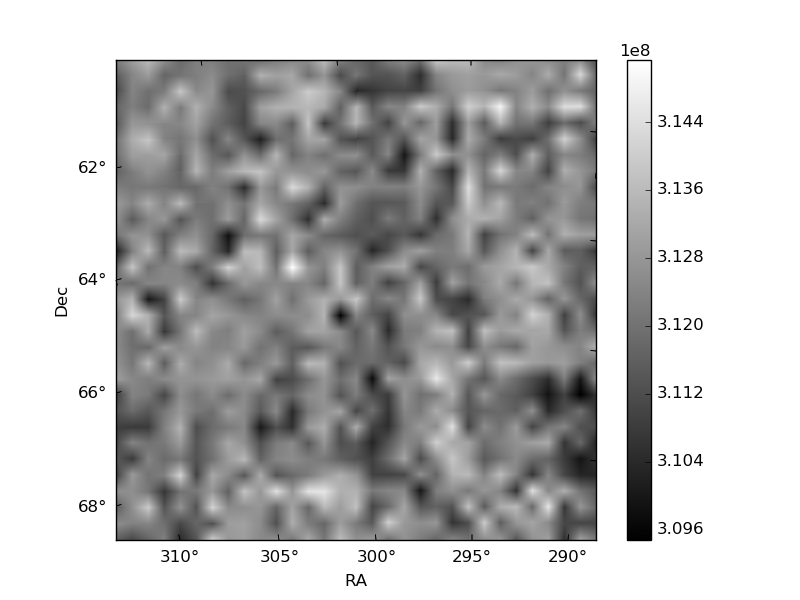
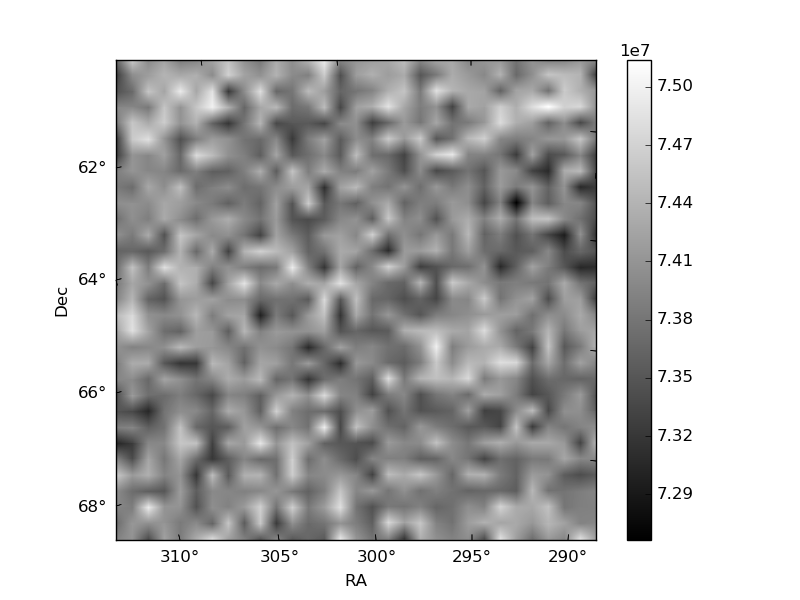
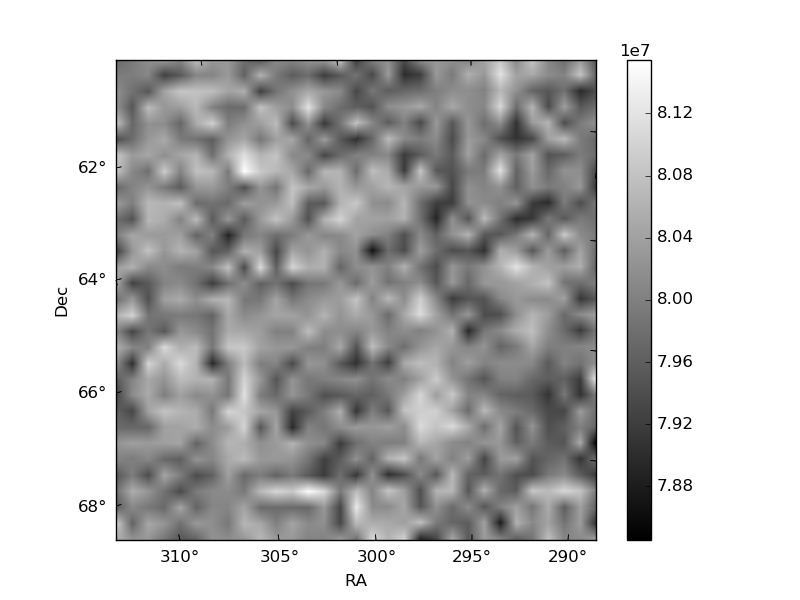
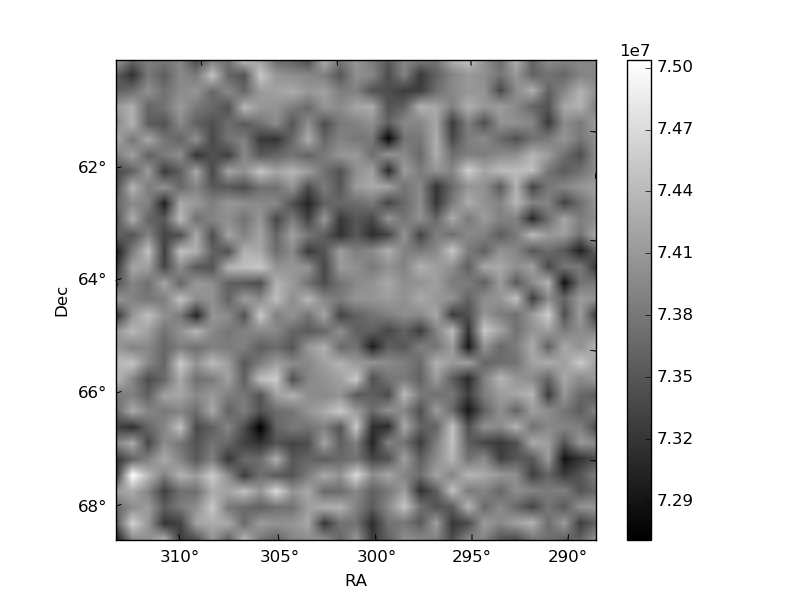
Histogram calculated using DETX and DETY for each event in the final _common_clean file
| Quadrant A | 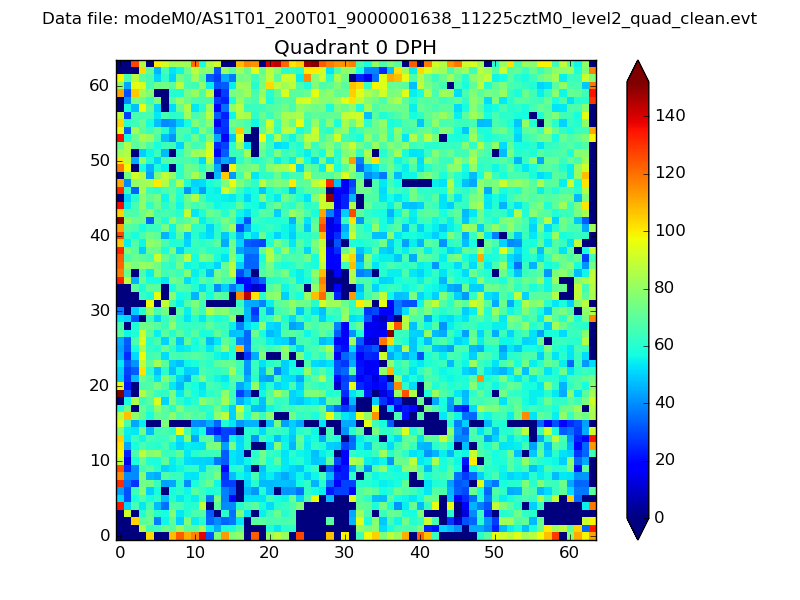 |
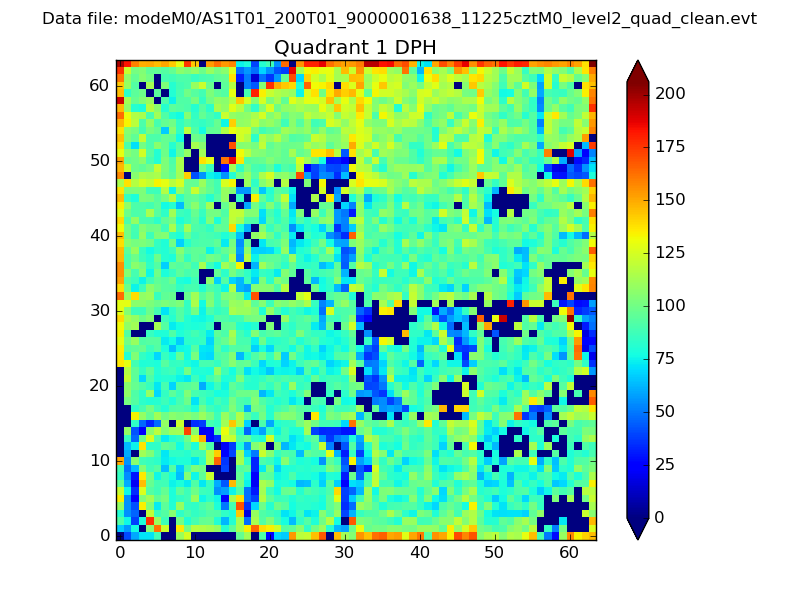 |
Quadrant B |
|---|---|---|---|
| Quadrant D | 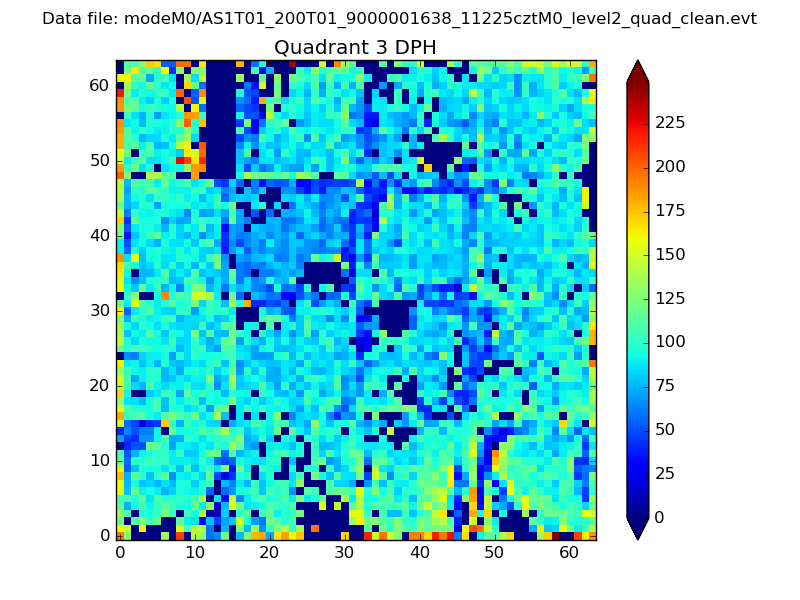 |
 |
Quadrant C |
| Plot type | Count rate plots | Images |
|---|---|---|
| Comparison with Poisson distribution Blue bars denote a histogram of data divided into 1 sec bins. Red curve is a Poisson curve with rate = median count rate of data. |
 |
 |
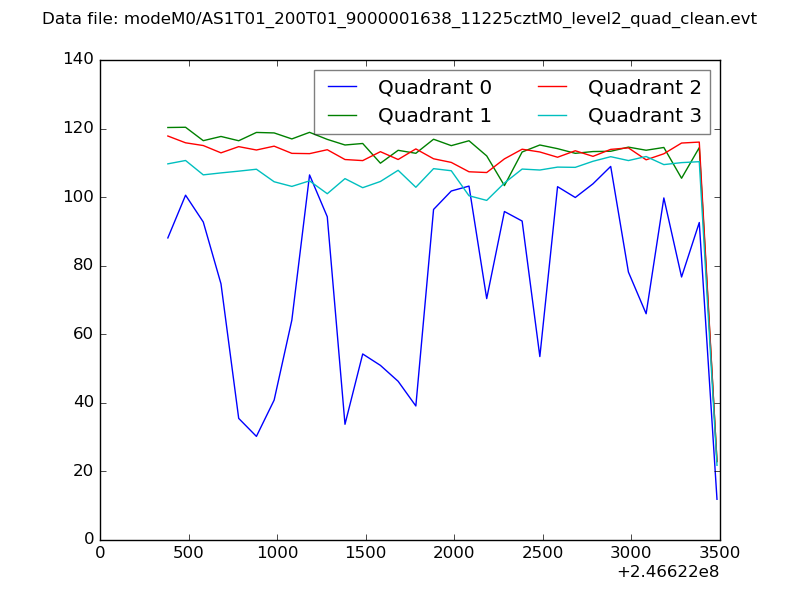
| Quadrant-wise count rates Data is divided into 100 sec bins |
 |
|
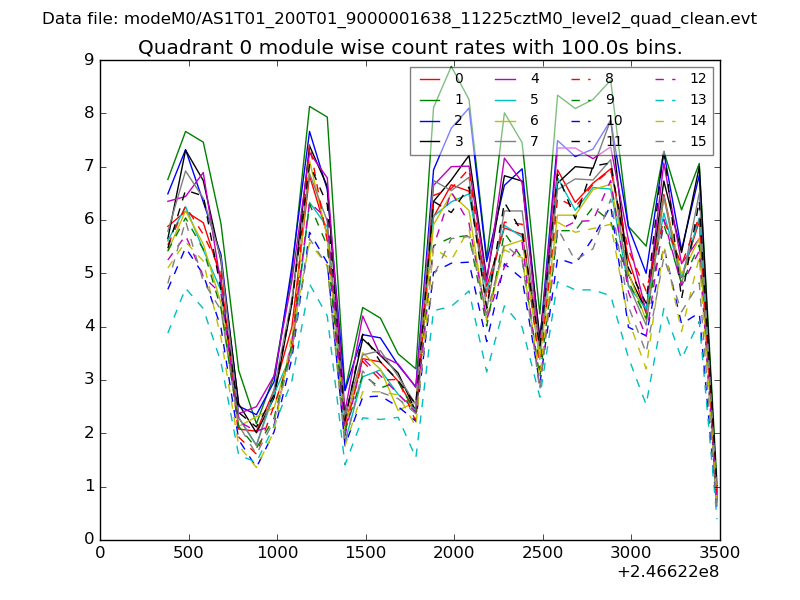
| Module-wise count rates for Quadrant A Data is divided into 100 sec bins |
 |
 |
| Module-wise count rates for Quadrant B Data is divided into 100 sec bins |
 |
 |
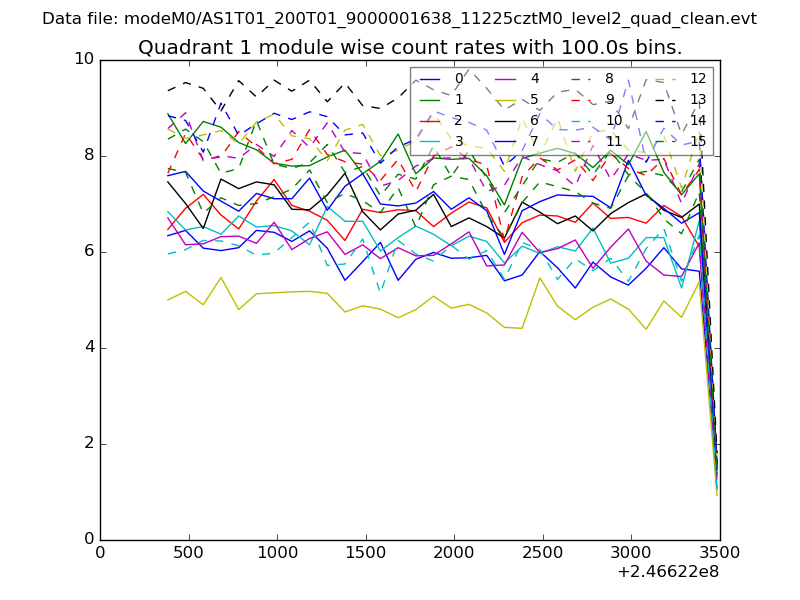
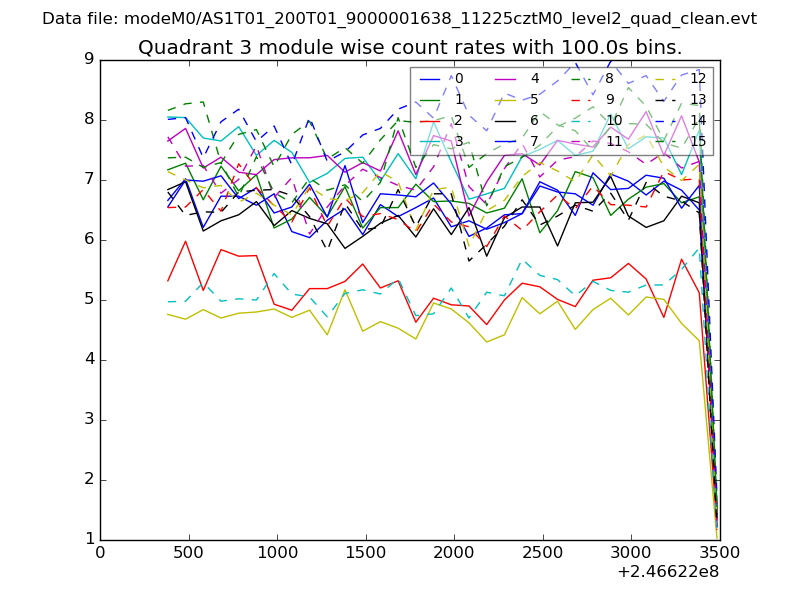
| Module-wise count rates for Quadrant C Data is divided into 100 sec bins |
 |
 |
| Module-wise count rates for Quadrant D Data is divided into 100 sec bins |
 |
 |
| Parameter | Plot |
|---|---|
| CZT HV Monitor | 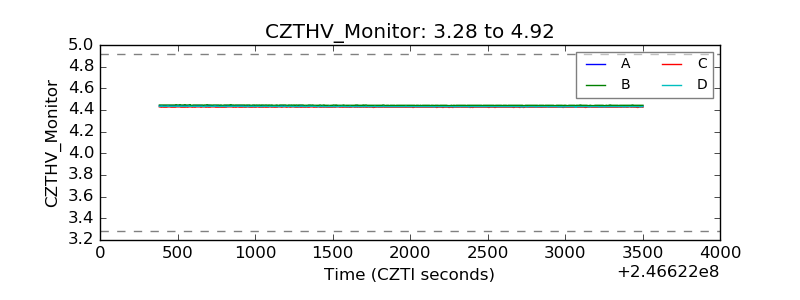 |
| D_VDD | 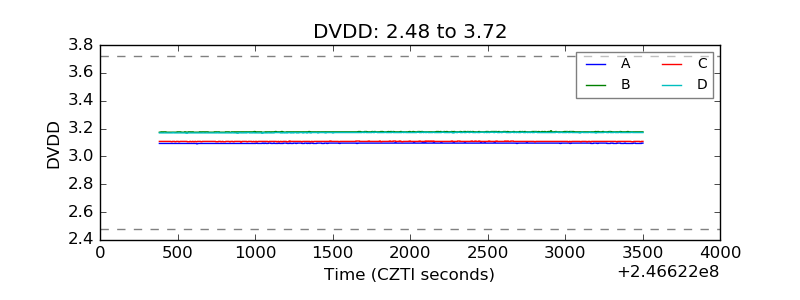 |
| Temperature 1 | 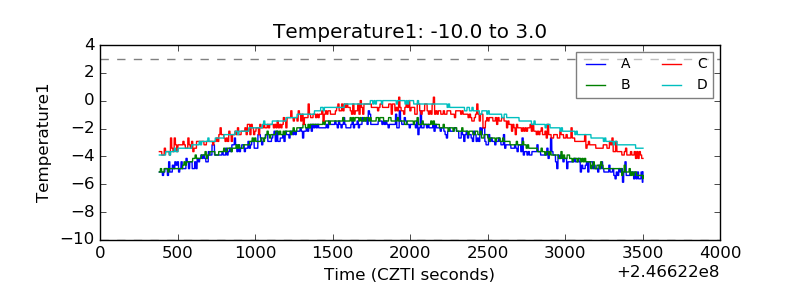 |
| Veto HV Monitor | 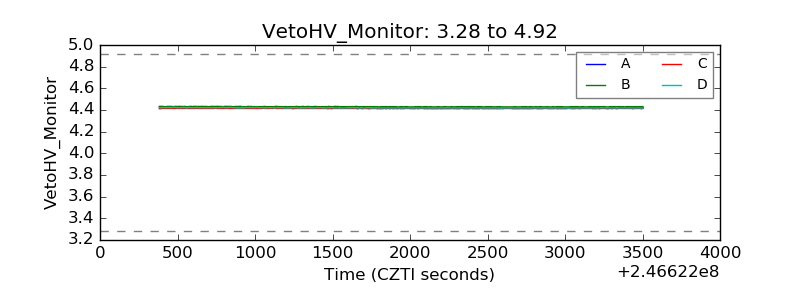 |
| Veto LLD | 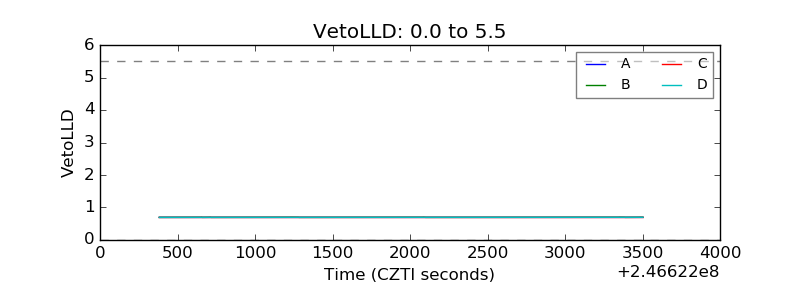 |
| Alpha Counter | 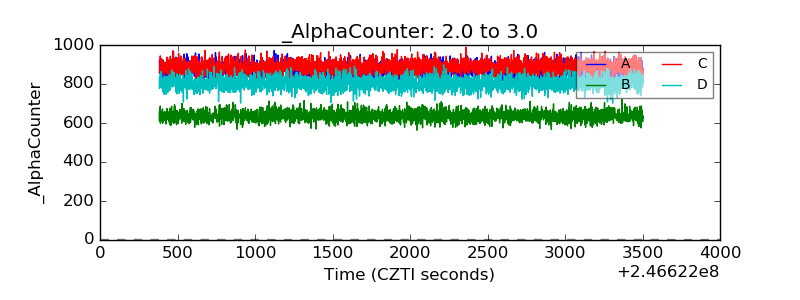 |
| _CPM_Rate | 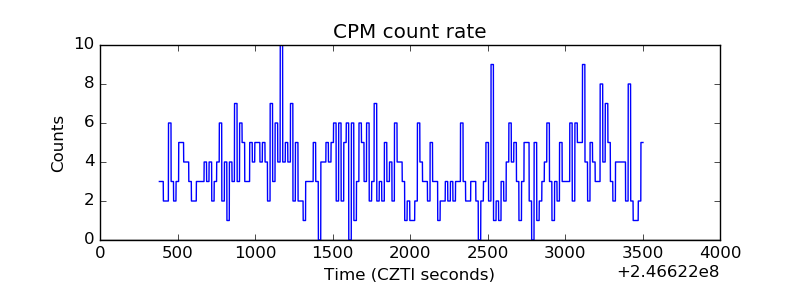 |
| CZT Counter | 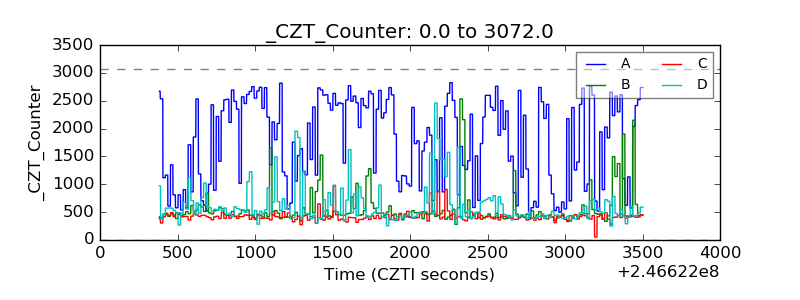 |
| +2.5 Volts monitor |  |
| +5 Volts monitor |  |
| _ROLL_ROT | 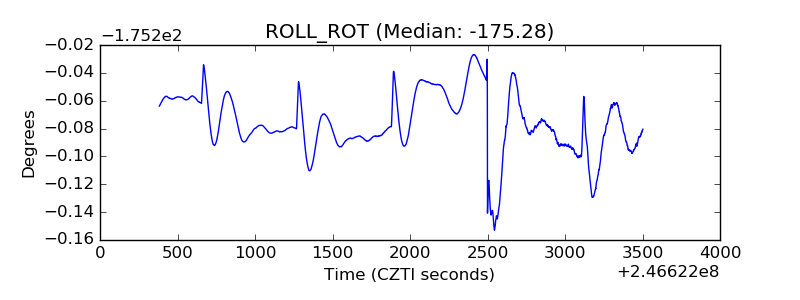 |
| _Roll_DEC | 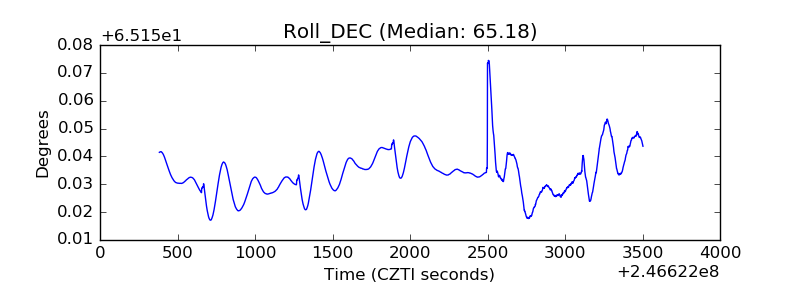 |
| _Roll_RA | 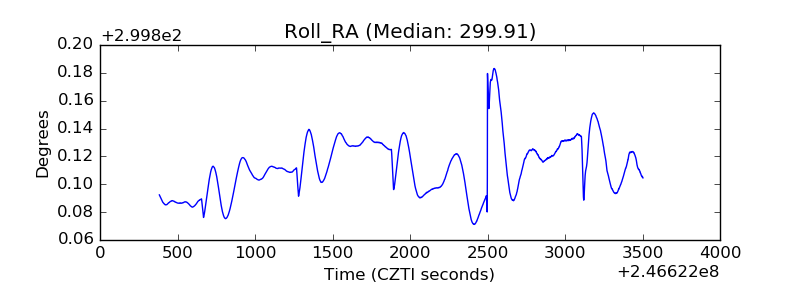 |
| Veto Counter | 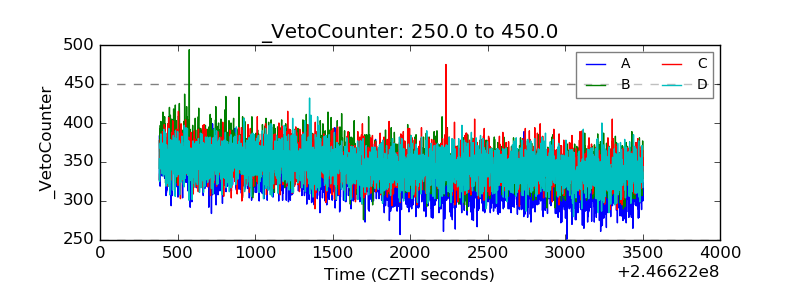 |