| Param | Original file | Final file |
|---|---|---|
| Filename | modeM0/AS1T01_200T01_9000001638_11226cztM0_level2.evt | modeM0/AS1T01_200T01_9000001638_11226cztM0_level2_quad_clean.evt |
| Size (bytes) | 1,558,621,440 | 272,880,000 |
| Size | 1.5 GB | 260.2 MB |
| Events in quadrant A | 18,123,535 | 1,665,747 |
| Events in quadrant B | 9,020,648 | 1,879,425 |
| Events in quadrant C | 7,476,552 | 1,894,519 |
| Events in quadrant D | 11,516,493 | 1,732,384 |
| Mode M9 | |||
|---|---|---|---|
| Quadrant | BADHDUFLAG | Total packets | Discarded packets |
| A | 0 | 20 | 0 |
| B | 0 | 20 | 0 |
| C | 0 | 20 | 0 |
| D | 0 | 20 | 0 |
| Mode SS | |||
|---|---|---|---|
| Quadrant | BADHDUFLAG | Total packets | Discarded packets |
| A | 0 | 324 | 0 |
| B | 0 | 324 | 0 |
| C | 0 | 324 | 0 |
| D | 0 | 324 | 0 |
| Mode M0 | |||
|---|---|---|---|
| Quadrant | BADHDUFLAG | Total packets | Discarded packets |
| A | 0 | 64797 | 4 |
| B | 0 | 37336 | 3 |
| C | 0 | 33745 | 3 |
| D | 0 | 44918 | 3 |
| Quadrant | Total seconds | Saturated seconds | Saturation percentage |
|---|---|---|---|
| A | 15811 | 3442 | 21.769654% |
| B | 15811 | 456 | 2.884068% |
| C | 15811 | 262 | 1.657074% |
| D | 15811 | 1555 | 9.834925% |
Noise dominated data is calculated using 1-second bins in cleaned event files. If a bin has >2000 counts, and if more than 50% of those come from <1% of pixels, then it is considered to be noise-dominated and hence unusable.
| Quadrant | # 1 sec bins | Bins with >0 counts | Bins with >2000 counts | High rate bins dominated by noise | Noise dominated (total time) | Noise dominated (detector-on time) | Marked lightcurve |
|---|---|---|---|---|---|---|---|
| A | 17891 | 15814 | 2321 | 2321 | 12.97% | 14.68% | 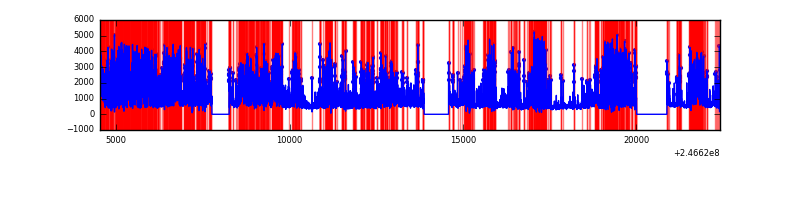 |
| B | 17891 | 15814 | 207 | 207 | 1.16% | 1.31% | 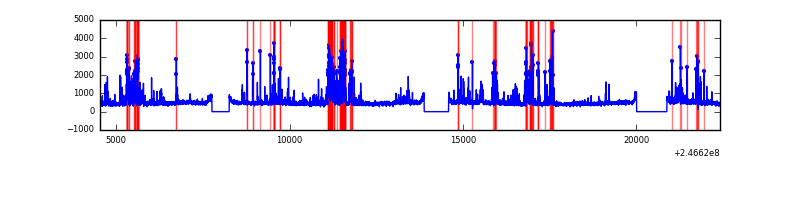 |
| C | 17891 | 15814 | 80 | 80 | 0.45% | 0.51% | 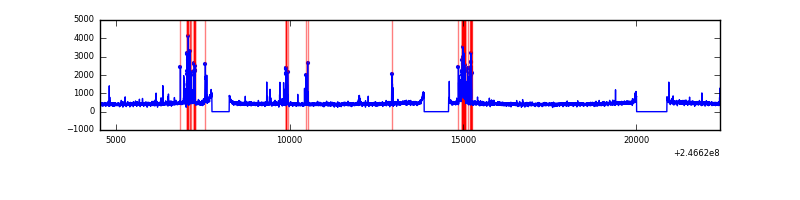 |
| D | 17891 | 15814 | 1033 | 1033 | 5.77% | 6.53% | 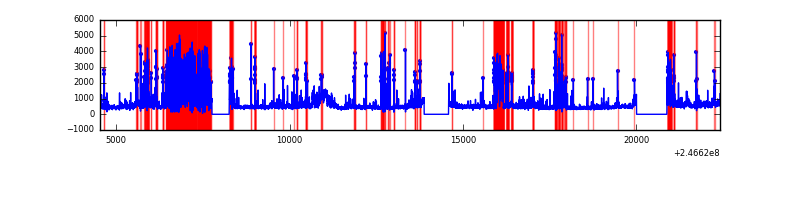 |
Top three noisy pixels from each quadrant. If the there are fewer than three noisy pixels in the level2.evt file, extra rows are filled as -1
| Pixel properties | Quadrant properties | ||||||
|---|---|---|---|---|---|---|---|
| Quadrant | DetID | PixID | Counts | Sigma | Mean | Median | Sigma |
| A | 14 | 238 | 6287430 | 19033.05 | 1637 | 1603 | 330.3 |
| A | 8 | 5 | 4761004 | 14411.14 | 1637 | 1603 | 330.3 |
| A | 15 | 174 | 317075 | 955.23 | 1637 | 1603 | 330.3 |
| B | 4 | 239 | 1652876 | 4855.44 | 1794 | 1746 | 340.1 |
| B | 15 | 204 | 222841 | 650.17 | 1794 | 1746 | 340.1 |
| B | 4 | 80 | 74262 | 213.25 | 1794 | 1746 | 340.1 |
| C | 4 | 254 | 594199 | 1446.31 | 1764 | 1767 | 409.6 |
| C | 13 | 61 | 12970 | 27.35 | 1764 | 1767 | 409.6 |
| C | 14 | 234 | 5357 | 8.76 | 1764 | 1767 | 409.6 |
| D | 1 | 52 | 2954950 | 7352.06 | 1681 | 1633 | 401.7 |
| D | 8 | 195 | 398399 | 987.72 | 1681 | 1633 | 401.7 |
| D | 10 | 253 | 383956 | 951.76 | 1681 | 1633 | 401.7 |
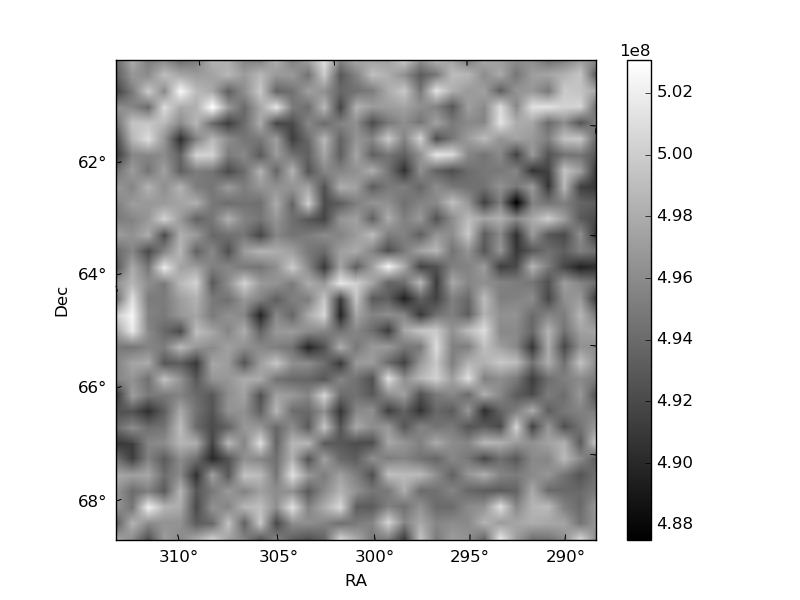
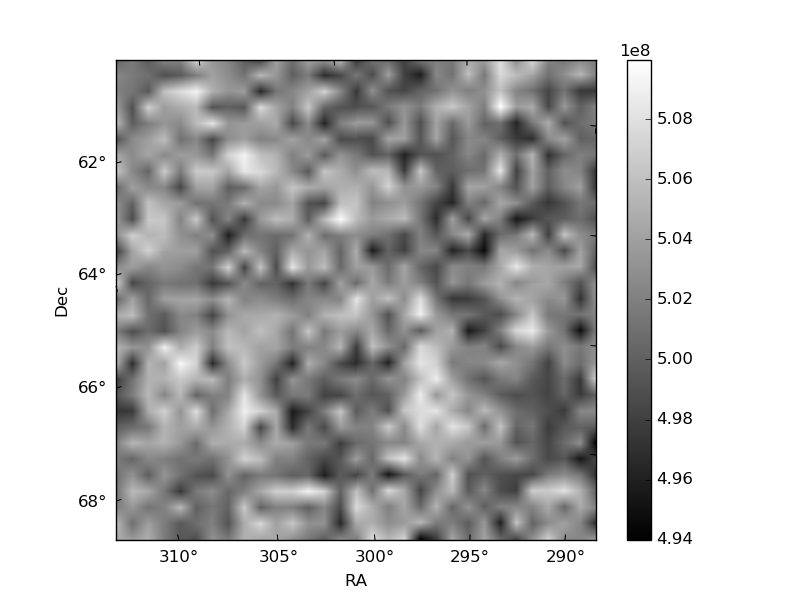
Histogram calculated using DETX and DETY for each event in the final _common_clean file
| Quadrant A |  |
 |
Quadrant B |
|---|---|---|---|
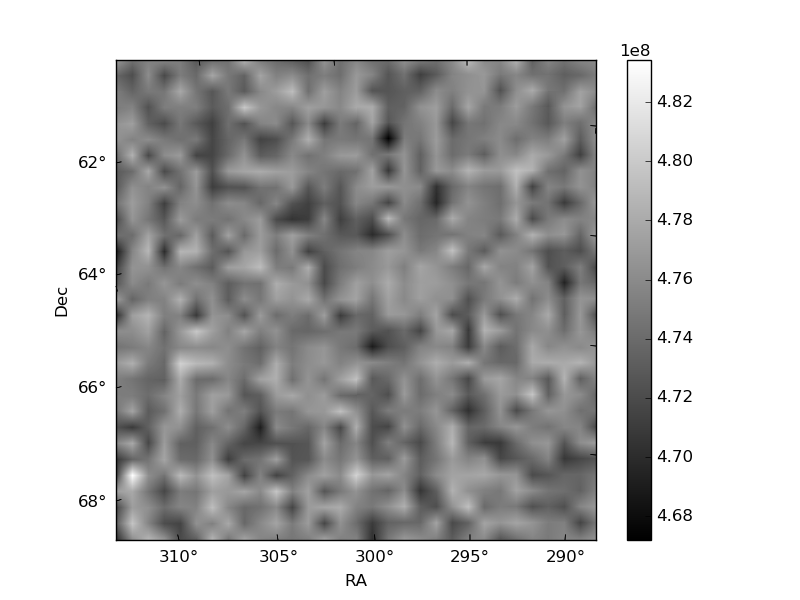
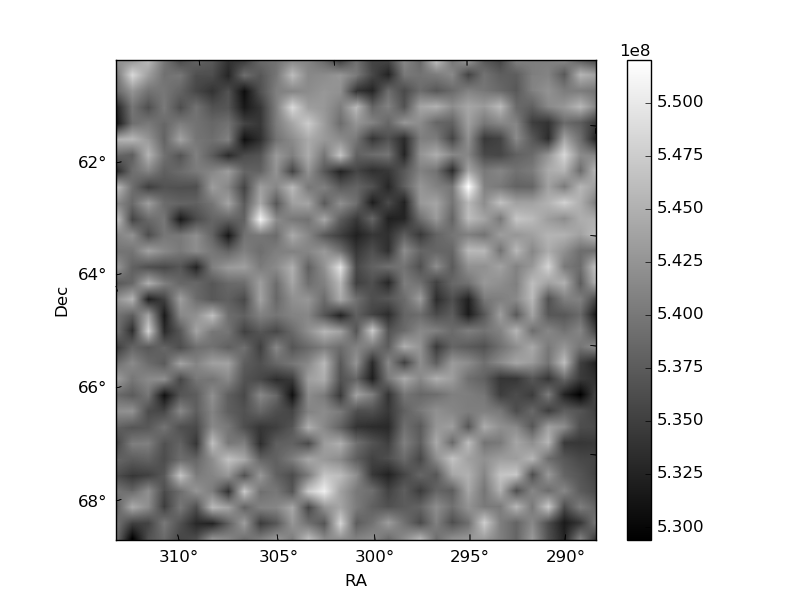
| Quadrant D |  |
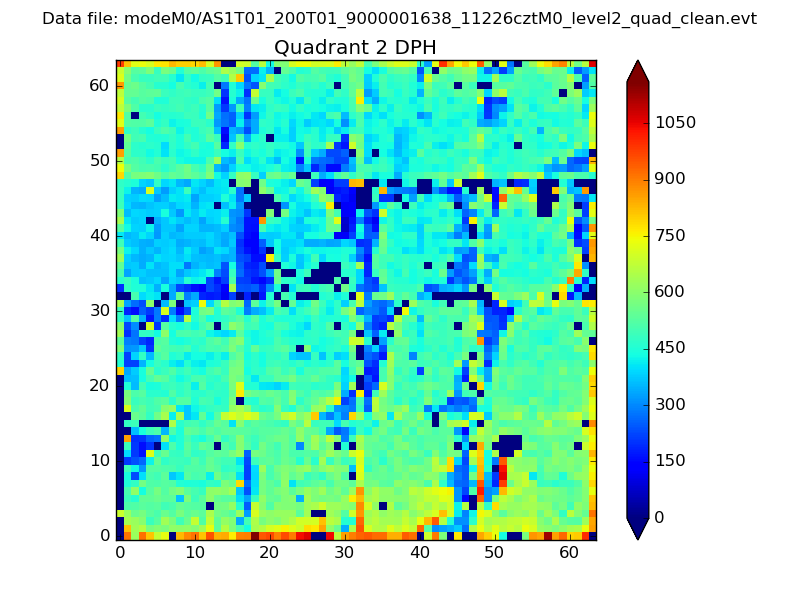 |
Quadrant C |
| Plot type | Count rate plots | Images |
|---|---|---|
| Comparison with Poisson distribution Blue bars denote a histogram of data divided into 1 sec bins. Red curve is a Poisson curve with rate = median count rate of data. |
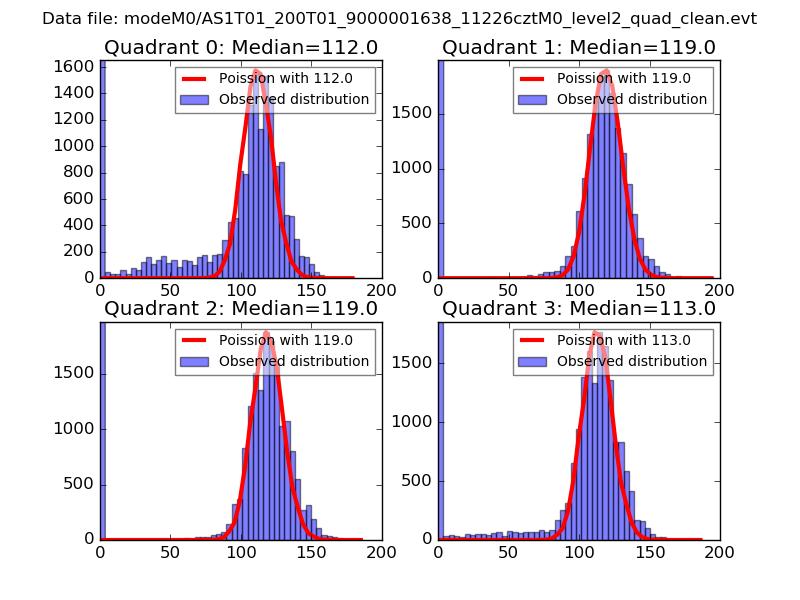 |
 |
| Quadrant-wise count rates Data is divided into 100 sec bins |
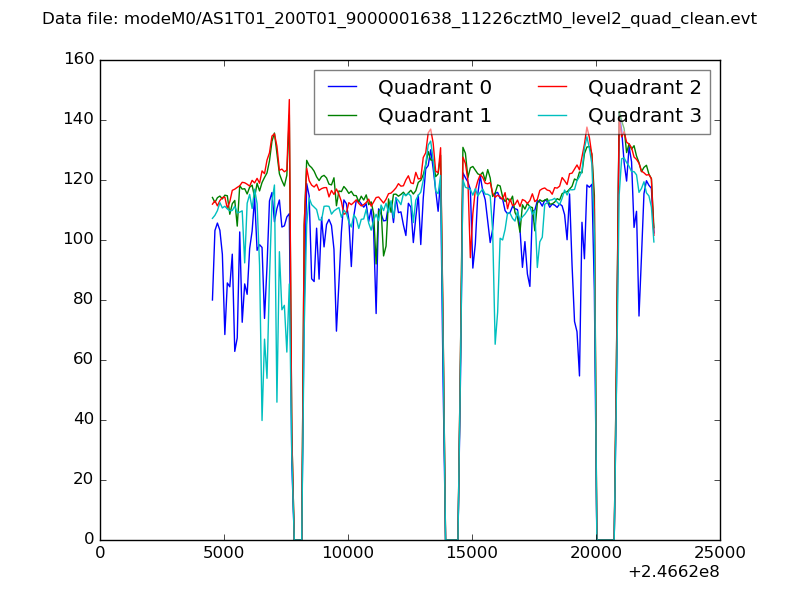 |
|
| Module-wise count rates for Quadrant A Data is divided into 100 sec bins |
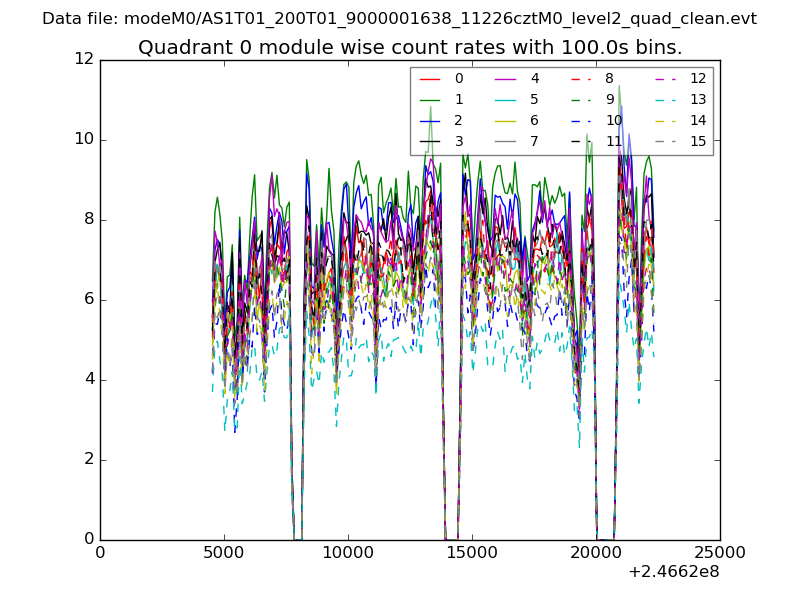 |
 |
| Module-wise count rates for Quadrant B Data is divided into 100 sec bins |
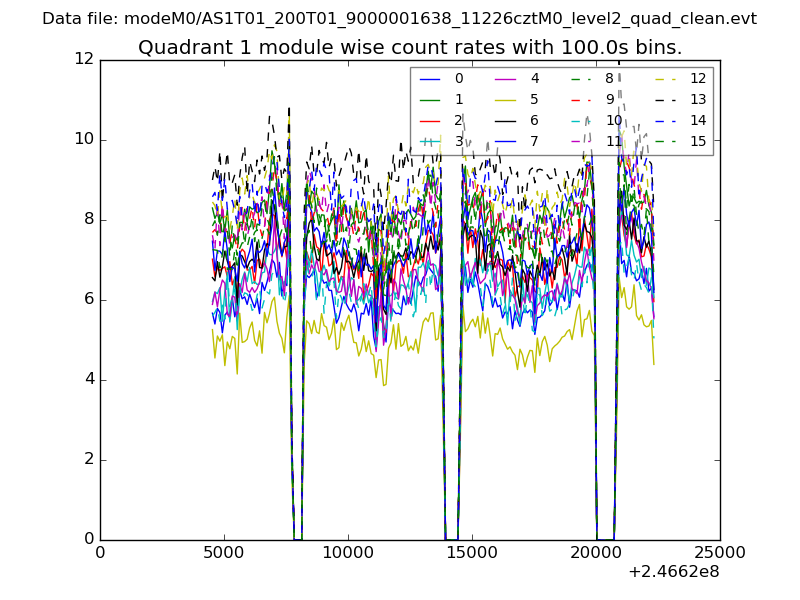 |
 |
| Module-wise count rates for Quadrant C Data is divided into 100 sec bins |
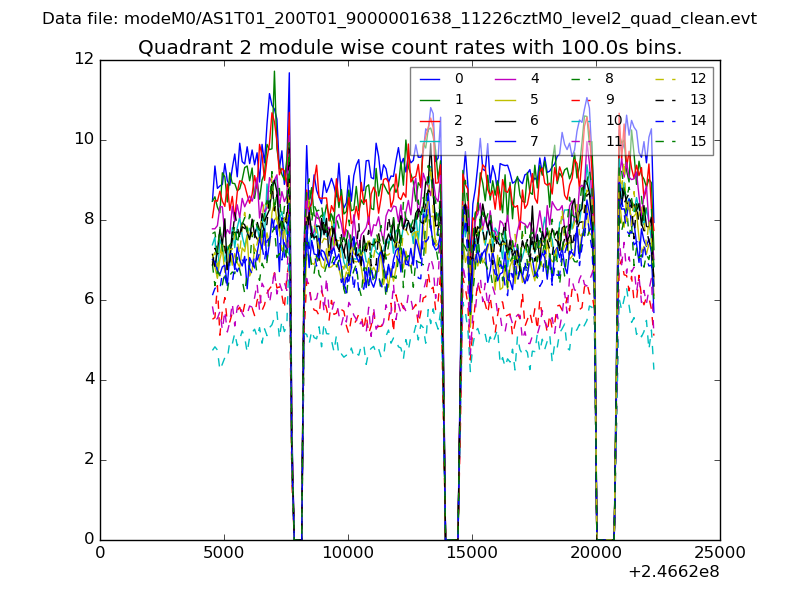 |
 |
| Module-wise count rates for Quadrant D Data is divided into 100 sec bins |
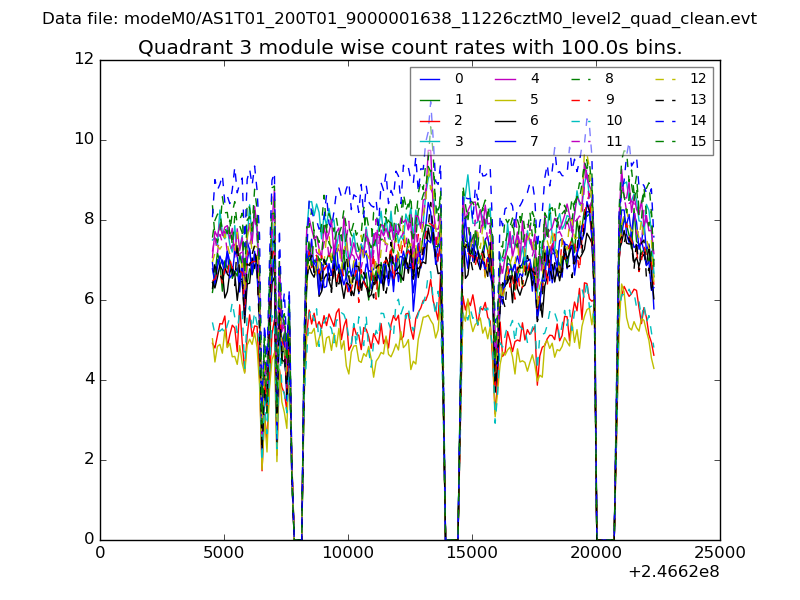 |
 |
| Parameter | Plot |
|---|---|
| CZT HV Monitor |  |
| D_VDD | 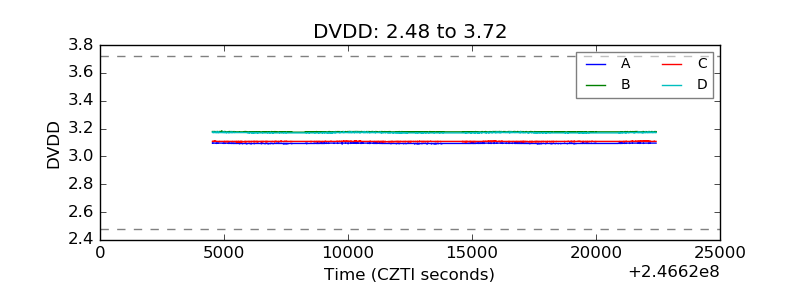 |
| Temperature 1 |  |
| Veto HV Monitor | 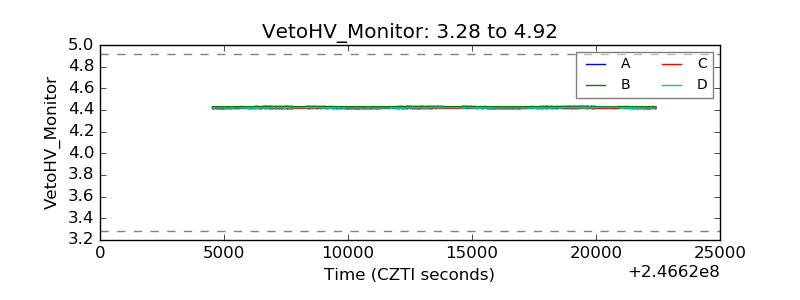 |
| Veto LLD | 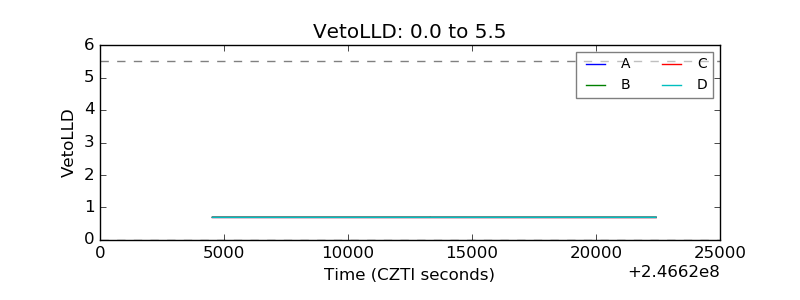 |
| Alpha Counter | 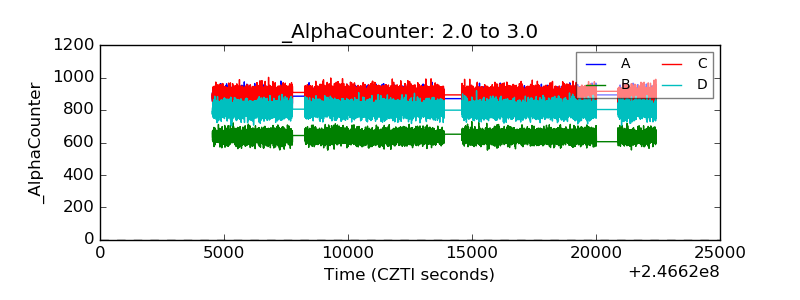 |
| _CPM_Rate | 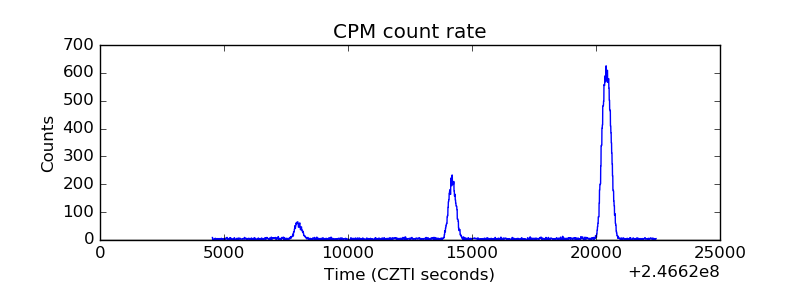 |
| CZT Counter | 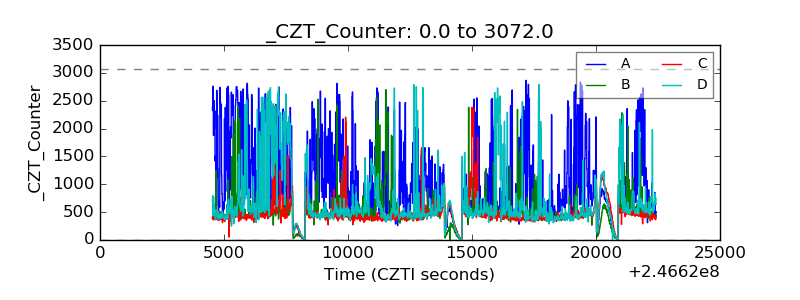 |
| +2.5 Volts monitor |  |
| +5 Volts monitor | 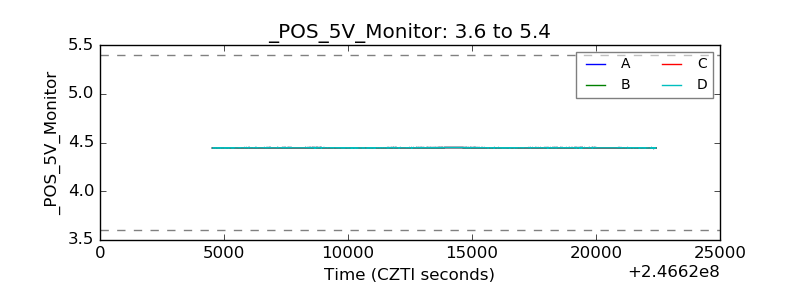 |
| _ROLL_ROT | 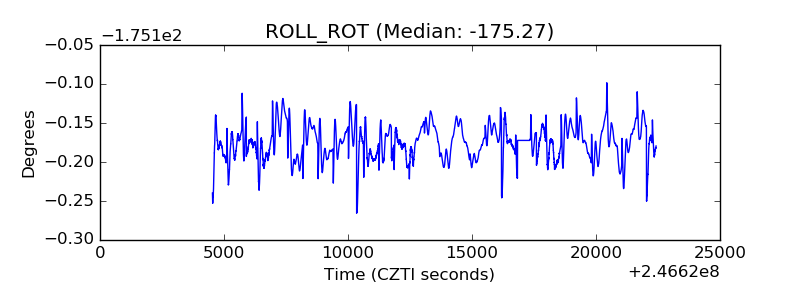 |
| _Roll_DEC | 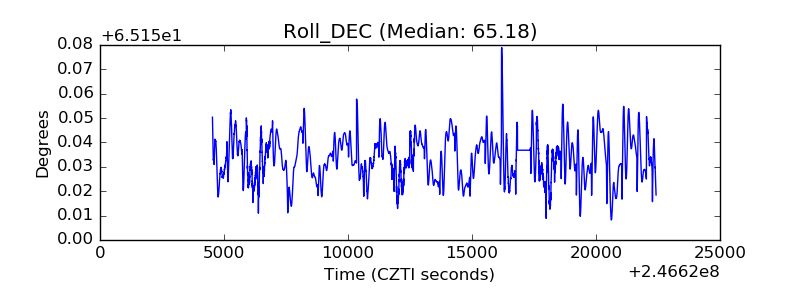 |
| _Roll_RA | 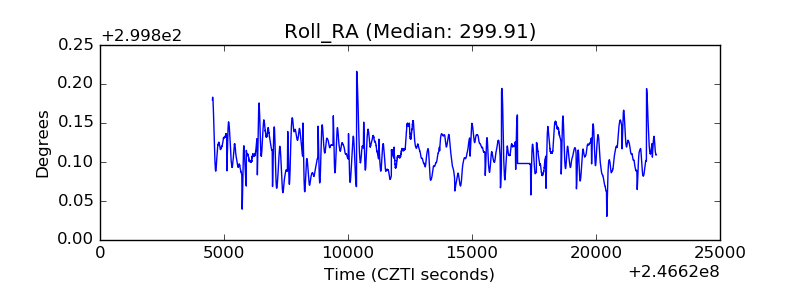 |
| Veto Counter | 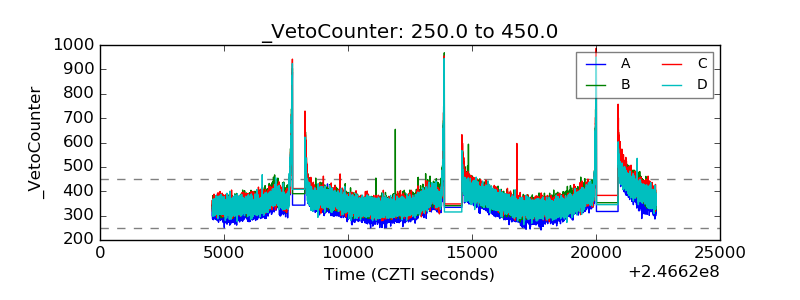 |