| Param | Original file | Final file |
|---|---|---|
| Filename | modeM0/AS1T01_200T01_9000001638_11227cztM0_level2.evt | modeM0/AS1T01_200T01_9000001638_11227cztM0_level2_quad_clean.evt |
| Size (bytes) | 632,358,720 | 115,496,640 |
| Size | 603.1 MB | 110.1 MB |
| Events in quadrant A | 7,049,410 | 715,218 |
| Events in quadrant B | 3,761,404 | 783,579 |
| Events in quadrant C | 3,096,889 | 796,008 |
| Events in quadrant D | 4,808,827 | 754,586 |
| Mode M9 | |||
|---|---|---|---|
| Quadrant | BADHDUFLAG | Total packets | Discarded packets |
| A | 0 | 10 | 0 |
| B | 0 | 10 | 0 |
| C | 0 | 10 | 0 |
| D | 0 | 10 | 0 |
| Mode SS | |||
|---|---|---|---|
| Quadrant | BADHDUFLAG | Total packets | Discarded packets |
| A | 0 | 130 | 0 |
| B | 0 | 130 | 0 |
| C | 0 | 130 | 0 |
| D | 0 | 130 | 0 |
| Mode M0 | |||
|---|---|---|---|
| Quadrant | BADHDUFLAG | Total packets | Discarded packets |
| A | 0 | 25343 | 2 |
| B | 0 | 15508 | 1 |
| C | 0 | 13835 | 1 |
| D | 0 | 18791 | 1 |
| Quadrant | Total seconds | Saturated seconds | Saturation percentage |
|---|---|---|---|
| A | 6423 | 1173 | 18.262494% |
| B | 6423 | 200 | 3.113810% |
| C | 6423 | 99 | 1.541336% |
| D | 6423 | 158 | 2.459910% |
Noise dominated data is calculated using 1-second bins in cleaned event files. If a bin has >2000 counts, and if more than 50% of those come from <1% of pixels, then it is considered to be noise-dominated and hence unusable.
| Quadrant | # 1 sec bins | Bins with >0 counts | Bins with >2000 counts | High rate bins dominated by noise | Noise dominated (total time) | Noise dominated (detector-on time) | Marked lightcurve |
|---|---|---|---|---|---|---|---|
| A | 7428 | 6424 | 822 | 822 | 11.07% | 12.80% | 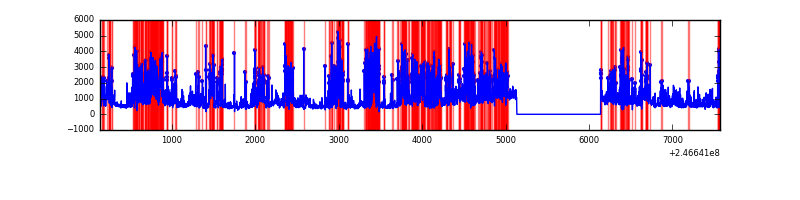 |
| B | 7428 | 6424 | 122 | 122 | 1.64% | 1.90% | 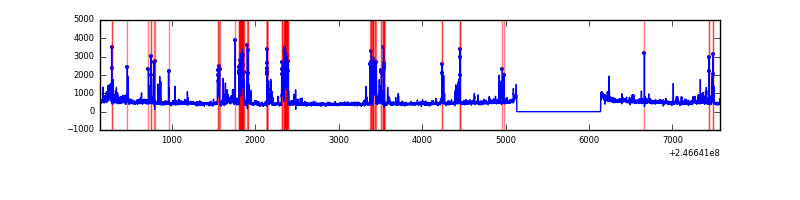 |
| C | 7428 | 6424 | 56 | 56 | 0.75% | 0.87% | 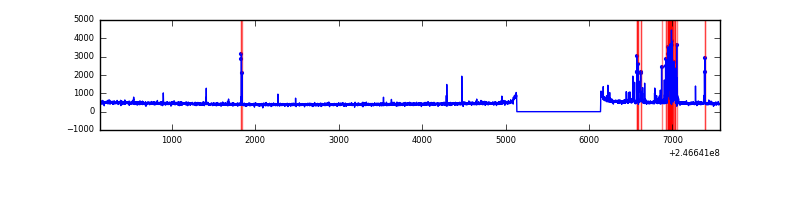 |
| D | 7428 | 6424 | 120 | 120 | 1.62% | 1.87% | 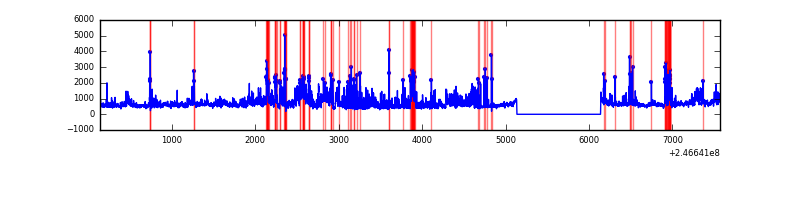 |
Top three noisy pixels from each quadrant. If the there are fewer than three noisy pixels in the level2.evt file, extra rows are filled as -1
| Pixel properties | Quadrant properties | ||||||
|---|---|---|---|---|---|---|---|
| Quadrant | DetID | PixID | Counts | Sigma | Mean | Median | Sigma |
| A | 8 | 5 | 3042129 | 21728.8 | 683 | 667 | 140.0 |
| A | 14 | 238 | 855436 | 6106.64 | 683 | 667 | 140.0 |
| A | 15 | 174 | 341574 | 2435.51 | 683 | 667 | 140.0 |
| B | 4 | 239 | 700476 | 5067.28 | 732 | 715 | 138.1 |
| B | 15 | 204 | 97016 | 697.36 | 732 | 715 | 138.1 |
| B | 4 | 80 | 37292 | 264.87 | 732 | 715 | 138.1 |
| C | 4 | 254 | 258296 | 1526.61 | 724 | 726 | 168.7 |
| C | 14 | 234 | 15182 | 85.68 | 724 | 726 | 168.7 |
| C | 13 | 61 | 5511 | 28.36 | 724 | 726 | 168.7 |
| D | 12 | 157 | 887468 | 5128.88 | 717 | 697 | 172.9 |
| D | 8 | 195 | 400959 | 2315.02 | 717 | 697 | 172.9 |
| D | 1 | 52 | 297702 | 1717.81 | 717 | 697 | 172.9 |
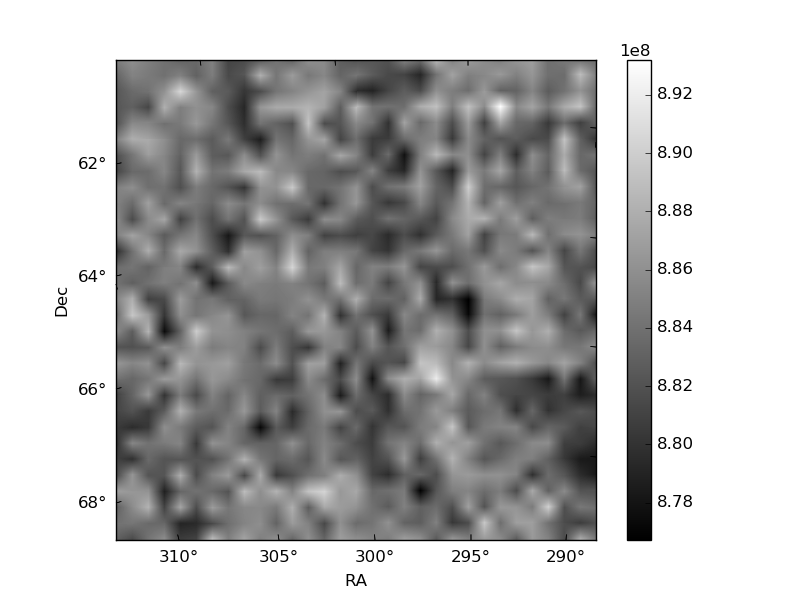
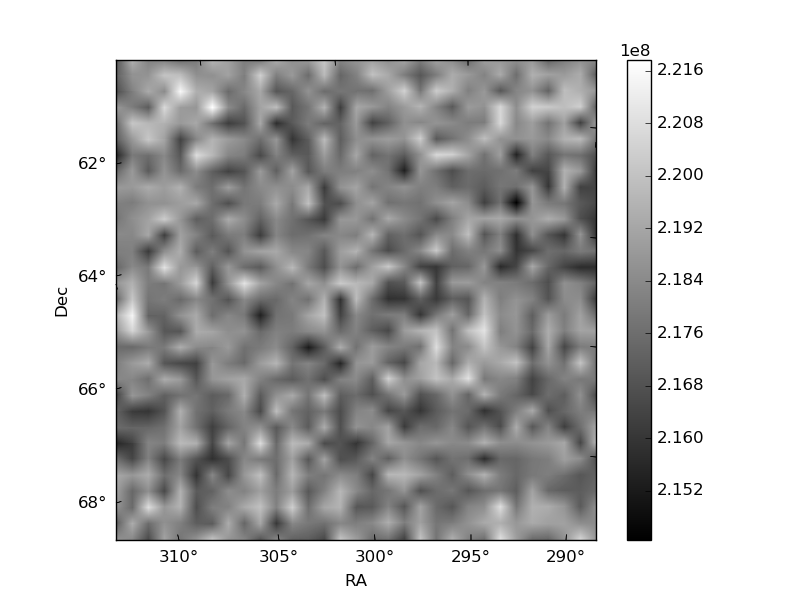
Histogram calculated using DETX and DETY for each event in the final _common_clean file
| Quadrant A | 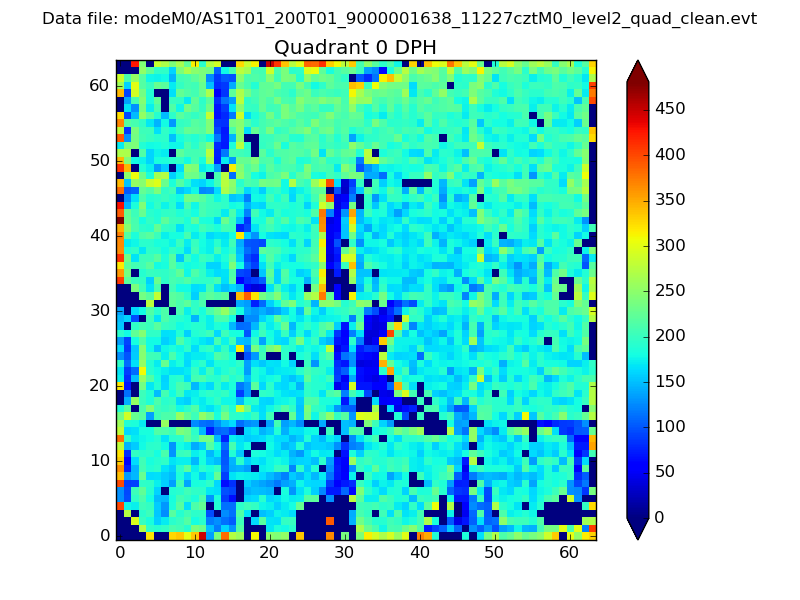 |
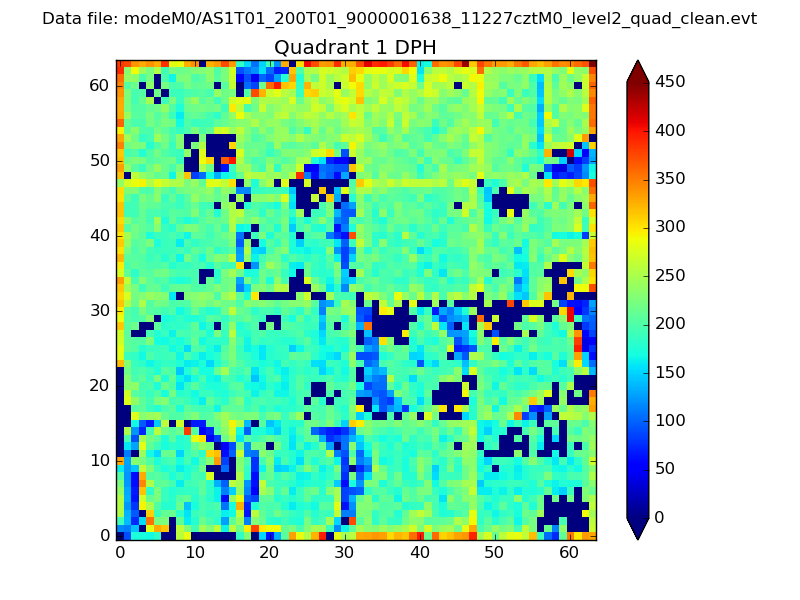 |
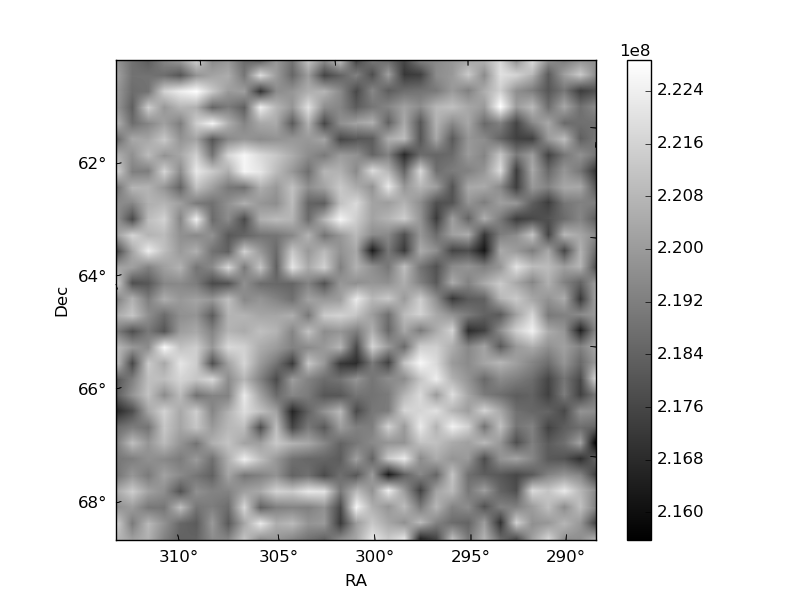
Quadrant B |
|---|---|---|---|
| Quadrant D | 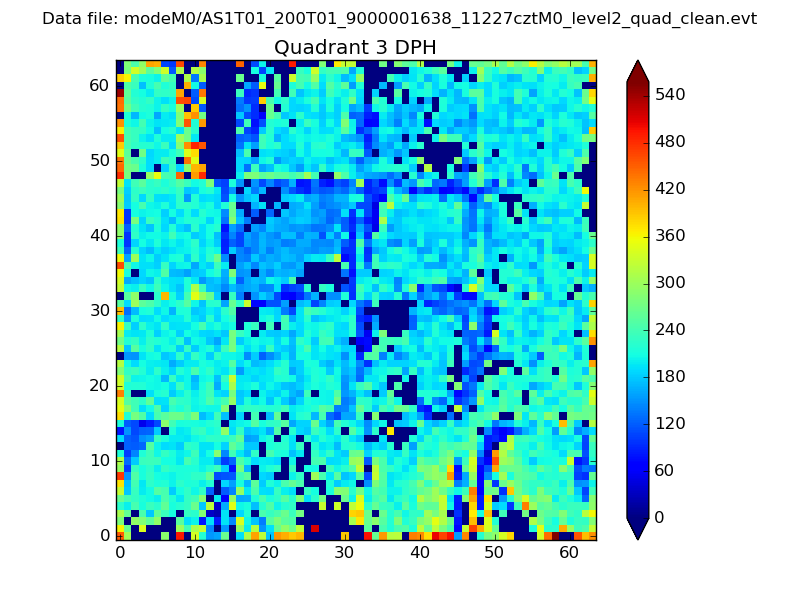 |
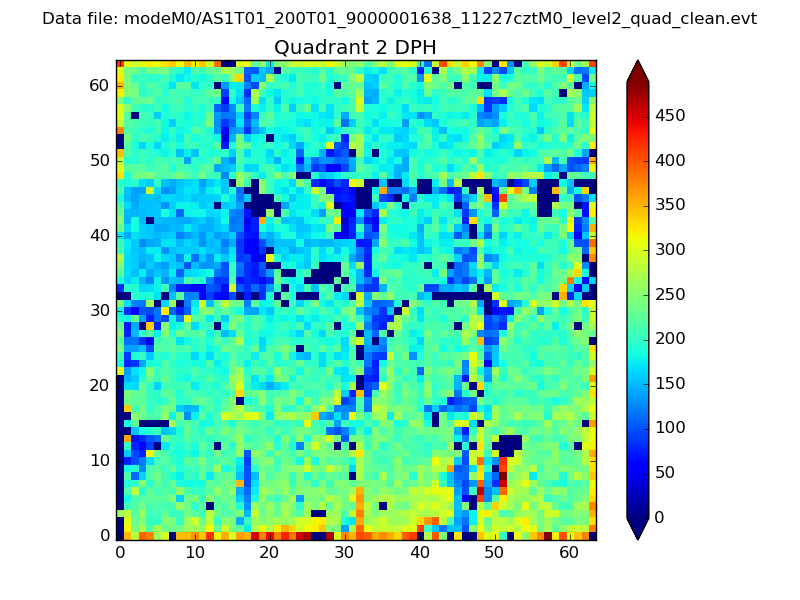 |
Quadrant C |
| Plot type | Count rate plots | Images |
|---|---|---|
| Comparison with Poisson distribution Blue bars denote a histogram of data divided into 1 sec bins. Red curve is a Poisson curve with rate = median count rate of data. |
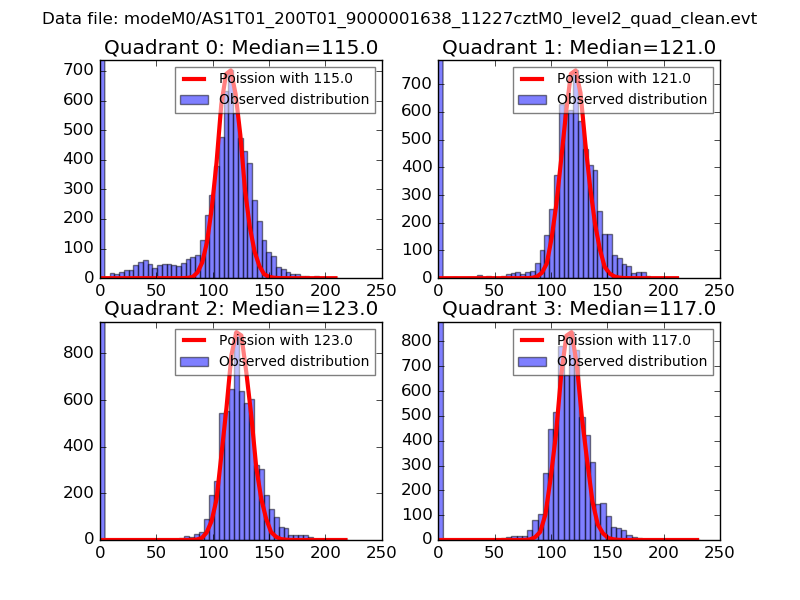 |
 |
| Quadrant-wise count rates Data is divided into 100 sec bins |
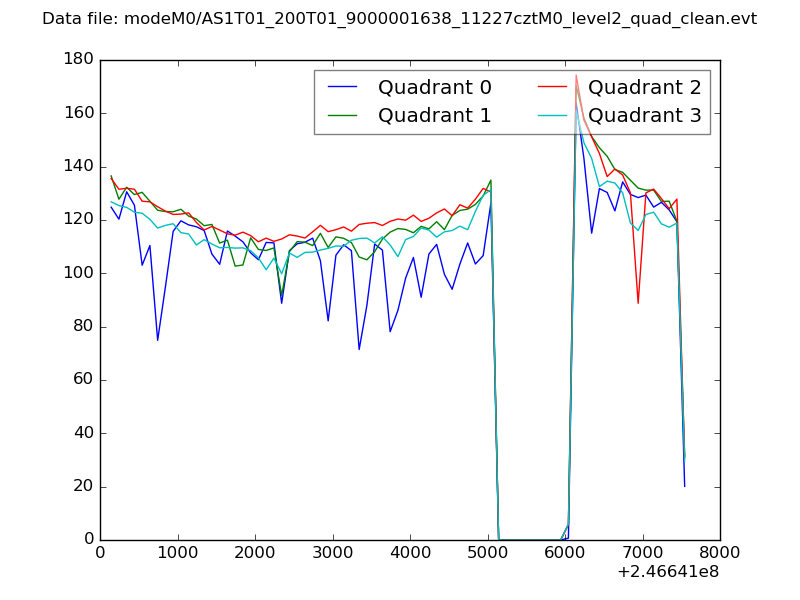 |
|
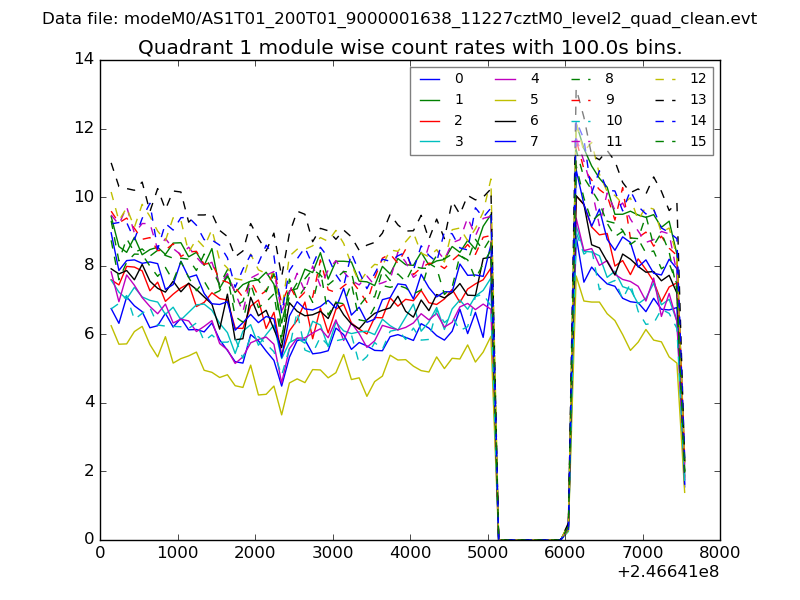
| Module-wise count rates for Quadrant A Data is divided into 100 sec bins |
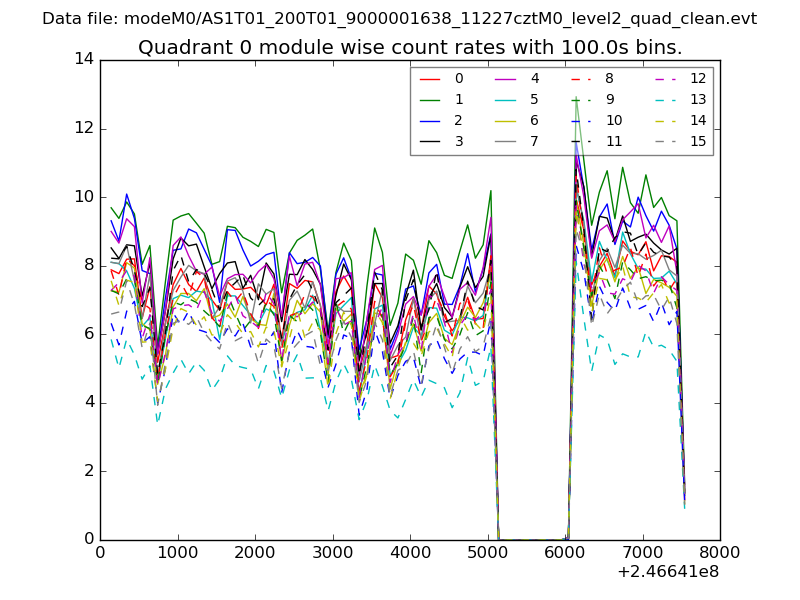 |
 |
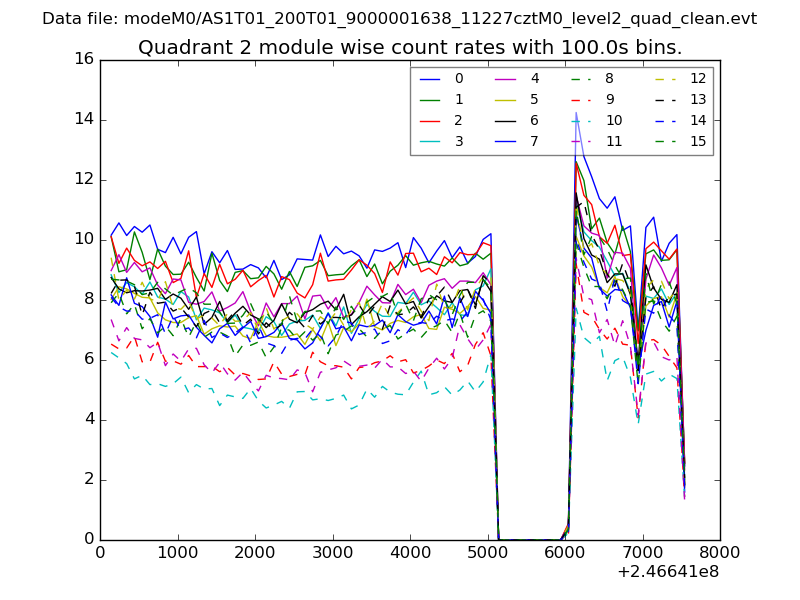
| Module-wise count rates for Quadrant B Data is divided into 100 sec bins |
 |
 |
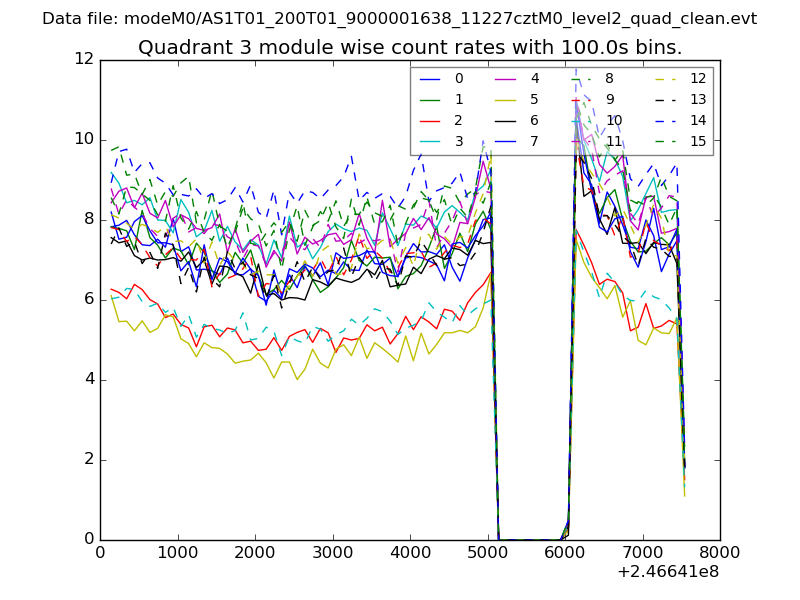
| Module-wise count rates for Quadrant C Data is divided into 100 sec bins |
 |
 |
| Module-wise count rates for Quadrant D Data is divided into 100 sec bins |
 |
 |
| Parameter | Plot |
|---|---|
| CZT HV Monitor | 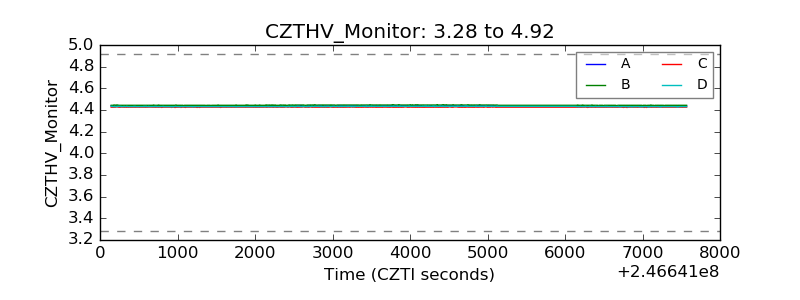 |
| D_VDD | 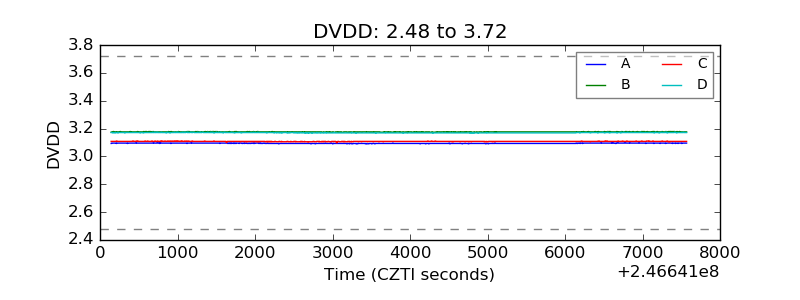 |
| Temperature 1 |  |
| Veto HV Monitor | 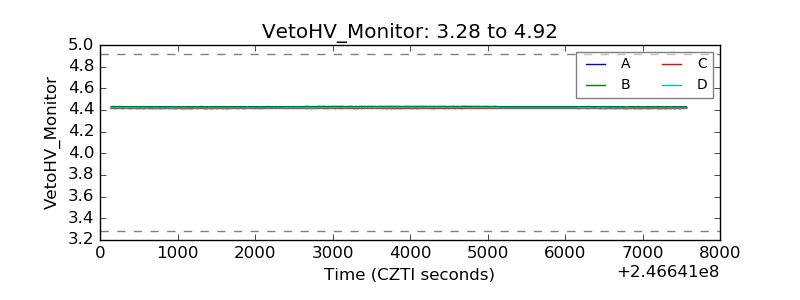 |
| Veto LLD | 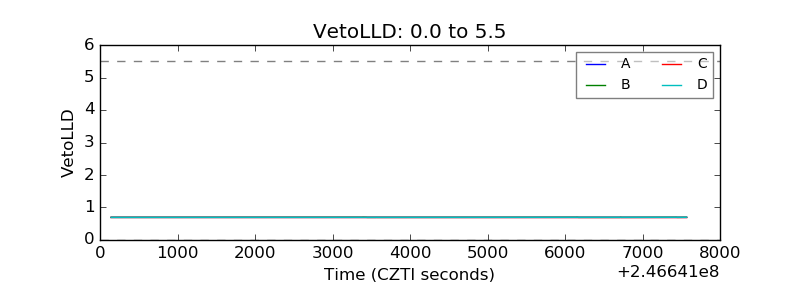 |
| Alpha Counter | 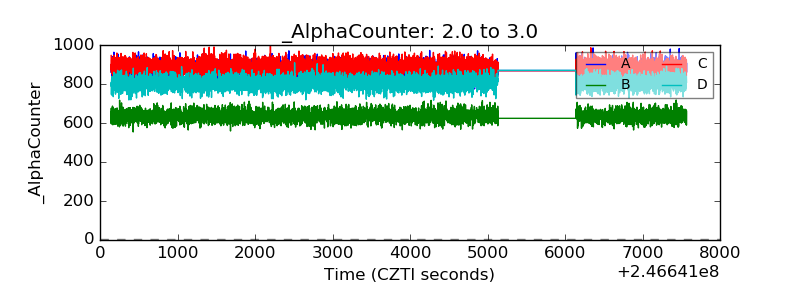 |
| _CPM_Rate | 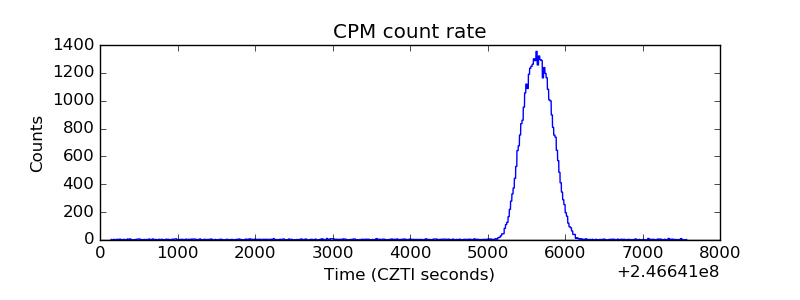 |
| CZT Counter | 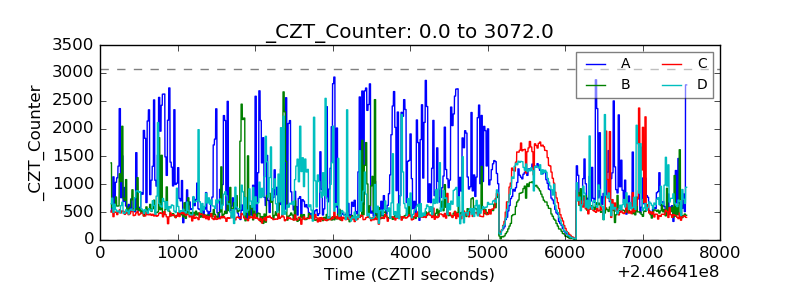 |
| +2.5 Volts monitor |  |
| +5 Volts monitor |  |
| _ROLL_ROT | 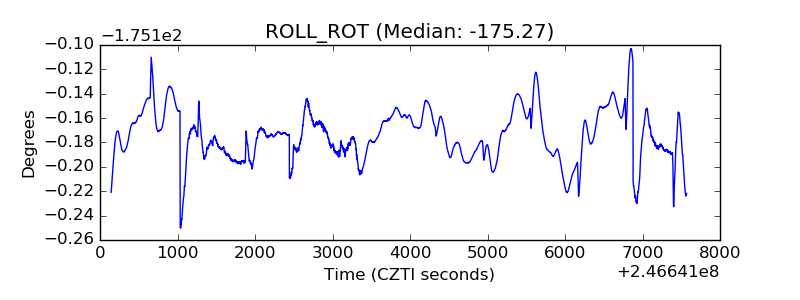 |
| _Roll_DEC | 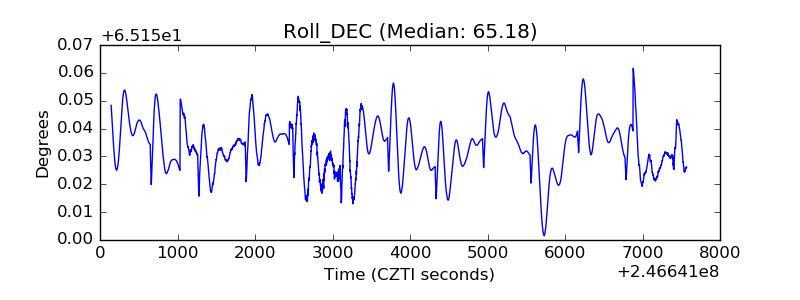 |
| _Roll_RA | 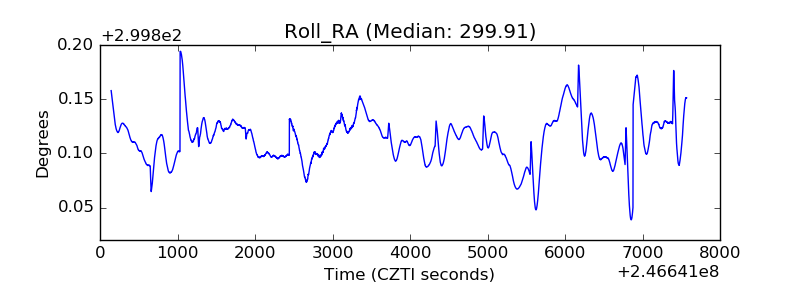 |
| Veto Counter | 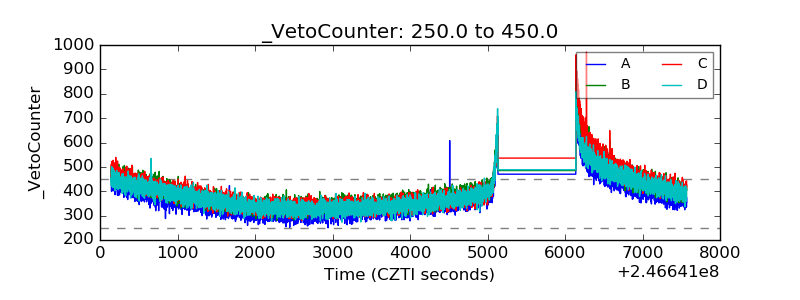 |