| Param | Original file | Final file |
|---|---|---|
| Filename | modeM0/AS1T01_200T01_9000001638_11229cztM0_level2.evt | modeM0/AS1T01_200T01_9000001638_11229cztM0_level2_quad_clean.evt |
| Size (bytes) | 605,027,520 | 122,852,160 |
| Size | 577.0 MB | 117.2 MB |
| Events in quadrant A | 5,351,593 | 804,292 |
| Events in quadrant B | 3,865,357 | 835,271 |
| Events in quadrant C | 3,976,741 | 830,041 |
| Events in quadrant D | 4,687,997 | 795,813 |
| Mode M9 | |||
|---|---|---|---|
| Quadrant | BADHDUFLAG | Total packets | Discarded packets |
| A | 0 | 11 | 0 |
| B | 0 | 11 | 0 |
| C | 0 | 11 | 0 |
| D | 0 | 12 | 0 |
| Mode SS | |||
|---|---|---|---|
| Quadrant | BADHDUFLAG | Total packets | Discarded packets |
| A | 0 | 132 | 0 |
| B | 0 | 132 | 0 |
| C | 0 | 132 | 0 |
| D | 0 | 132 | 0 |
| Mode M0 | |||
|---|---|---|---|
| Quadrant | BADHDUFLAG | Total packets | Discarded packets |
| A | 0 | 20470 | 3 |
| B | 0 | 15841 | 2 |
| C | 0 | 16375 | 2 |
| D | 0 | 18392 | 2 |
| Quadrant | Total seconds | Saturated seconds | Saturation percentage |
|---|---|---|---|
| A | 6528 | 338 | 5.177696% |
| B | 6528 | 198 | 3.033088% |
| C | 6528 | 388 | 5.943627% |
| D | 6528 | 232 | 3.553922% |
Noise dominated data is calculated using 1-second bins in cleaned event files. If a bin has >2000 counts, and if more than 50% of those come from <1% of pixels, then it is considered to be noise-dominated and hence unusable.
| Quadrant | # 1 sec bins | Bins with >0 counts | Bins with >2000 counts | High rate bins dominated by noise | Noise dominated (total time) | Noise dominated (detector-on time) | Marked lightcurve |
|---|---|---|---|---|---|---|---|
| A | 7643 | 6529 | 197 | 197 | 2.58% | 3.02% | 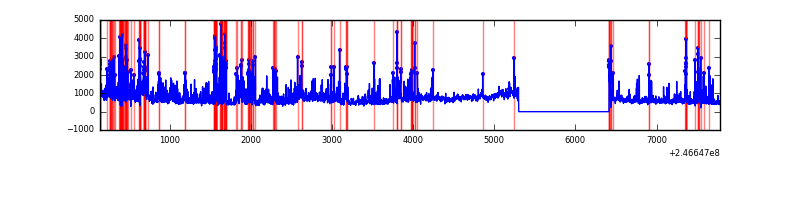 |
| B | 7643 | 6529 | 93 | 93 | 1.22% | 1.42% | 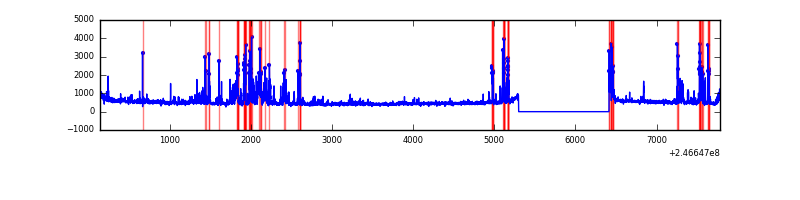 |
| C | 7643 | 6529 | 277 | 277 | 3.62% | 4.24% | 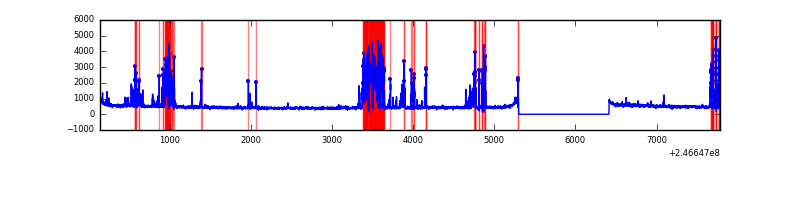 |
| D | 7643 | 6529 | 154 | 154 | 2.01% | 2.36% | 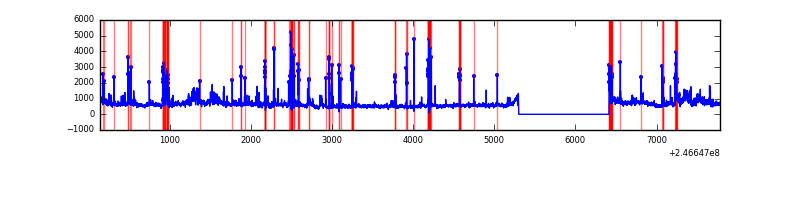 |
Top three noisy pixels from each quadrant. If the there are fewer than three noisy pixels in the level2.evt file, extra rows are filled as -1
| Pixel properties | Quadrant properties | ||||||
|---|---|---|---|---|---|---|---|
| Quadrant | DetID | PixID | Counts | Sigma | Mean | Median | Sigma |
| A | 8 | 5 | 1704530 | 11205.14 | 748 | 732 | 152.1 |
| A | 15 | 174 | 576155 | 3784.31 | 748 | 732 | 152.1 |
| A | 8 | 15 | 63367 | 411.92 | 748 | 732 | 152.1 |
| B | 4 | 239 | 700708 | 4870.79 | 765 | 743 | 143.7 |
| B | 3 | 189 | 83327 | 574.67 | 765 | 743 | 143.7 |
| B | 15 | 204 | 56864 | 390.53 | 765 | 743 | 143.7 |
| C | 4 | 254 | 1004556 | 5863.29 | 742 | 747 | 171.2 |
| C | 7 | 238 | 75381 | 435.94 | 742 | 747 | 171.2 |
| C | 13 | 61 | 5413 | 27.25 | 742 | 747 | 171.2 |
| D | 8 | 195 | 850578 | 4778.45 | 743 | 724 | 177.9 |
| D | 1 | 52 | 223510 | 1252.65 | 743 | 724 | 177.9 |
| D | 12 | 157 | 210893 | 1181.71 | 743 | 724 | 177.9 |
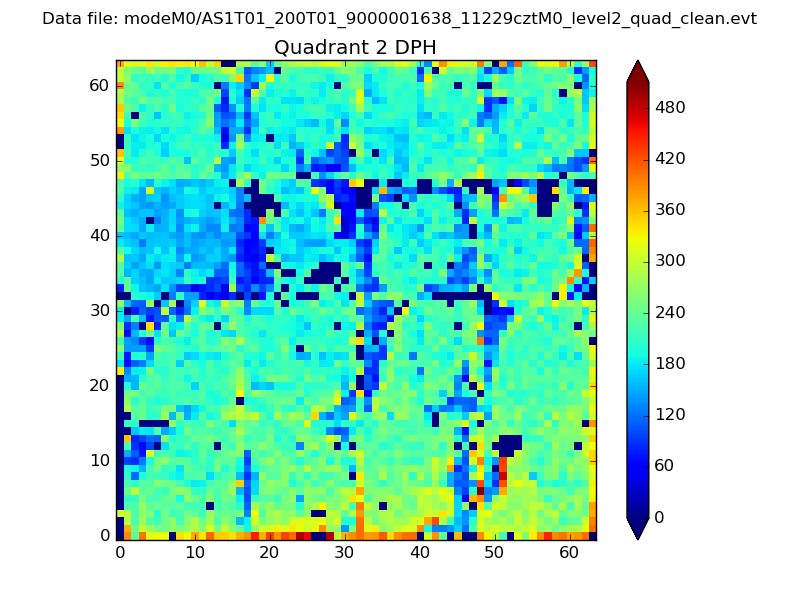
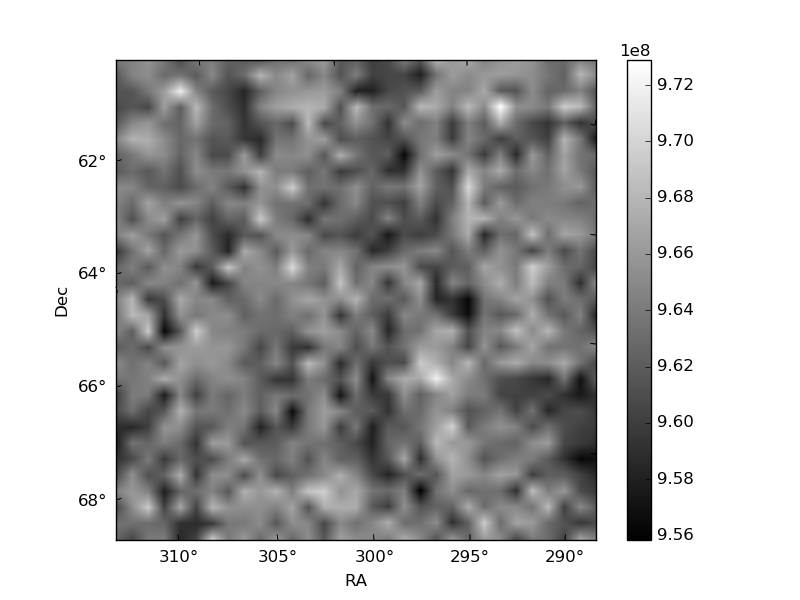
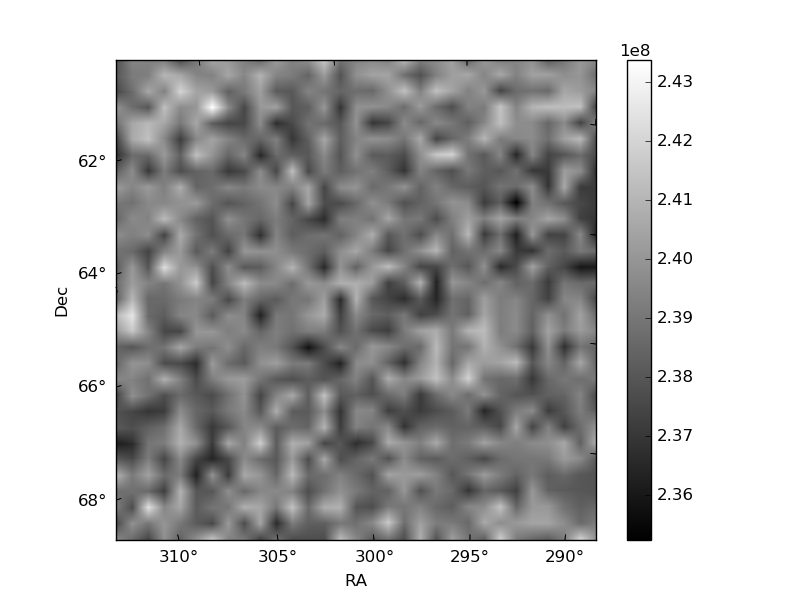
Histogram calculated using DETX and DETY for each event in the final _common_clean file
| Quadrant A | 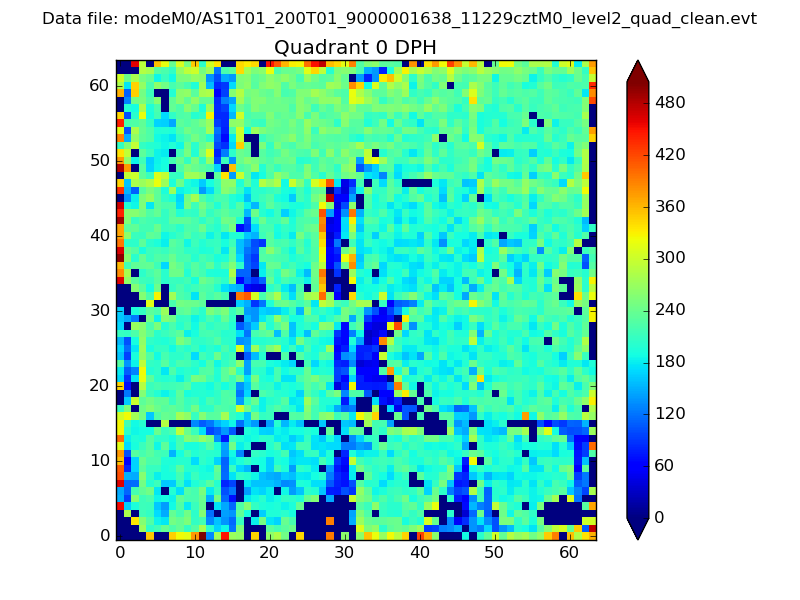 |
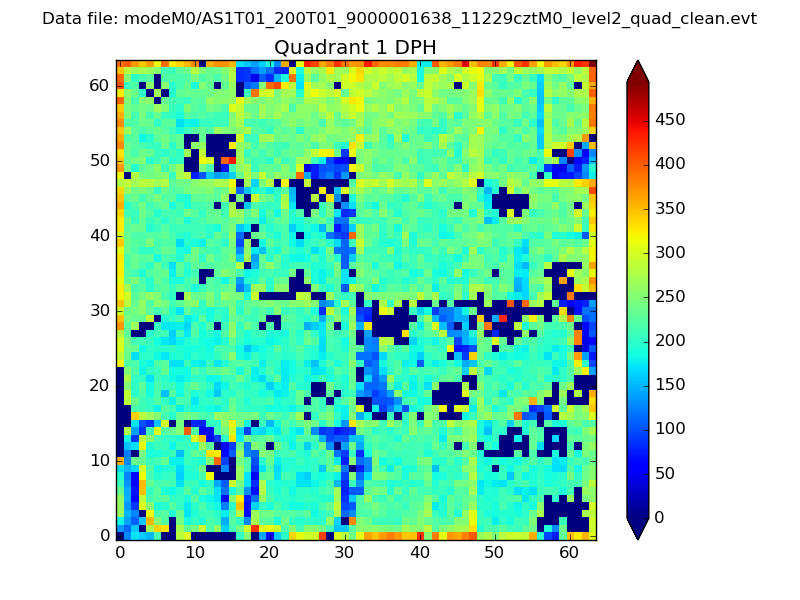 |
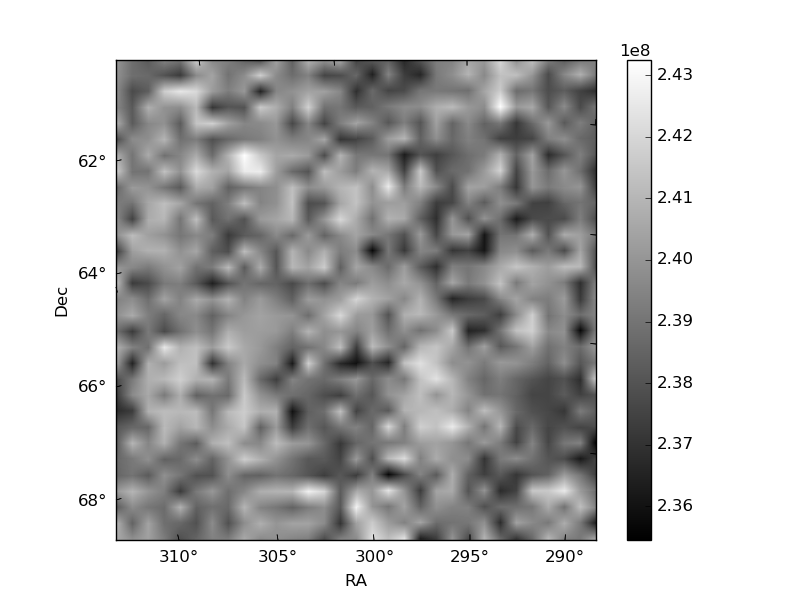
Quadrant B |
|---|---|---|---|
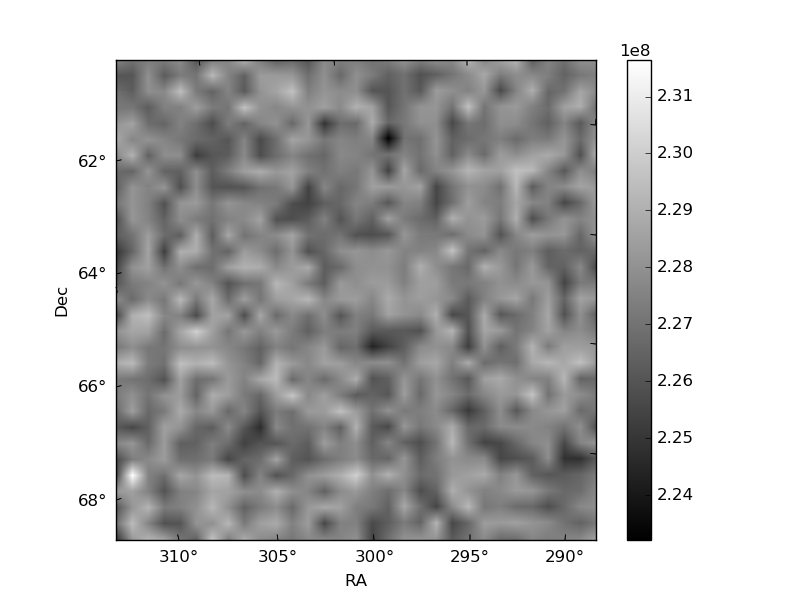
| Quadrant D | 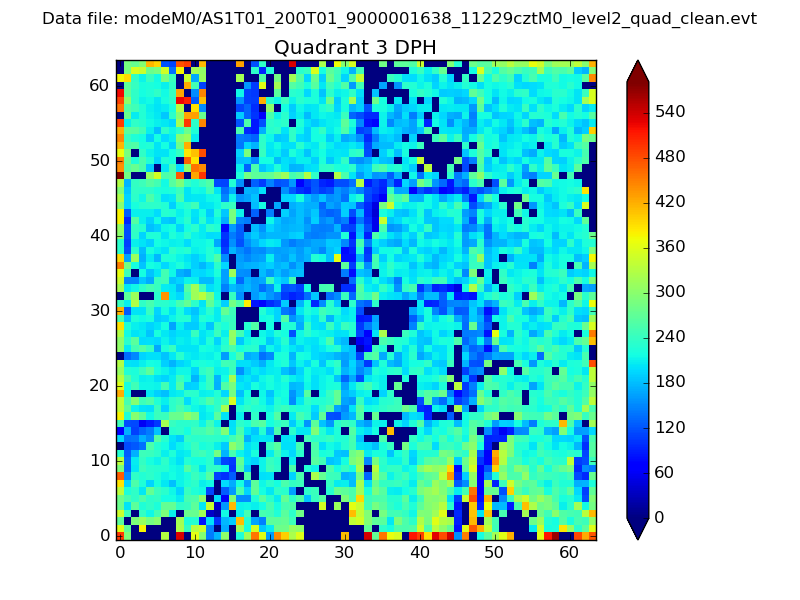 |
 |
Quadrant C |
| Plot type | Count rate plots | Images |
|---|---|---|
| Comparison with Poisson distribution Blue bars denote a histogram of data divided into 1 sec bins. Red curve is a Poisson curve with rate = median count rate of data. |
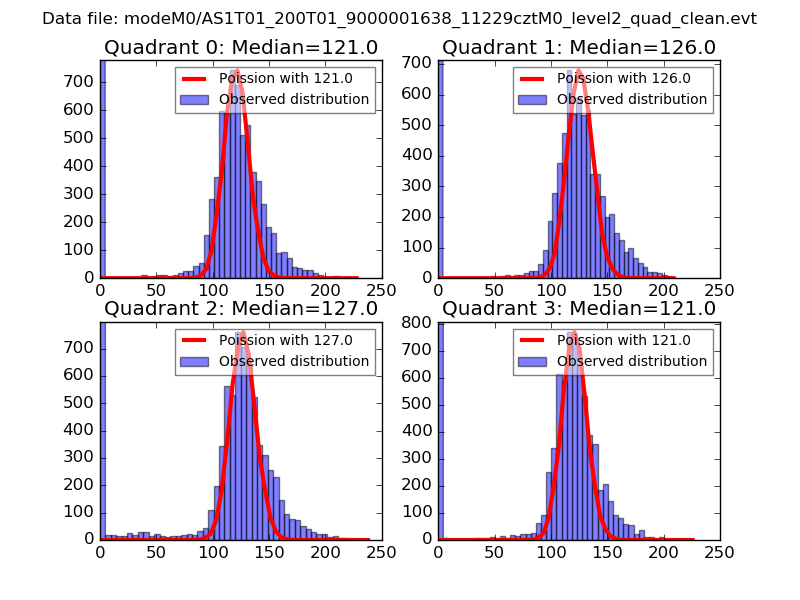 |
 |
| Quadrant-wise count rates Data is divided into 100 sec bins |
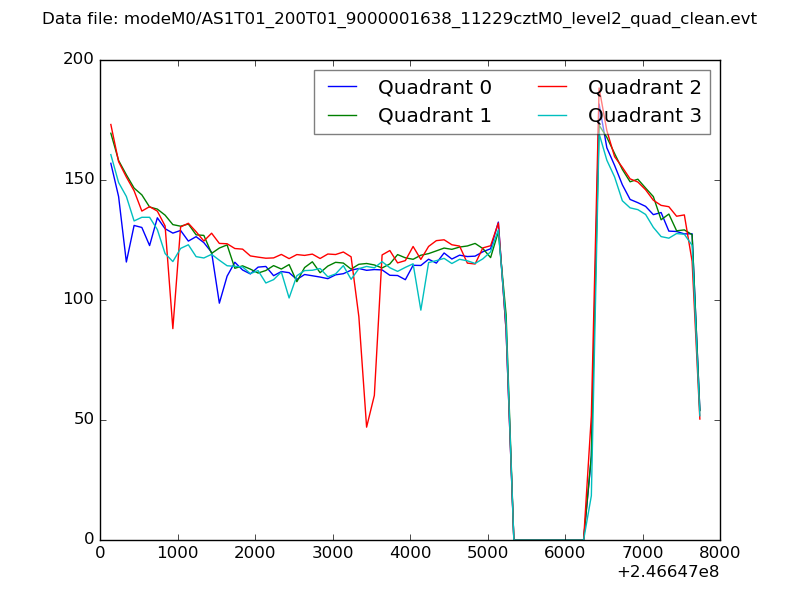 |
|
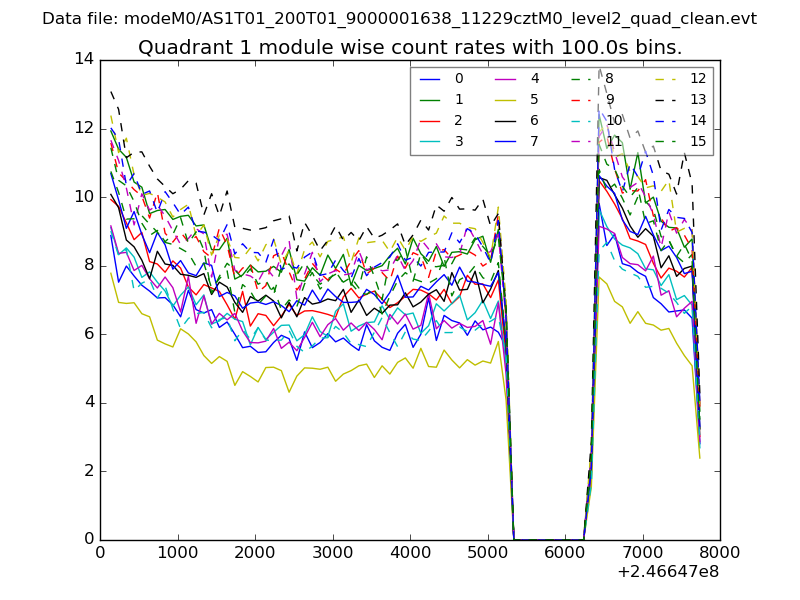
| Module-wise count rates for Quadrant A Data is divided into 100 sec bins |
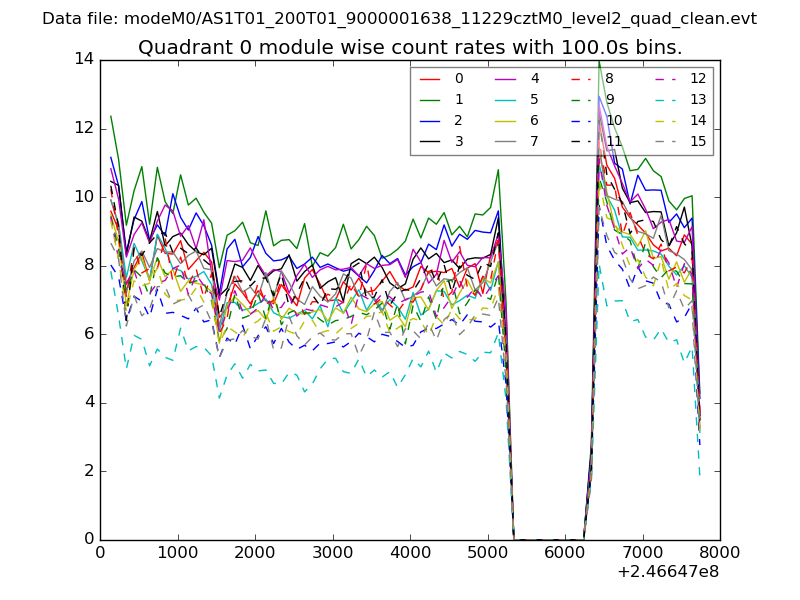 |
 |
| Module-wise count rates for Quadrant B Data is divided into 100 sec bins |
 |
 |
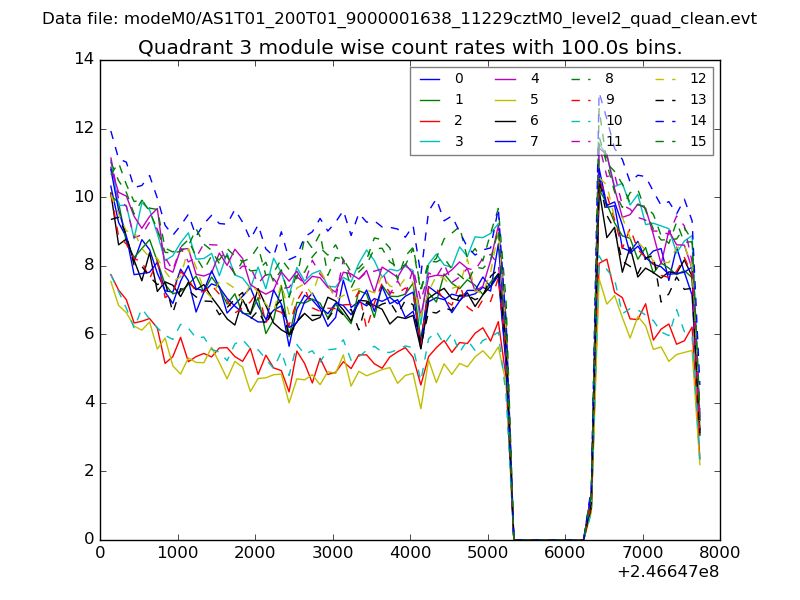
| Module-wise count rates for Quadrant C Data is divided into 100 sec bins |
 |
 |
| Module-wise count rates for Quadrant D Data is divided into 100 sec bins |
 |
 |
| Parameter | Plot |
|---|---|
| CZT HV Monitor |  |
| D_VDD | 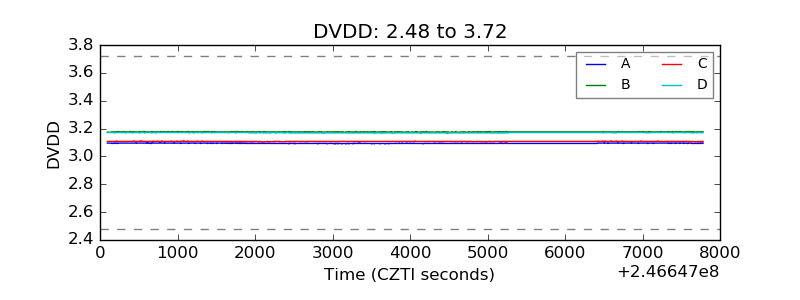 |
| Temperature 1 | 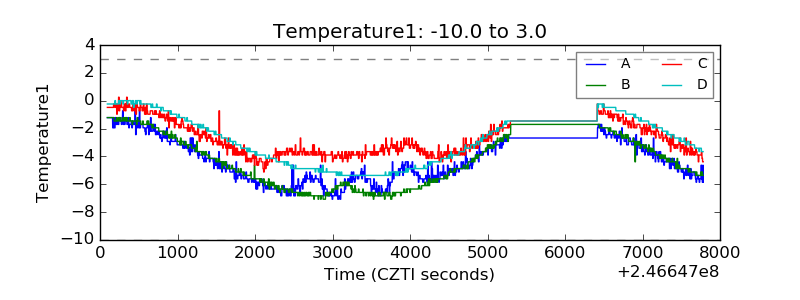 |
| Veto HV Monitor | 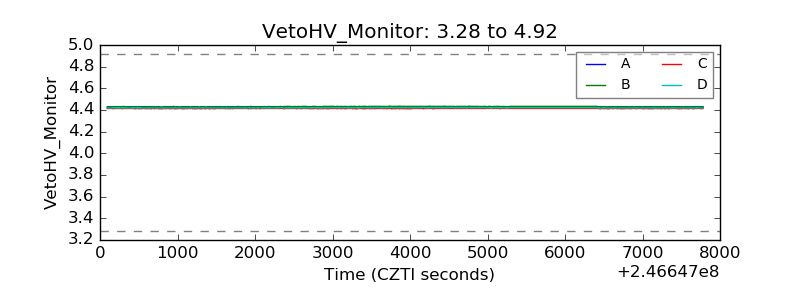 |
| Veto LLD | 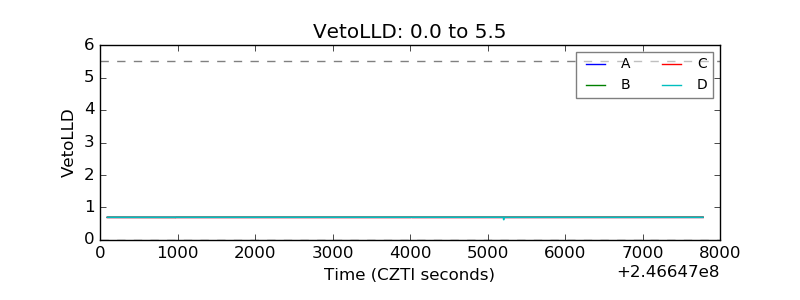 |
| Alpha Counter | 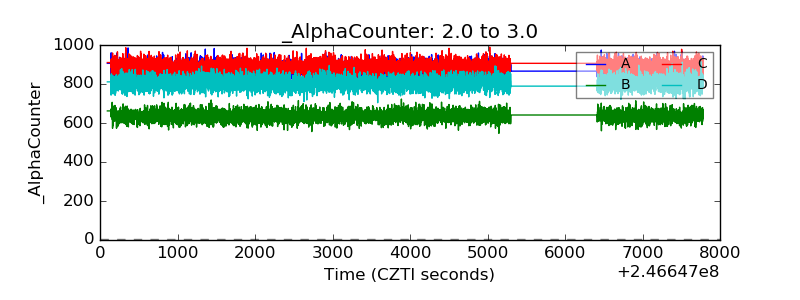 |
| _CPM_Rate | 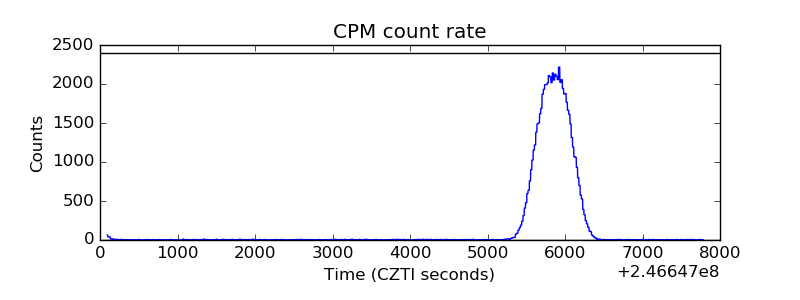 |
| CZT Counter | 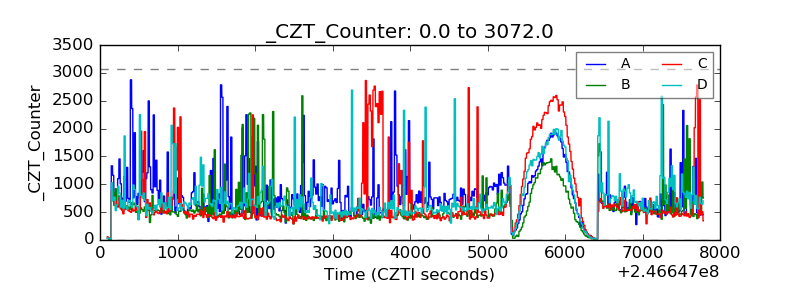 |
| +2.5 Volts monitor | 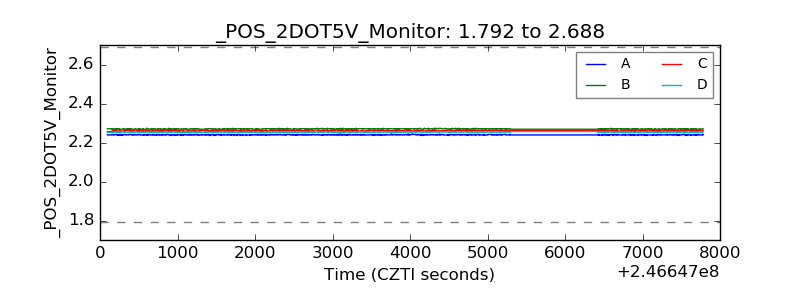 |
| +5 Volts monitor |  |
| _ROLL_ROT | 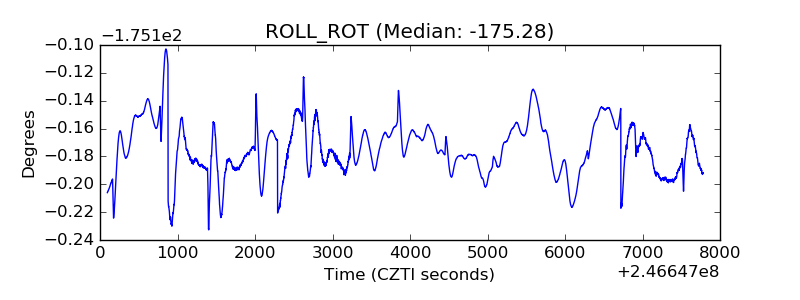 |
| _Roll_DEC | 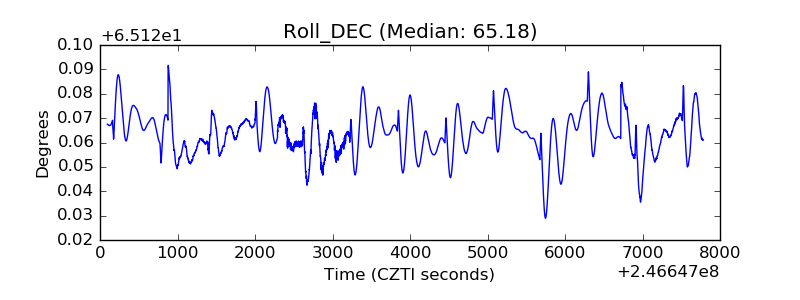 |
| _Roll_RA | 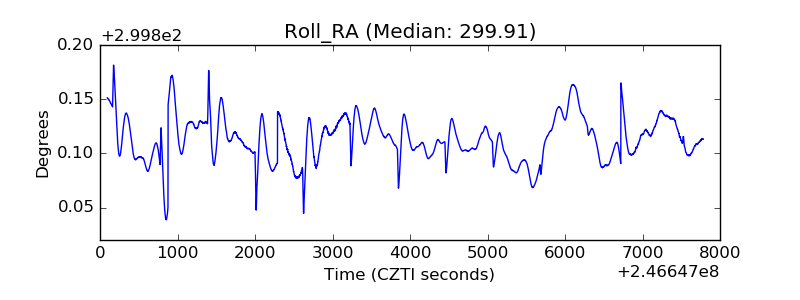 |
| Veto Counter |  |