| Param | Original file | Final file |
|---|---|---|
| Filename | modeM0/AS1T01_200T01_9000001638_11230cztM0_level2.evt | modeM0/AS1T01_200T01_9000001638_11230cztM0_level2_quad_clean.evt |
| Size (bytes) | 549,604,800 | 123,857,280 |
| Size | 524.1 MB | 118.1 MB |
| Events in quadrant A | 5,038,081 | 805,785 |
| Events in quadrant B | 3,904,754 | 842,302 |
| Events in quadrant C | 3,129,559 | 861,106 |
| Events in quadrant D | 4,142,730 | 799,484 |
| Mode M9 | |||
|---|---|---|---|
| Quadrant | BADHDUFLAG | Total packets | Discarded packets |
| A | 0 | 16 | 0 |
| B | 0 | 16 | 0 |
| C | 0 | 16 | 0 |
| D | 0 | 17 | 0 |
| Mode SS | |||
|---|---|---|---|
| Quadrant | BADHDUFLAG | Total packets | Discarded packets |
| A | 0 | 128 | 0 |
| B | 0 | 128 | 0 |
| C | 0 | 128 | 0 |
| D | 0 | 128 | 0 |
| Mode M0 | |||
|---|---|---|---|
| Quadrant | BADHDUFLAG | Total packets | Discarded packets |
| A | 0 | 19307 | 3 |
| B | 0 | 15977 | 2 |
| C | 0 | 13732 | 2 |
| D | 0 | 16388 | 2 |
| Quadrant | Total seconds | Saturated seconds | Saturation percentage |
|---|---|---|---|
| A | 6344 | 320 | 5.044136% |
| B | 6344 | 260 | 4.098361% |
| C | 6344 | 88 | 1.387137% |
| D | 6344 | 144 | 2.269861% |
Noise dominated data is calculated using 1-second bins in cleaned event files. If a bin has >2000 counts, and if more than 50% of those come from <1% of pixels, then it is considered to be noise-dominated and hence unusable.
| Quadrant | # 1 sec bins | Bins with >0 counts | Bins with >2000 counts | High rate bins dominated by noise | Noise dominated (total time) | Noise dominated (detector-on time) | Marked lightcurve |
|---|---|---|---|---|---|---|---|
| A | 7564 | 6345 | 189 | 189 | 2.50% | 2.98% | 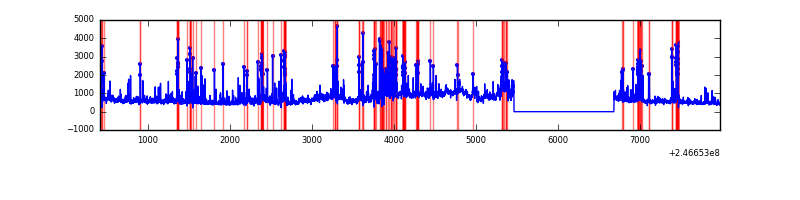 |
| B | 7564 | 6345 | 133 | 133 | 1.76% | 2.10% | 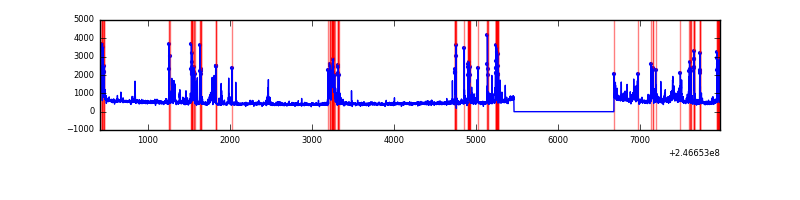 |
| C | 7564 | 6345 | 35 | 35 | 0.46% | 0.55% | 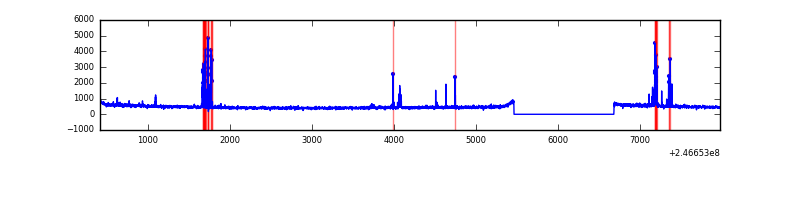 |
| D | 7564 | 6345 | 89 | 89 | 1.18% | 1.40% | 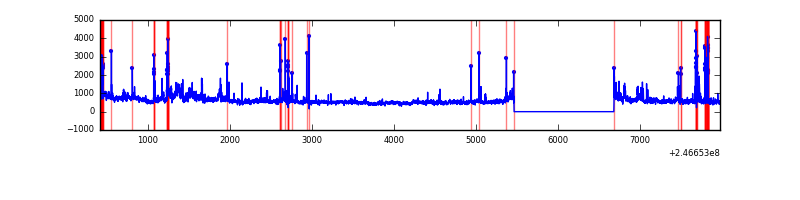 |
Top three noisy pixels from each quadrant. If the there are fewer than three noisy pixels in the level2.evt file, extra rows are filled as -1
| Pixel properties | Quadrant properties | ||||||
|---|---|---|---|---|---|---|---|
| Quadrant | DetID | PixID | Counts | Sigma | Mean | Median | Sigma |
| A | 15 | 174 | 1009534 | 6794.94 | 736 | 720 | 148.5 |
| A | 8 | 5 | 992017 | 6676.96 | 736 | 720 | 148.5 |
| A | 14 | 238 | 52866 | 351.23 | 736 | 720 | 148.5 |
| B | 4 | 239 | 854826 | 6150.6 | 751 | 732 | 138.9 |
| B | 3 | 189 | 46070 | 326.49 | 751 | 732 | 138.9 |
| B | 15 | 204 | 39725 | 280.8 | 751 | 732 | 138.9 |
| C | 4 | 254 | 108348 | 622.24 | 750 | 753 | 172.9 |
| C | 7 | 238 | 96684 | 554.79 | 750 | 753 | 172.9 |
| C | 13 | 61 | 5510 | 27.51 | 750 | 753 | 172.9 |
| D | 8 | 195 | 656600 | 3741.03 | 732 | 711 | 175.3 |
| D | 12 | 157 | 224661 | 1277.36 | 732 | 711 | 175.3 |
| D | 1 | 52 | 143790 | 816.09 | 732 | 711 | 175.3 |
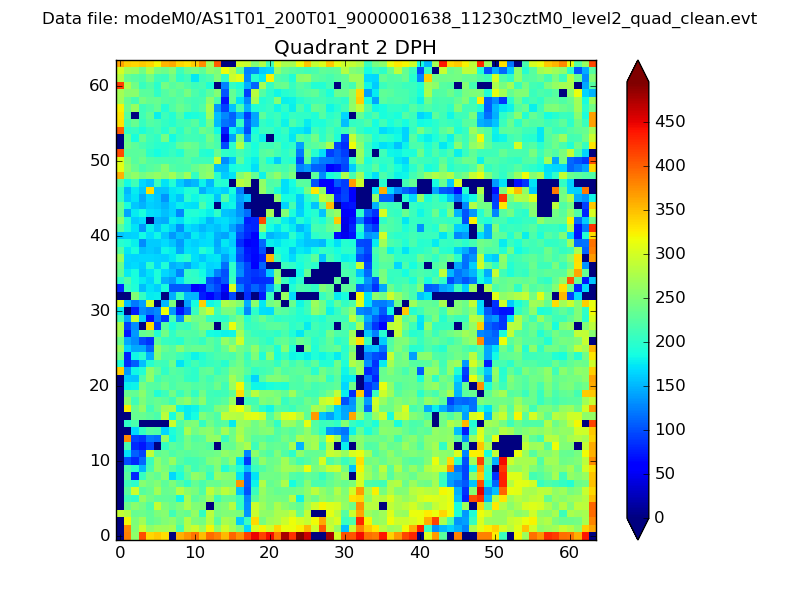
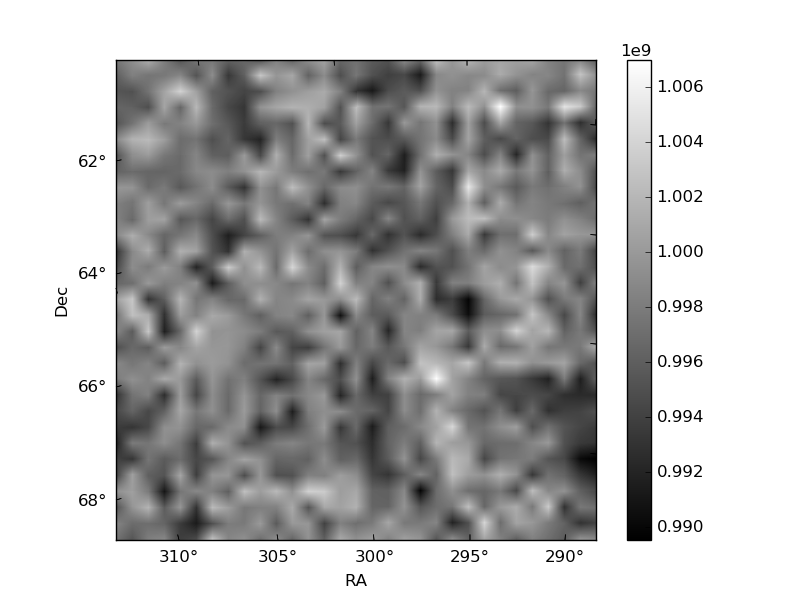
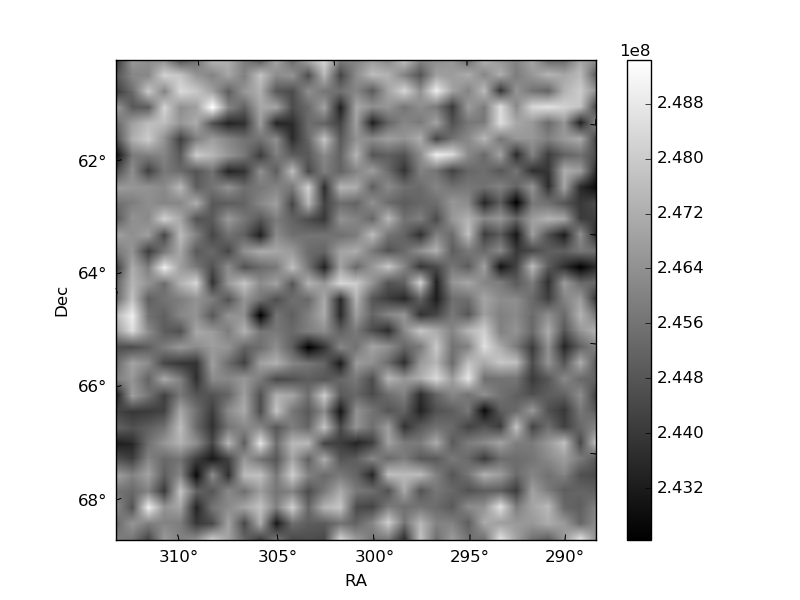
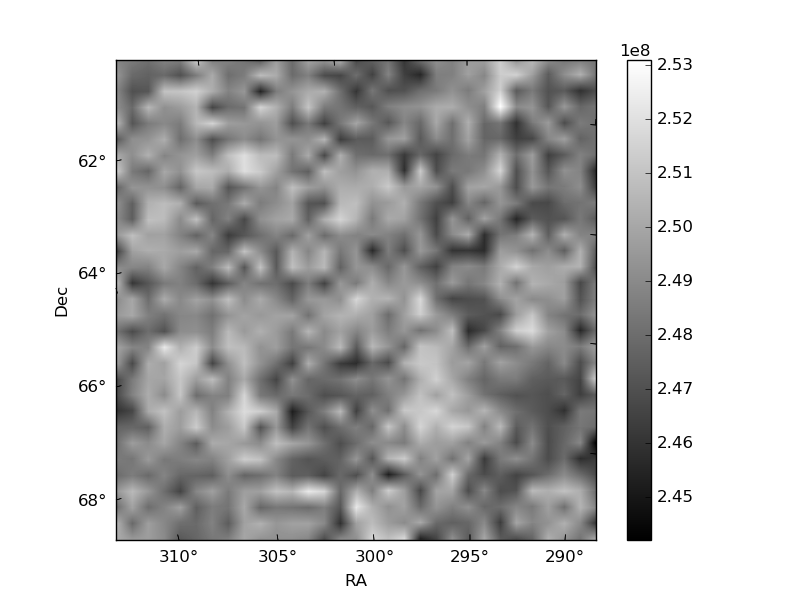
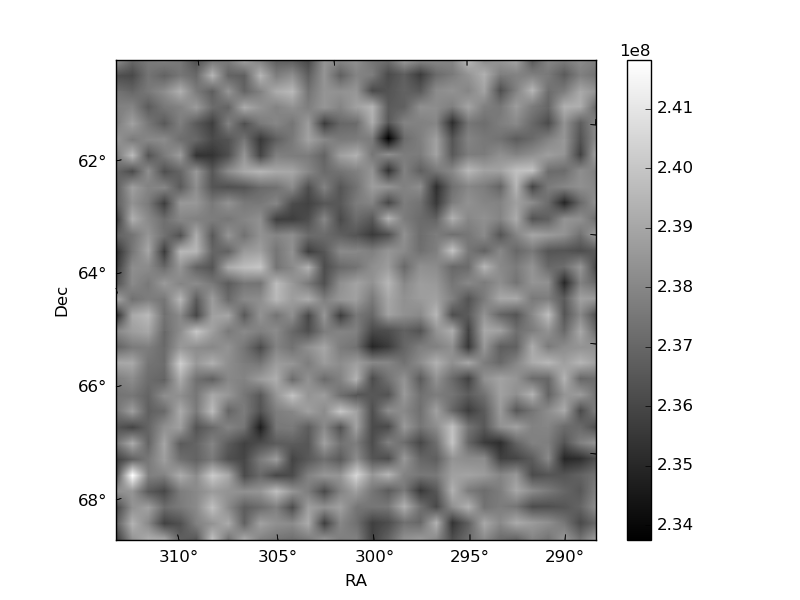
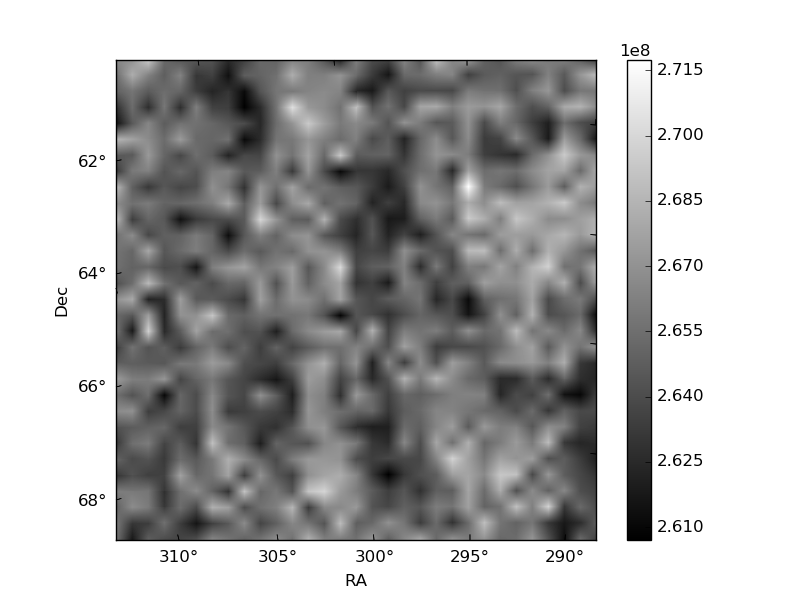
Histogram calculated using DETX and DETY for each event in the final _common_clean file
| Quadrant A | 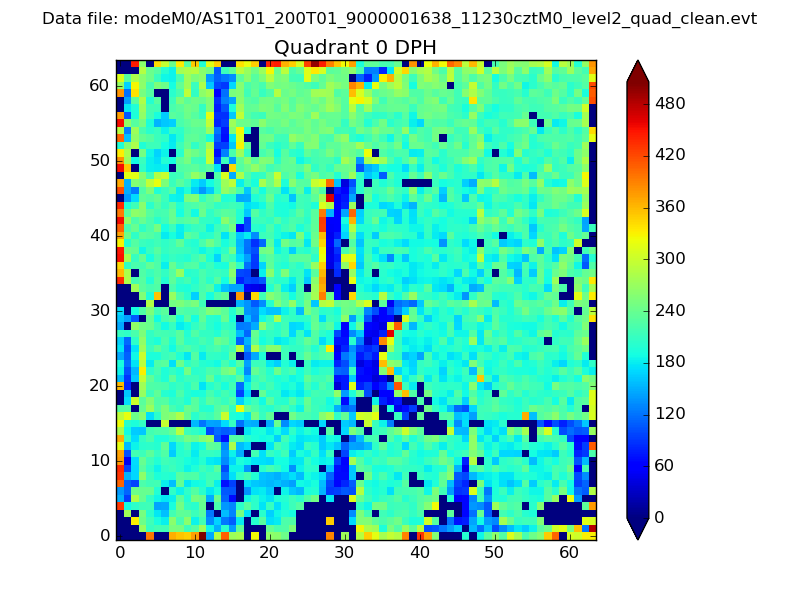 |
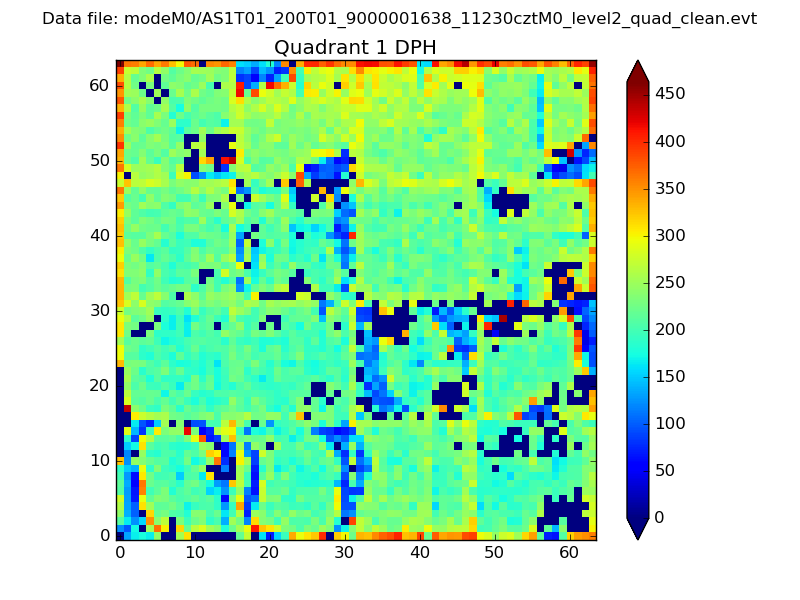 |
Quadrant B |
|---|---|---|---|
| Quadrant D | 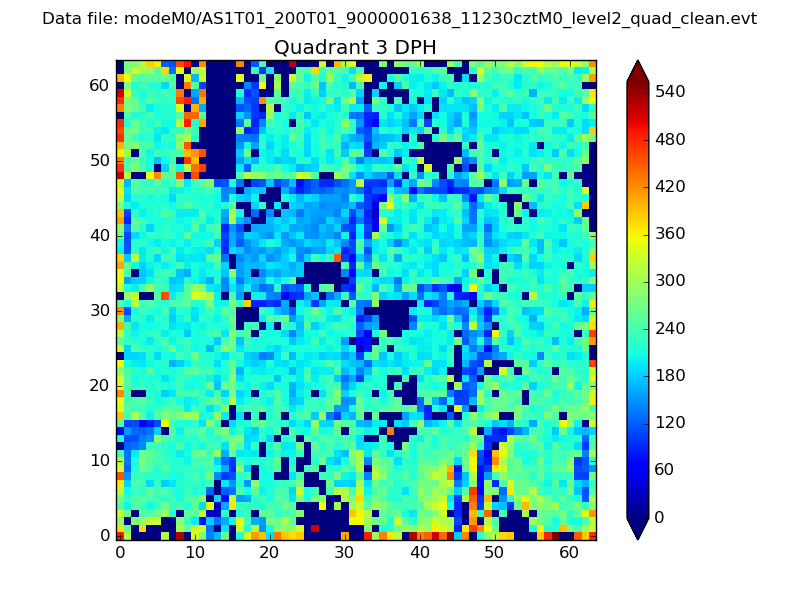 |
 |
Quadrant C |
| Plot type | Count rate plots | Images |
|---|---|---|
| Comparison with Poisson distribution Blue bars denote a histogram of data divided into 1 sec bins. Red curve is a Poisson curve with rate = median count rate of data. |
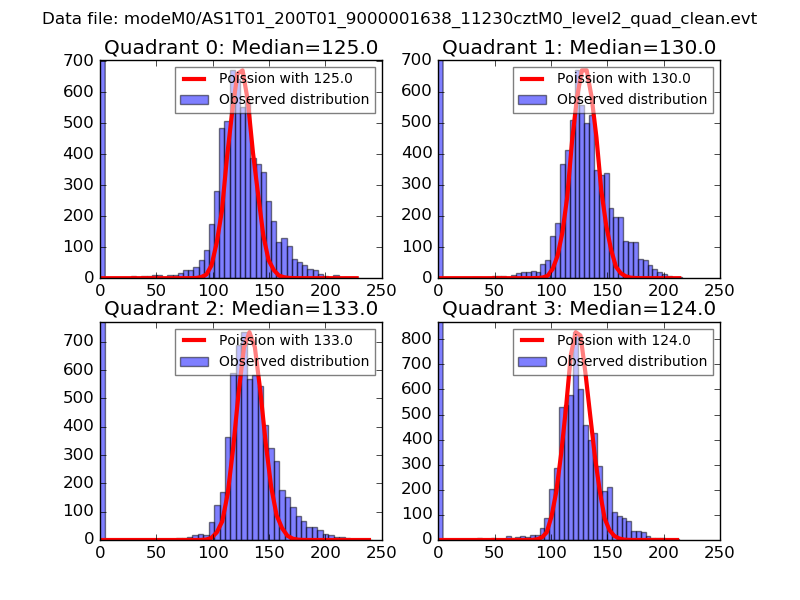 |
 |
| Quadrant-wise count rates Data is divided into 100 sec bins |
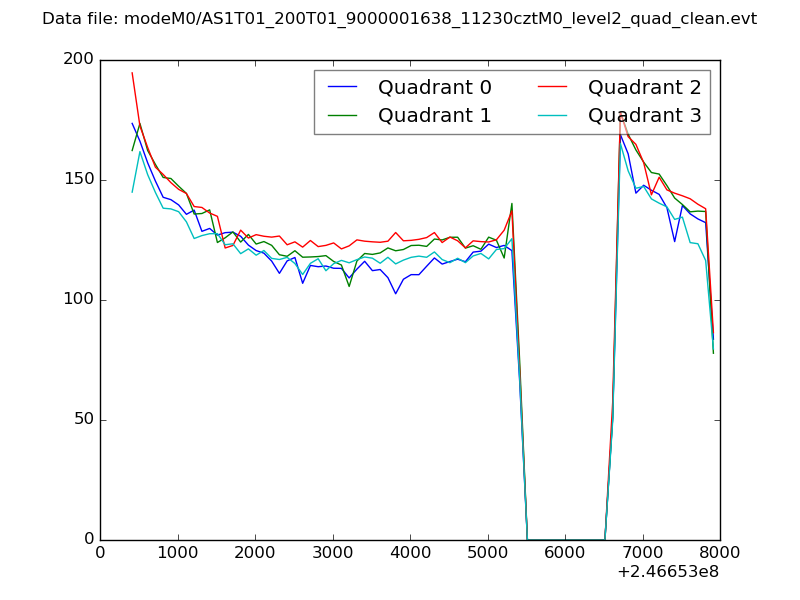 |
|
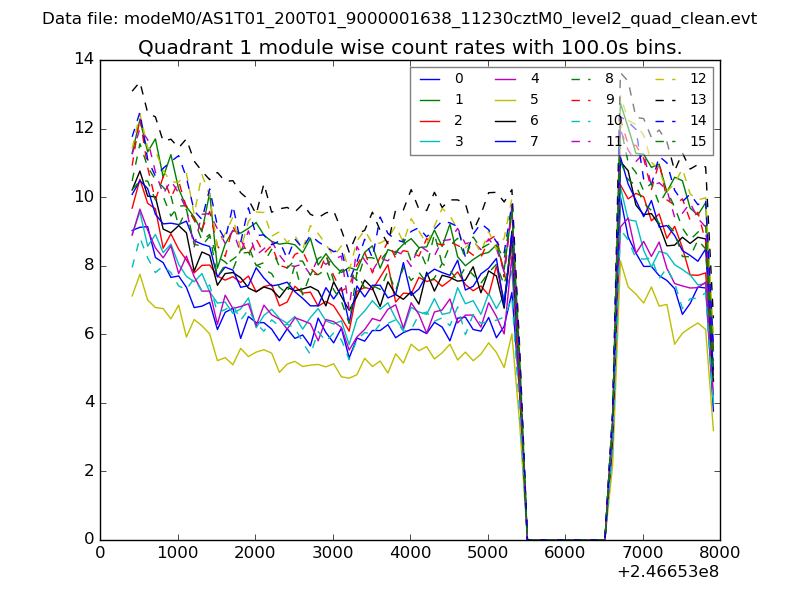
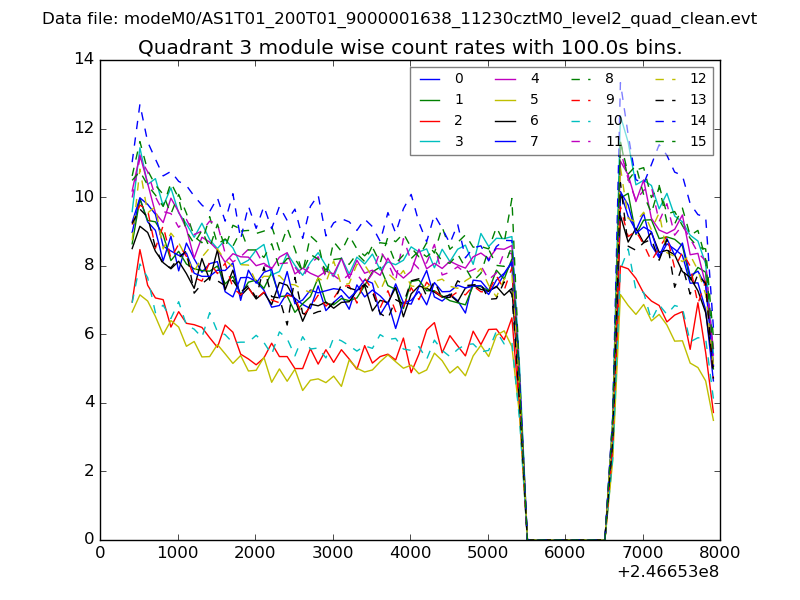
| Module-wise count rates for Quadrant A Data is divided into 100 sec bins |
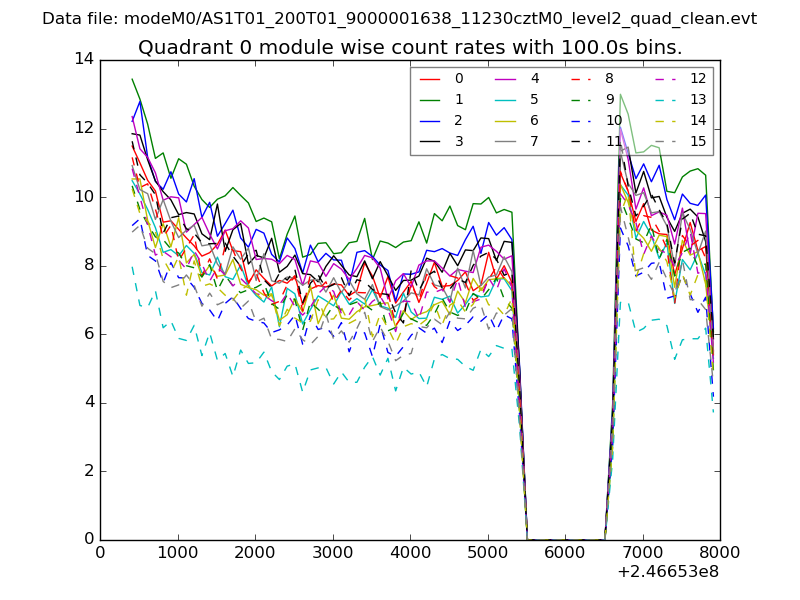 |
 |
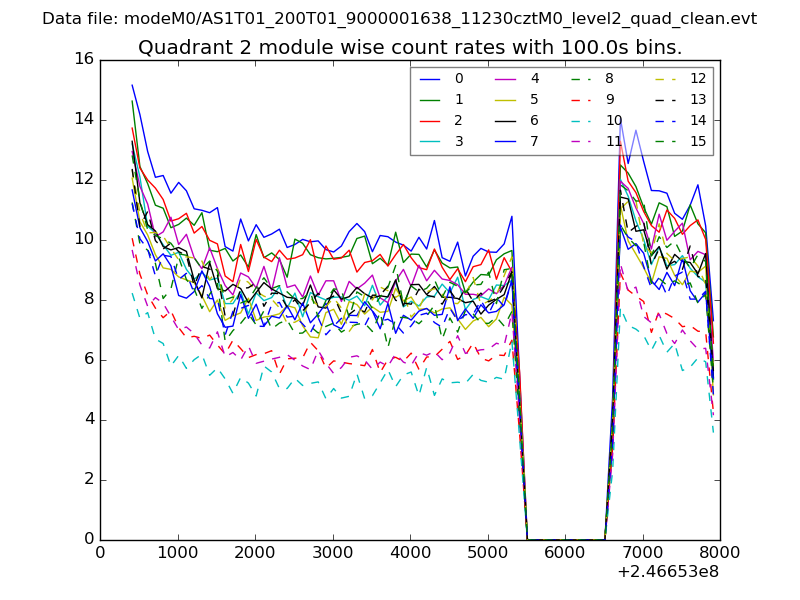
| Module-wise count rates for Quadrant B Data is divided into 100 sec bins |
 |
 |
| Module-wise count rates for Quadrant C Data is divided into 100 sec bins |
 |
 |
| Module-wise count rates for Quadrant D Data is divided into 100 sec bins |
 |
 |
| Parameter | Plot |
|---|---|
| CZT HV Monitor | 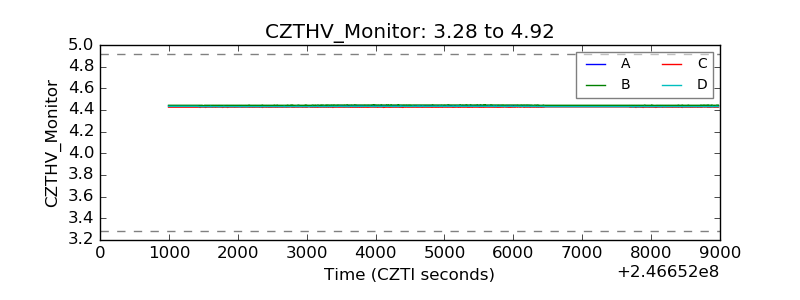 |
| D_VDD | 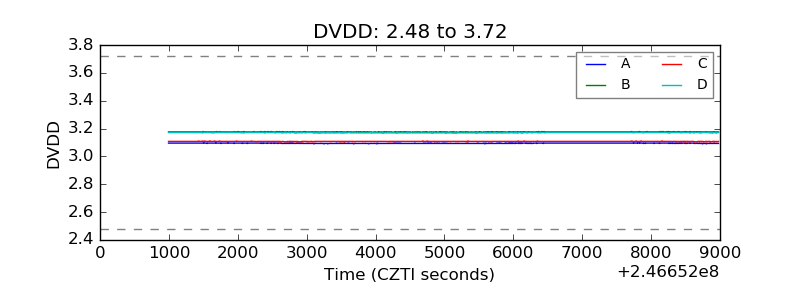 |
| Temperature 1 | 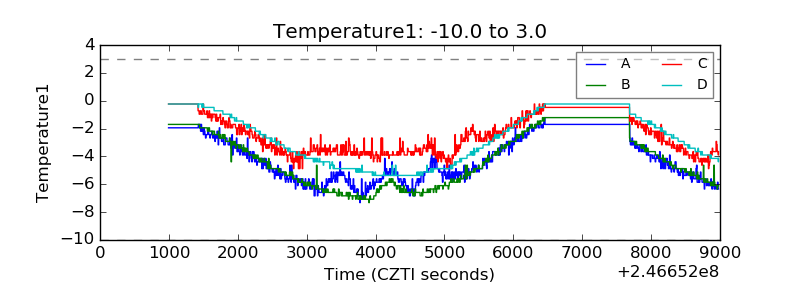 |
| Veto HV Monitor | 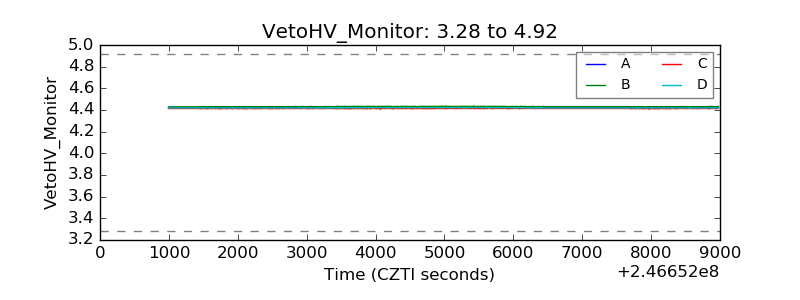 |
| Veto LLD | 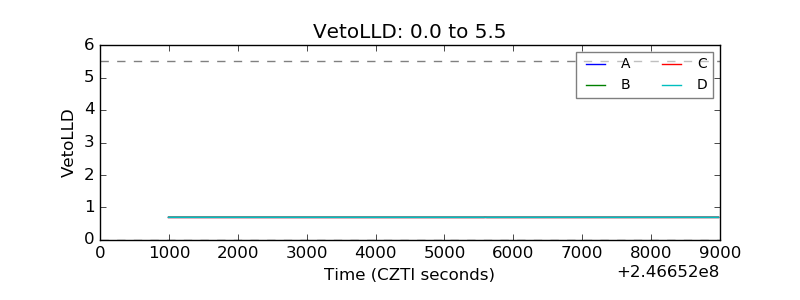 |
| Alpha Counter | 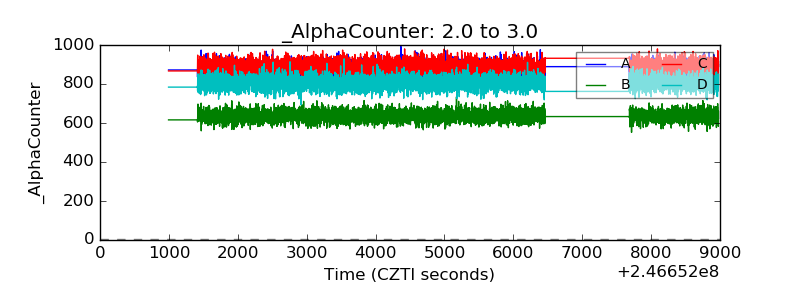 |
| _CPM_Rate | 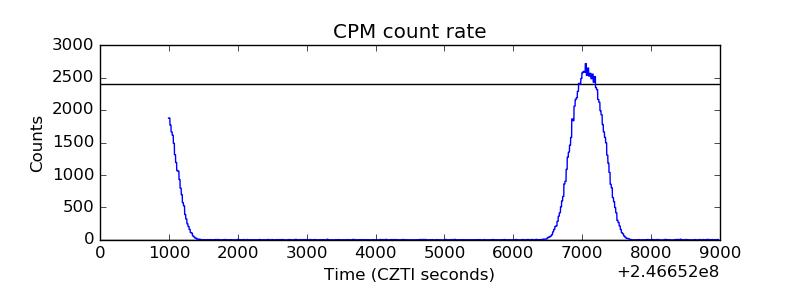 |
| CZT Counter | 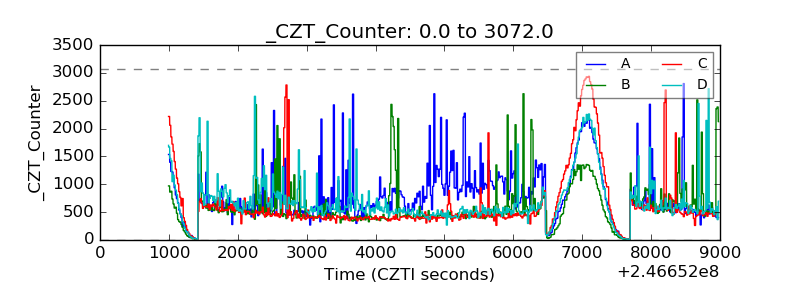 |
| +2.5 Volts monitor |  |
| +5 Volts monitor | 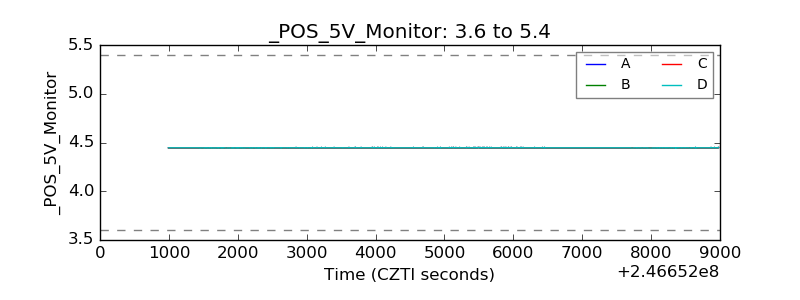 |
| _ROLL_ROT | 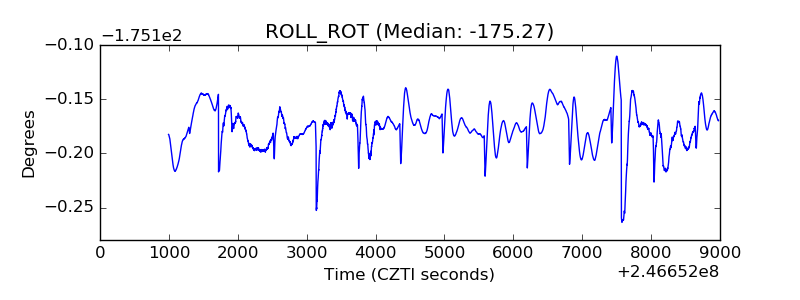 |
| _Roll_DEC | 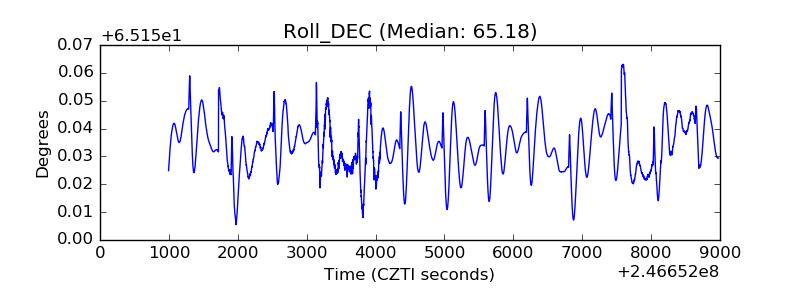 |
| _Roll_RA | 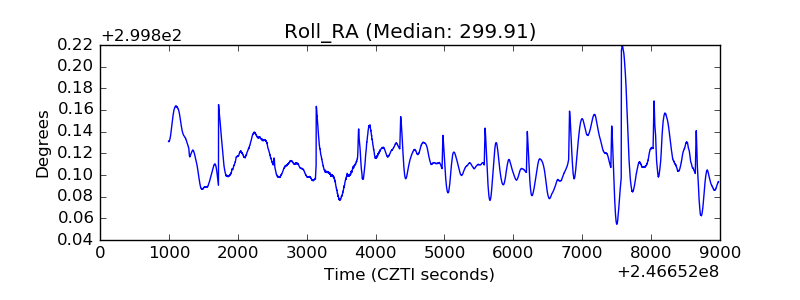 |
| Veto Counter | 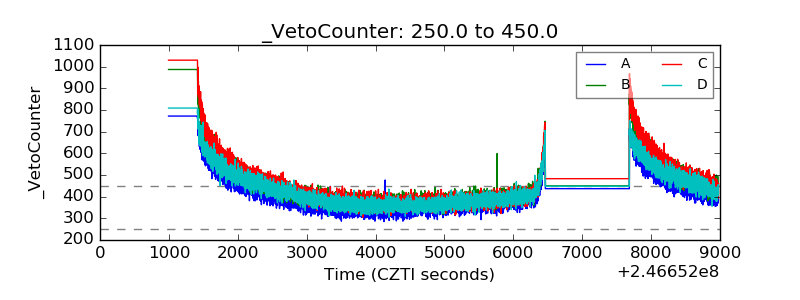 |