| Param | Original file | Final file |
|---|---|---|
| Filename | modeM0/AS1T01_200T01_9000001638_11231cztM0_level2.evt | modeM0/AS1T01_200T01_9000001638_11231cztM0_level2_quad_clean.evt |
| Size (bytes) | 519,834,240 | 120,067,200 |
| Size | 495.8 MB | 114.5 MB |
| Events in quadrant A | 3,640,714 | 794,826 |
| Events in quadrant B | 3,524,504 | 828,395 |
| Events in quadrant C | 2,944,990 | 839,173 |
| Events in quadrant D | 5,216,538 | 745,049 |
| Mode M9 | |||
|---|---|---|---|
| Quadrant | BADHDUFLAG | Total packets | Discarded packets |
| A | 0 | 19 | 0 |
| B | 0 | 19 | 0 |
| C | 0 | 19 | 0 |
| D | 0 | 20 | 0 |
| Mode SS | |||
|---|---|---|---|
| Quadrant | BADHDUFLAG | Total packets | Discarded packets |
| A | 0 | 126 | 0 |
| B | 0 | 126 | 0 |
| C | 0 | 126 | 0 |
| D | 0 | 126 | 0 |
| Mode M0 | |||
|---|---|---|---|
| Quadrant | BADHDUFLAG | Total packets | Discarded packets |
| A | 0 | 14816 | 3 |
| B | 0 | 14612 | 2 |
| C | 0 | 12971 | 2 |
| D | 0 | 19720 | 2 |
| Quadrant | Total seconds | Saturated seconds | Saturation percentage |
|---|---|---|---|
| A | 6136 | 164 | 2.672751% |
| B | 6136 | 130 | 2.118644% |
| C | 6136 | 28 | 0.456323% |
| D | 6136 | 645 | 10.511734% |
Noise dominated data is calculated using 1-second bins in cleaned event files. If a bin has >2000 counts, and if more than 50% of those come from <1% of pixels, then it is considered to be noise-dominated and hence unusable.
| Quadrant | # 1 sec bins | Bins with >0 counts | Bins with >2000 counts | High rate bins dominated by noise | Noise dominated (total time) | Noise dominated (detector-on time) | Marked lightcurve |
|---|---|---|---|---|---|---|---|
| A | 7461 | 6137 | 106 | 106 | 1.42% | 1.73% | 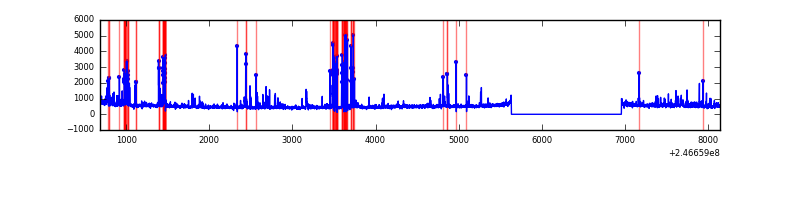 |
| B | 7461 | 6136 | 63 | 63 | 0.84% | 1.03% | 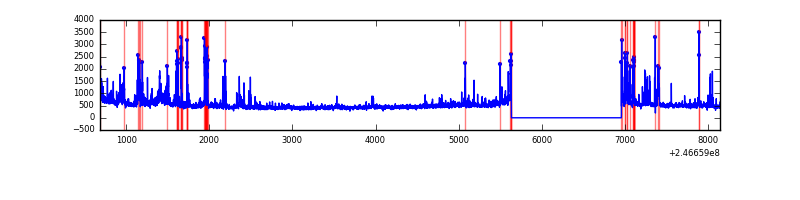 |
| C | 7461 | 6137 | 14 | 14 | 0.19% | 0.23% | 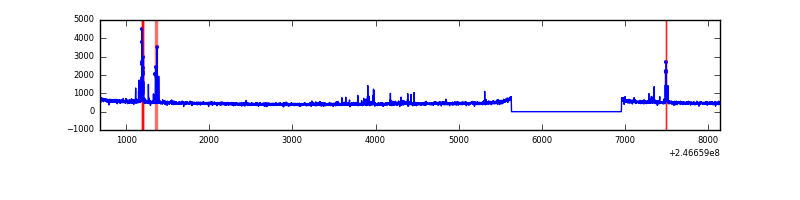 |
| D | 7461 | 6137 | 572 | 572 | 7.67% | 9.32% | 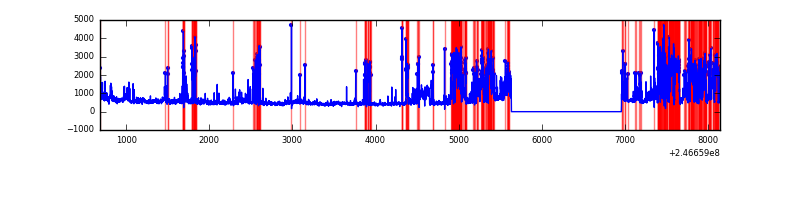 |
Top three noisy pixels from each quadrant. If the there are fewer than three noisy pixels in the level2.evt file, extra rows are filled as -1
| Pixel properties | Quadrant properties | ||||||
|---|---|---|---|---|---|---|---|
| Quadrant | DetID | PixID | Counts | Sigma | Mean | Median | Sigma |
| A | 8 | 5 | 685736 | 4807.39 | 713 | 700 | 142.5 |
| A | 14 | 238 | 43978 | 303.71 | 713 | 700 | 142.5 |
| A | 1 | 162 | 36045 | 248.04 | 713 | 700 | 142.5 |
| B | 4 | 239 | 505884 | 3746.19 | 730 | 712 | 134.8 |
| B | 3 | 189 | 83781 | 616.01 | 730 | 712 | 134.8 |
| B | 10 | 244 | 28486 | 205.96 | 730 | 712 | 134.8 |
| C | 4 | 254 | 119464 | 714.49 | 723 | 727 | 166.2 |
| C | 13 | 61 | 5290 | 27.46 | 723 | 727 | 166.2 |
| C | 14 | 128 | 3436 | 16.3 | 723 | 727 | 166.2 |
| D | 1 | 52 | 1943044 | 11866.62 | 680 | 661 | 163.7 |
| D | 8 | 195 | 324646 | 1979.33 | 680 | 661 | 163.7 |
| D | 13 | 104 | 118574 | 720.37 | 680 | 661 | 163.7 |
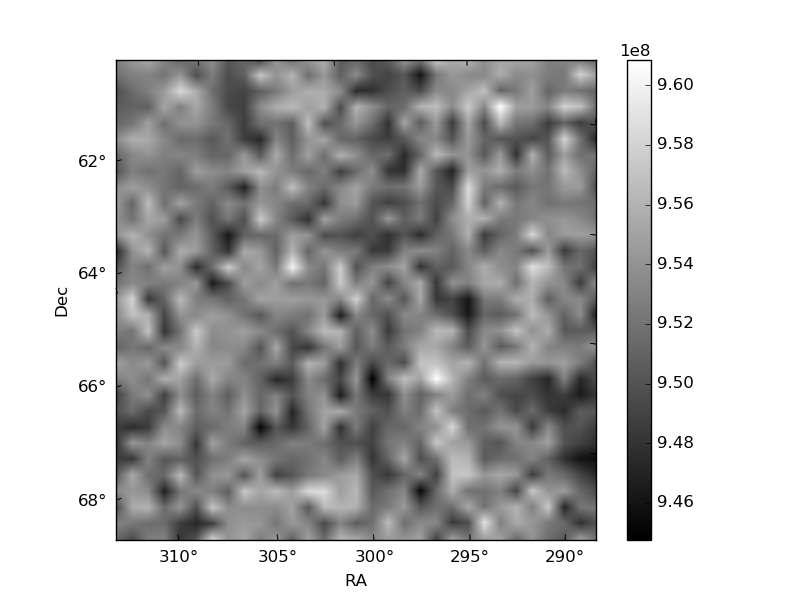
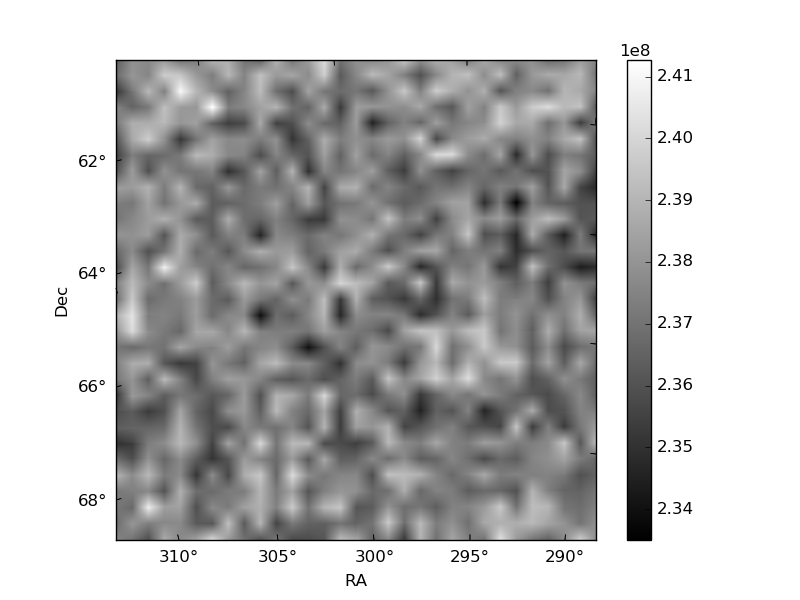
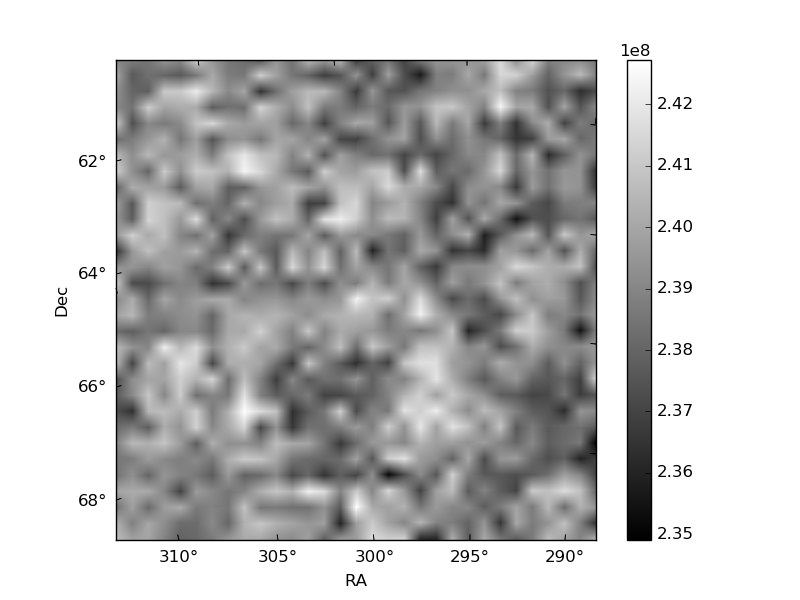
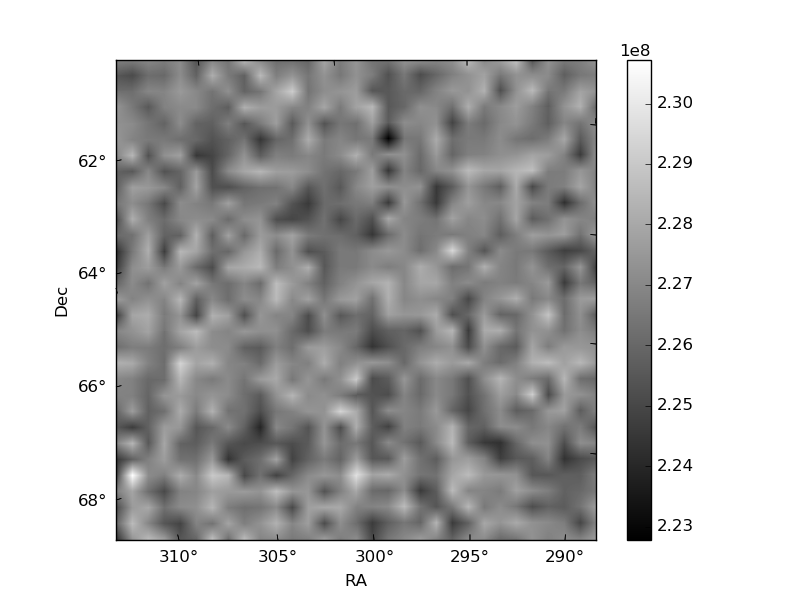
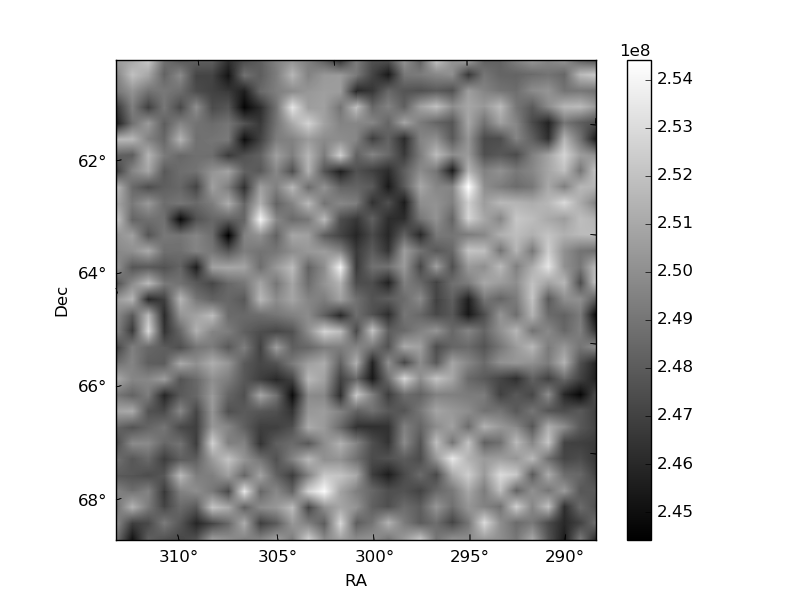
Histogram calculated using DETX and DETY for each event in the final _common_clean file
| Quadrant A | 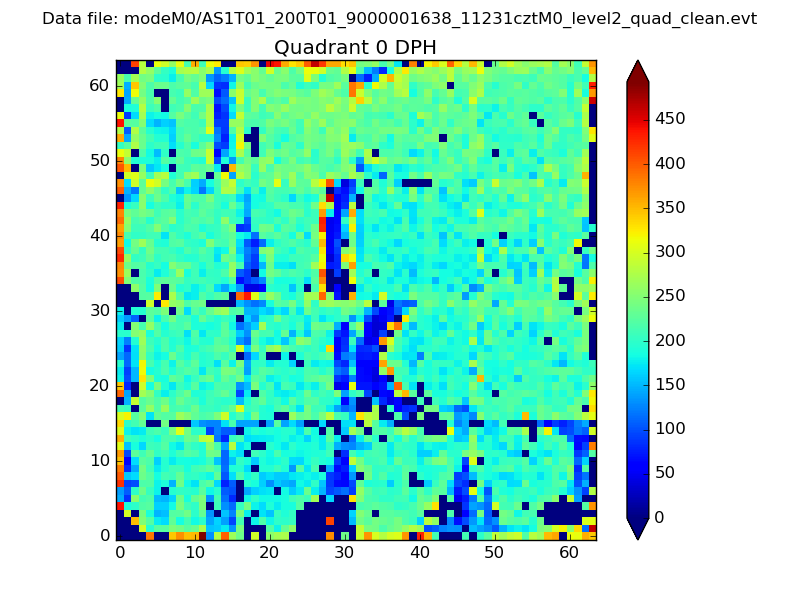 |
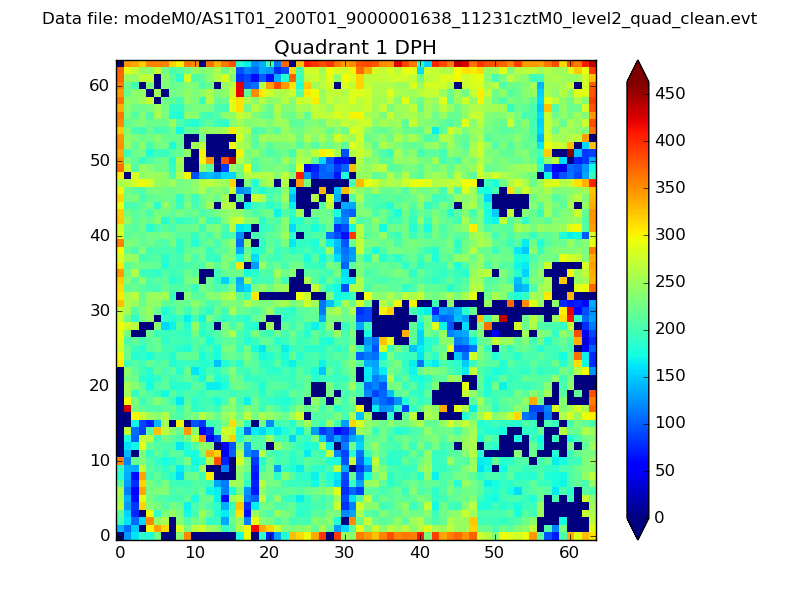 |
Quadrant B |
|---|---|---|---|
| Quadrant D | 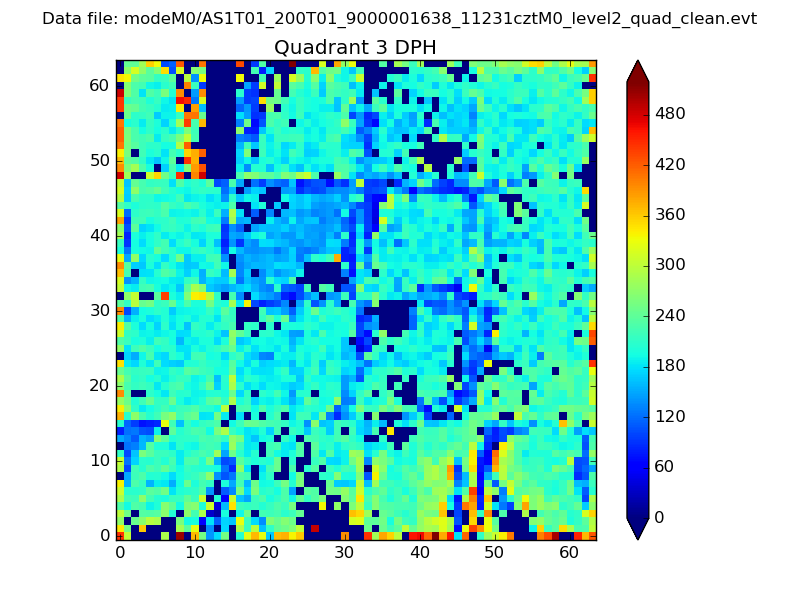 |
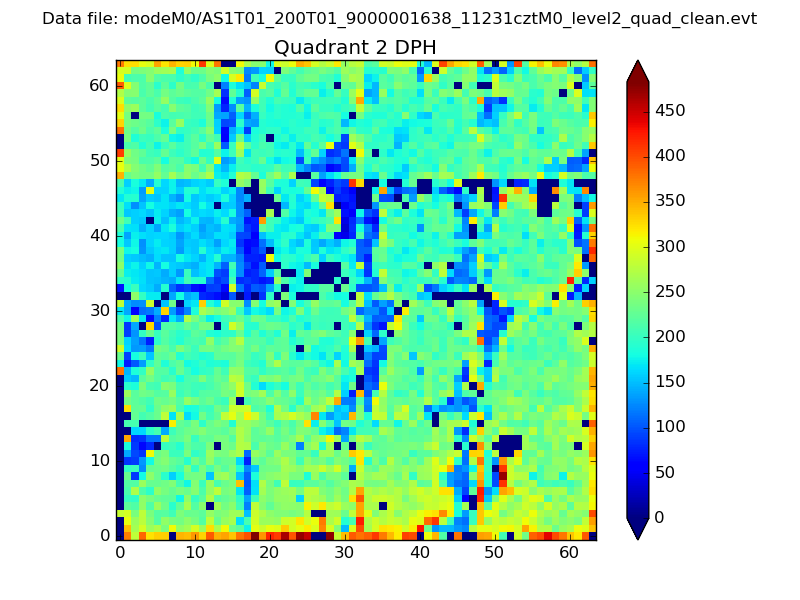 |
Quadrant C |
| Plot type | Count rate plots | Images |
|---|---|---|
| Comparison with Poisson distribution Blue bars denote a histogram of data divided into 1 sec bins. Red curve is a Poisson curve with rate = median count rate of data. |
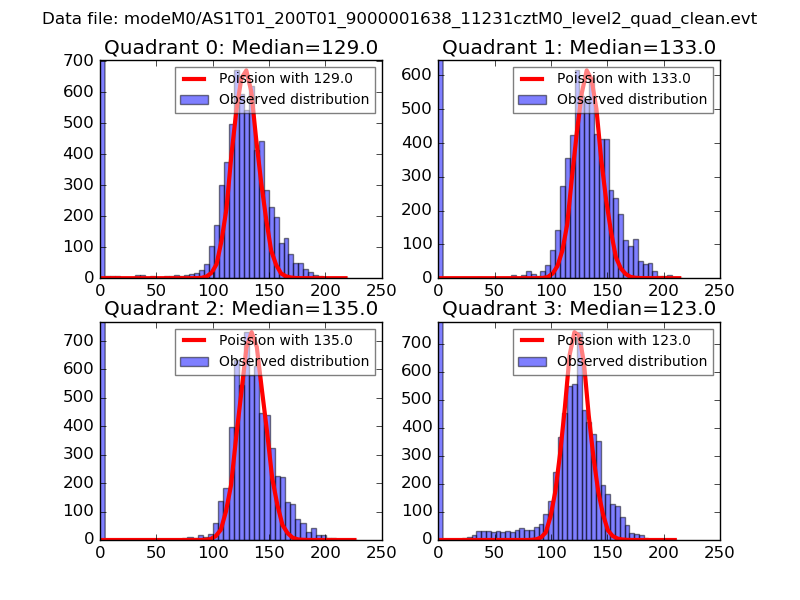 |
 |
| Quadrant-wise count rates Data is divided into 100 sec bins |
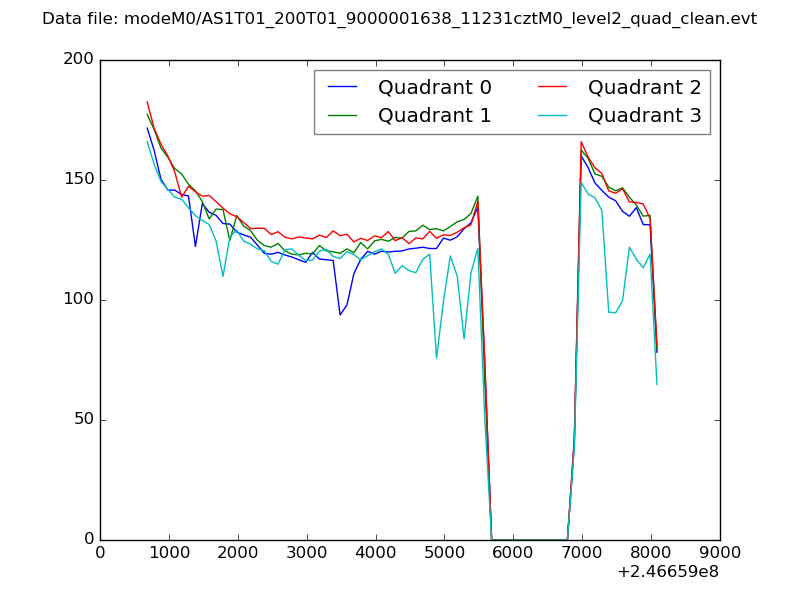 |
|
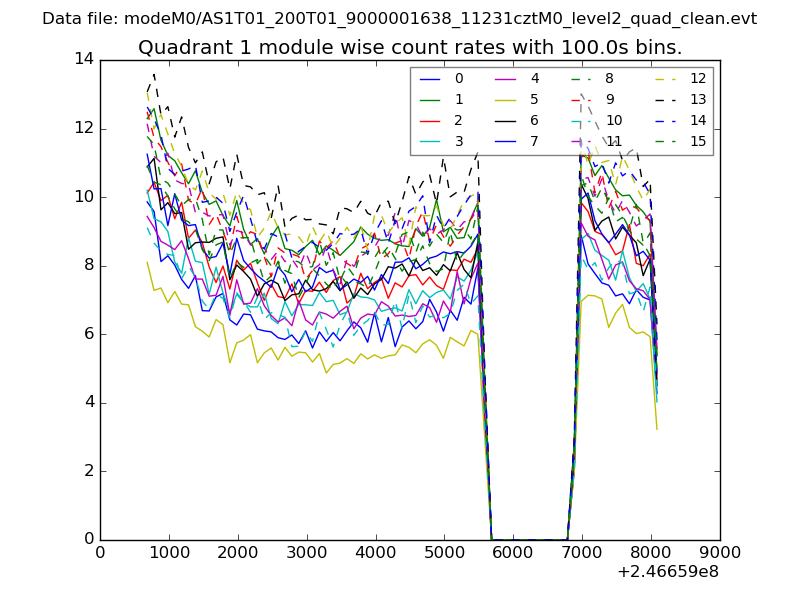
| Module-wise count rates for Quadrant A Data is divided into 100 sec bins |
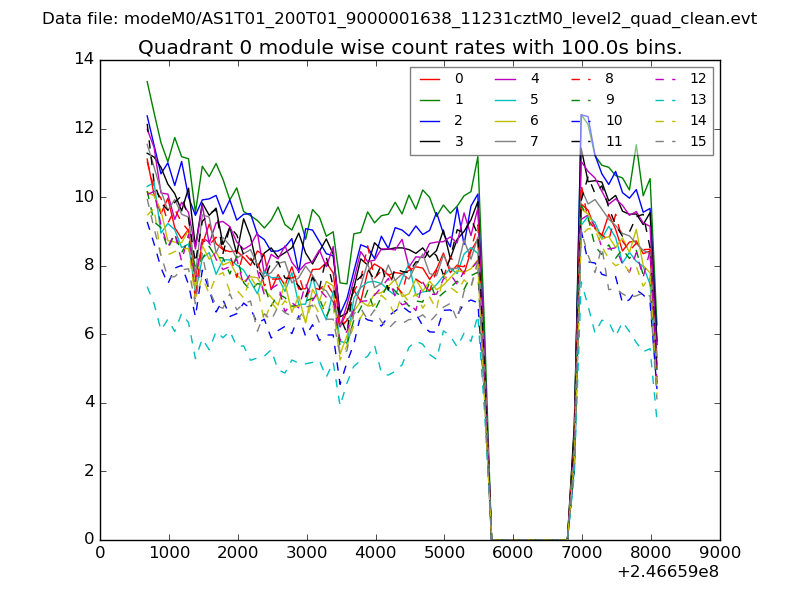 |
 |
| Module-wise count rates for Quadrant B Data is divided into 100 sec bins |
 |
 |
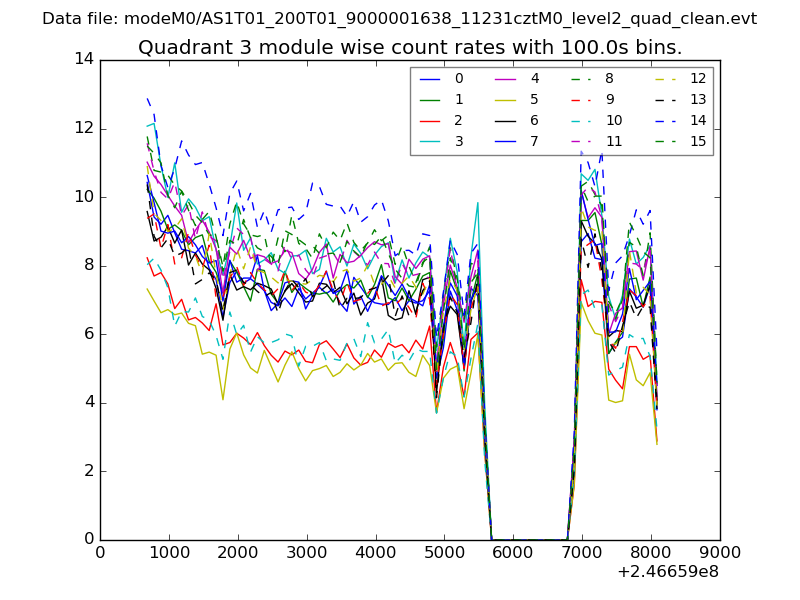
| Module-wise count rates for Quadrant C Data is divided into 100 sec bins |
 |
 |
| Module-wise count rates for Quadrant D Data is divided into 100 sec bins |
 |
 |
| Parameter | Plot |
|---|---|
| CZT HV Monitor | 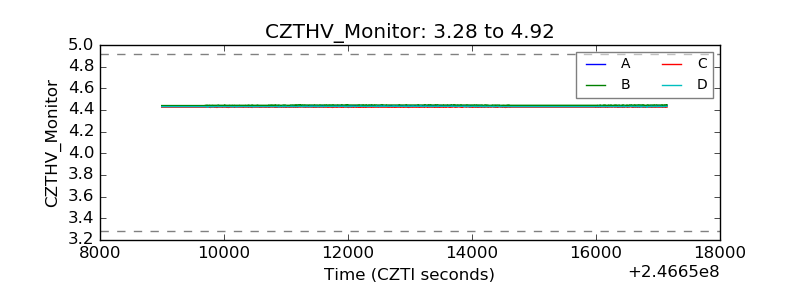 |
| D_VDD | 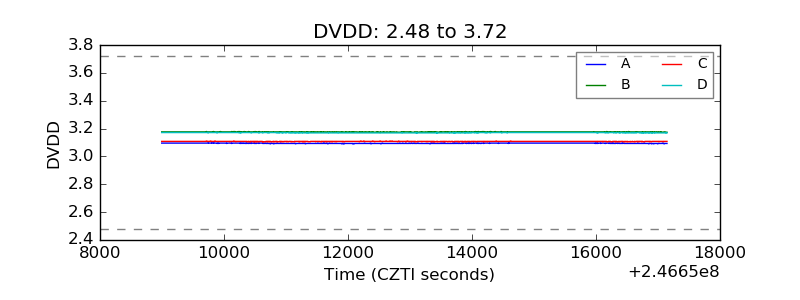 |
| Temperature 1 | 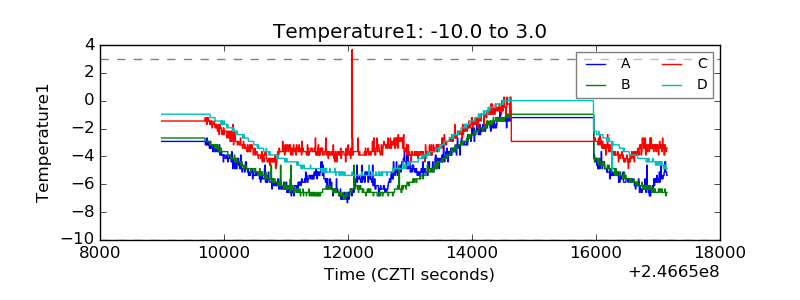 |
| Veto HV Monitor | 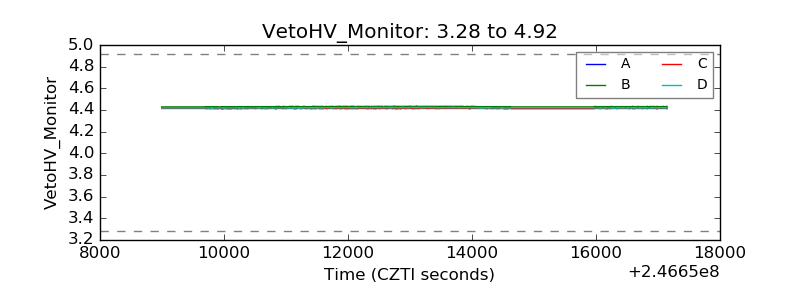 |
| Veto LLD | 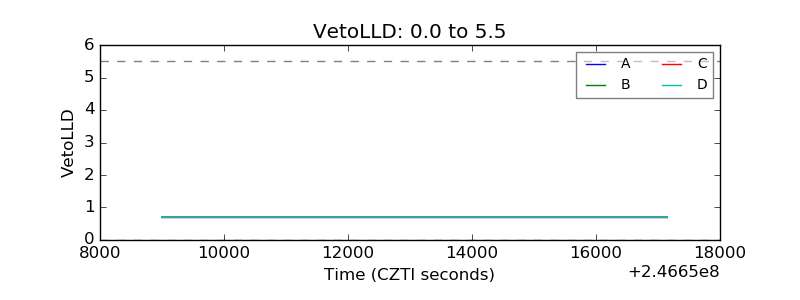 |
| Alpha Counter | 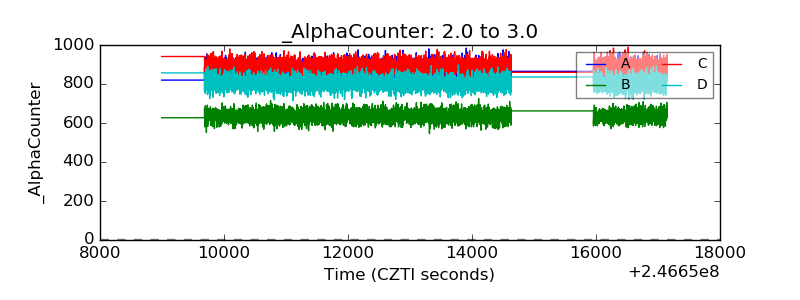 |
| _CPM_Rate | 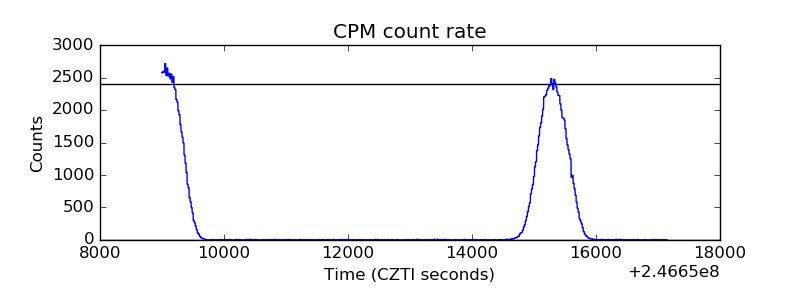 |
| CZT Counter | 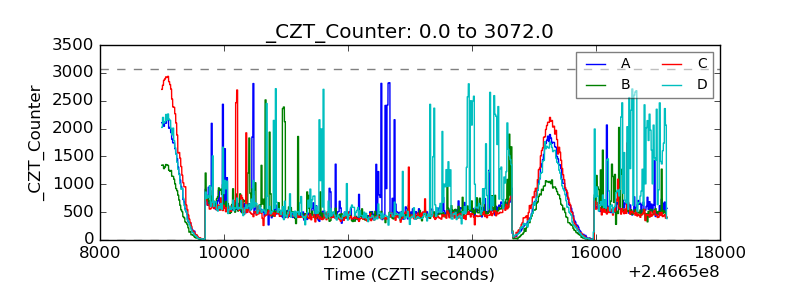 |
| +2.5 Volts monitor |  |
| +5 Volts monitor | 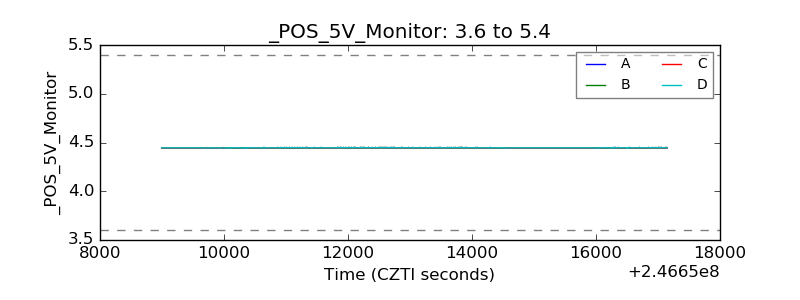 |
| _ROLL_ROT | 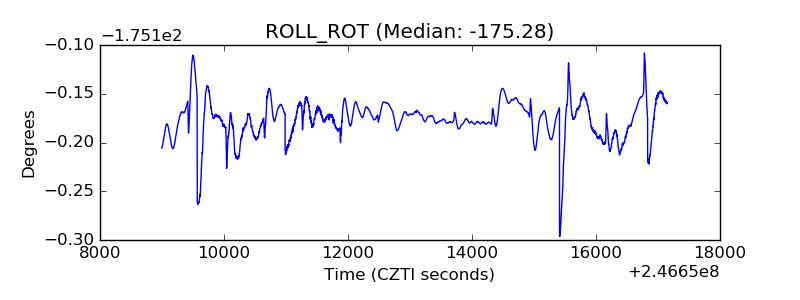 |
| _Roll_DEC | 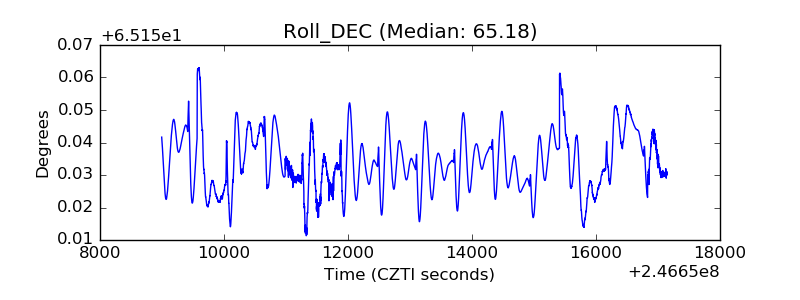 |
| _Roll_RA | 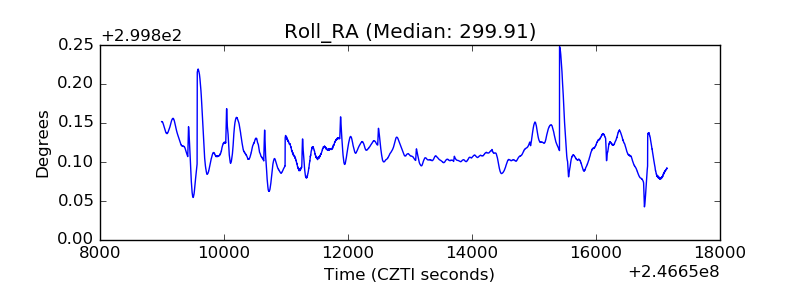 |
| Veto Counter |  |