| Param | Original file | Final file |
|---|---|---|
| Filename | modeM0/AS1T01_200T01_9000001638_11232cztM0_level2.evt | modeM0/AS1T01_200T01_9000001638_11232cztM0_level2_quad_clean.evt |
| Size (bytes) | 566,910,720 | 119,563,200 |
| Size | 540.6 MB | 114.0 MB |
| Events in quadrant A | 4,035,226 | 796,045 |
| Events in quadrant B | 3,415,588 | 827,471 |
| Events in quadrant C | 3,183,852 | 831,922 |
| Events in quadrant D | 6,110,761 | 729,049 |
| Mode M9 | |||
|---|---|---|---|
| Quadrant | BADHDUFLAG | Total packets | Discarded packets |
| A | 0 | 19 | 0 |
| B | 0 | 19 | 0 |
| C | 0 | 19 | 0 |
| D | 0 | 20 | 0 |
| Mode SS | |||
|---|---|---|---|
| Quadrant | BADHDUFLAG | Total packets | Discarded packets |
| A | 0 | 128 | 0 |
| B | 0 | 128 | 0 |
| C | 0 | 128 | 0 |
| D | 0 | 128 | 0 |
| Mode M0 | |||
|---|---|---|---|
| Quadrant | BADHDUFLAG | Total packets | Discarded packets |
| A | 0 | 16224 | 3 |
| B | 0 | 14418 | 2 |
| C | 0 | 13725 | 2 |
| D | 0 | 22474 | 2 |
| Quadrant | Total seconds | Saturated seconds | Saturation percentage |
|---|---|---|---|
| A | 6248 | 182 | 2.912932% |
| B | 6248 | 154 | 2.464789% |
| C | 6248 | 83 | 1.328425% |
| D | 6248 | 800 | 12.804097% |
Noise dominated data is calculated using 1-second bins in cleaned event files. If a bin has >2000 counts, and if more than 50% of those come from <1% of pixels, then it is considered to be noise-dominated and hence unusable.
| Quadrant | # 1 sec bins | Bins with >0 counts | Bins with >2000 counts | High rate bins dominated by noise | Noise dominated (total time) | Noise dominated (detector-on time) | Marked lightcurve |
|---|---|---|---|---|---|---|---|
| A | 7528 | 6249 | 80 | 80 | 1.06% | 1.28% | 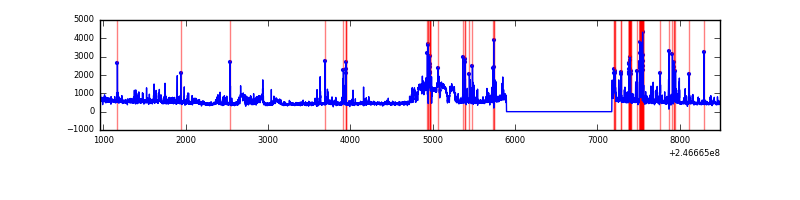 |
| B | 7528 | 6249 | 54 | 54 | 0.72% | 0.86% | 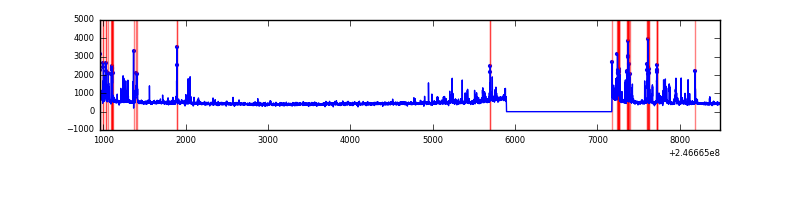 |
| C | 7528 | 6249 | 35 | 35 | 0.46% | 0.56% | 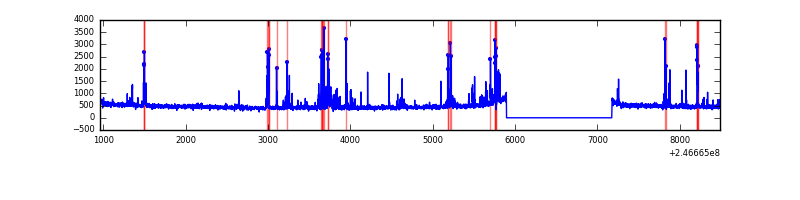 |
| D | 7528 | 6249 | 819 | 819 | 10.88% | 13.11% | 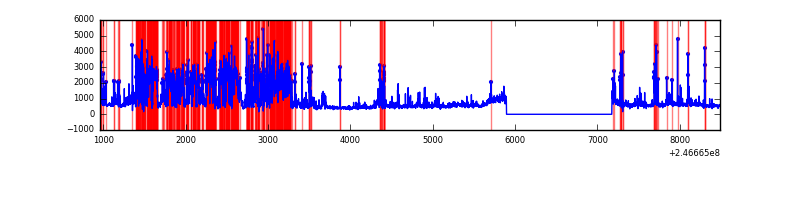 |
Top three noisy pixels from each quadrant. If the there are fewer than three noisy pixels in the level2.evt file, extra rows are filled as -1
| Pixel properties | Quadrant properties | ||||||
|---|---|---|---|---|---|---|---|
| Quadrant | DetID | PixID | Counts | Sigma | Mean | Median | Sigma |
| A | 15 | 174 | 486845 | 3339.88 | 720 | 704 | 145.6 |
| A | 8 | 5 | 462873 | 3175.19 | 720 | 704 | 145.6 |
| A | 14 | 238 | 250007 | 1712.76 | 720 | 704 | 145.6 |
| B | 4 | 239 | 449954 | 3281.12 | 736 | 718 | 136.9 |
| B | 3 | 189 | 30352 | 216.44 | 736 | 718 | 136.9 |
| B | 0 | 214 | 18815 | 132.18 | 736 | 718 | 136.9 |
| C | 4 | 254 | 361403 | 2182.13 | 721 | 727 | 165.3 |
| C | 13 | 61 | 5226 | 27.22 | 721 | 727 | 165.3 |
| C | 12 | 4 | 4160 | 20.77 | 721 | 727 | 165.3 |
| D | 1 | 52 | 2401626 | 14811.01 | 675 | 657 | 162.1 |
| D | 8 | 195 | 478617 | 2948.42 | 675 | 657 | 162.1 |
| D | 2 | 14 | 261370 | 1608.28 | 675 | 657 | 162.1 |
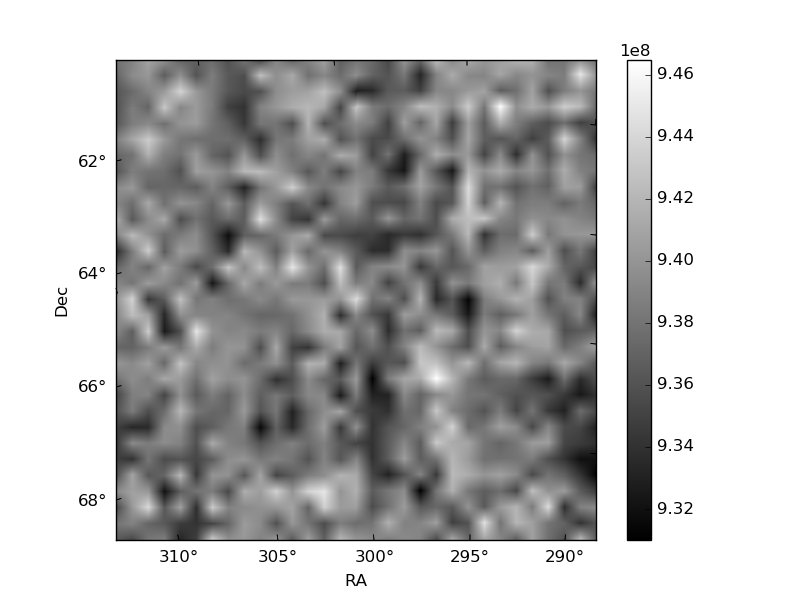
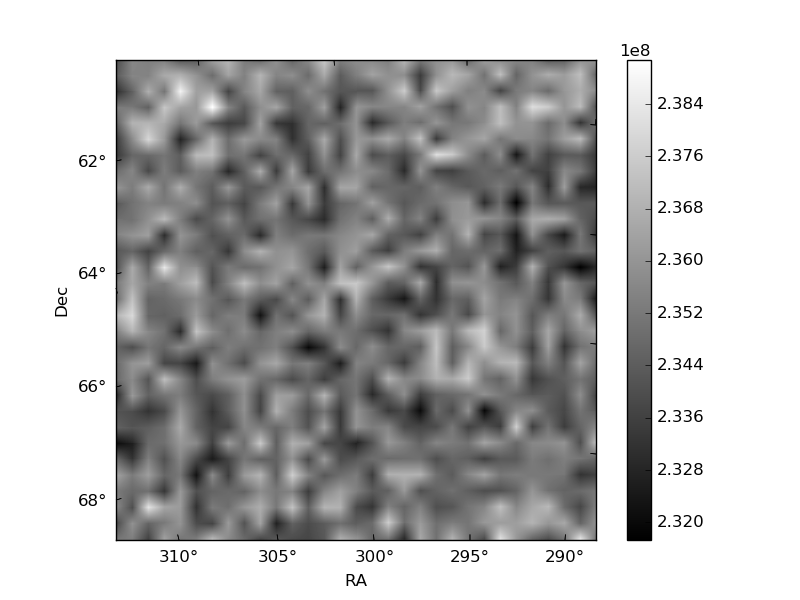
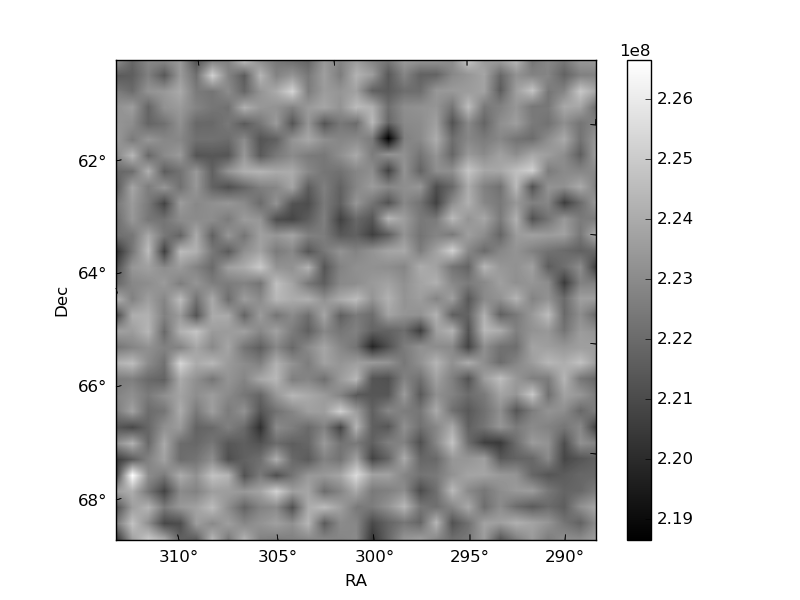
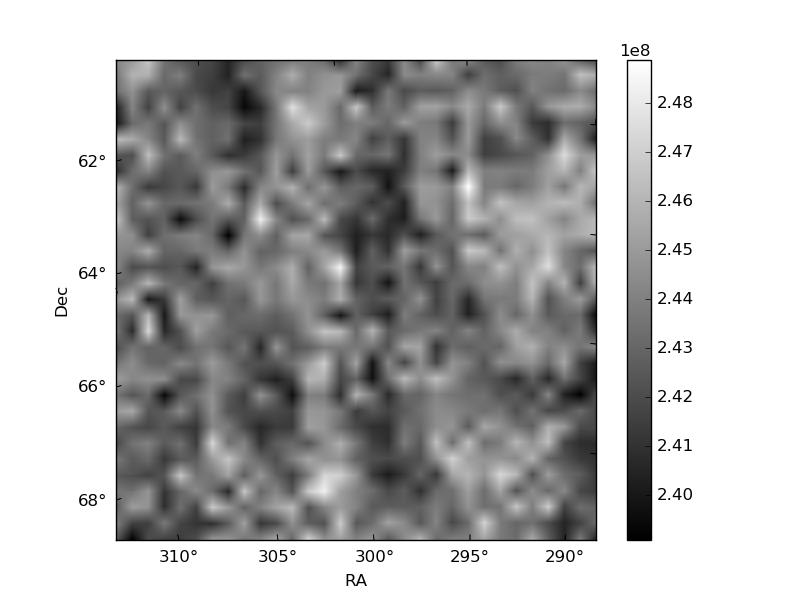
Histogram calculated using DETX and DETY for each event in the final _common_clean file
| Quadrant A | 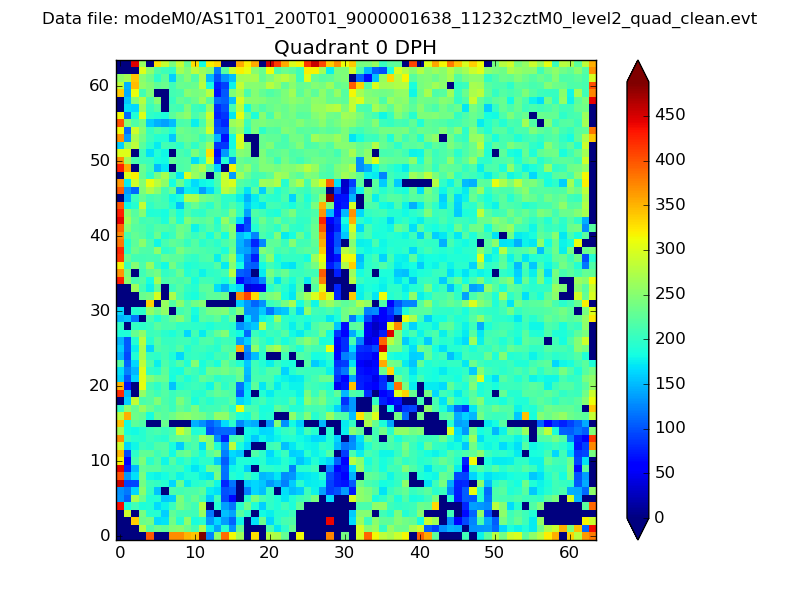 |
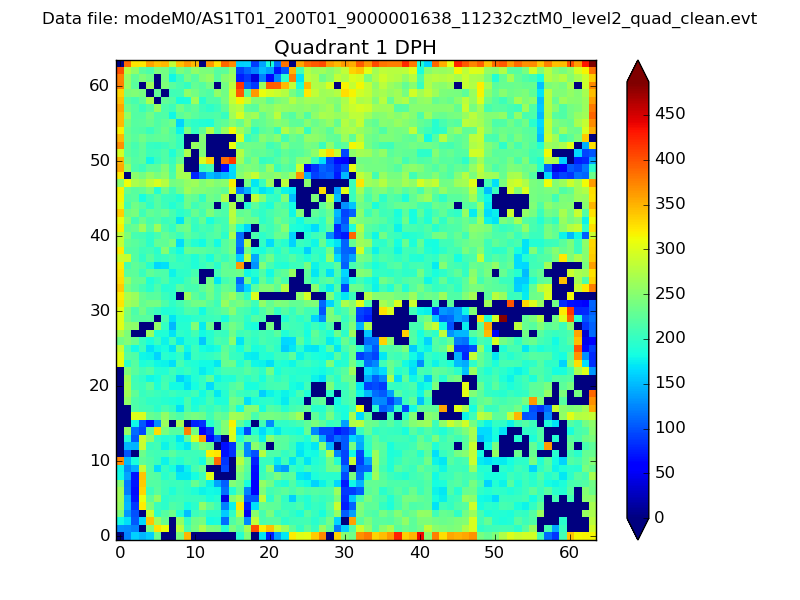 |
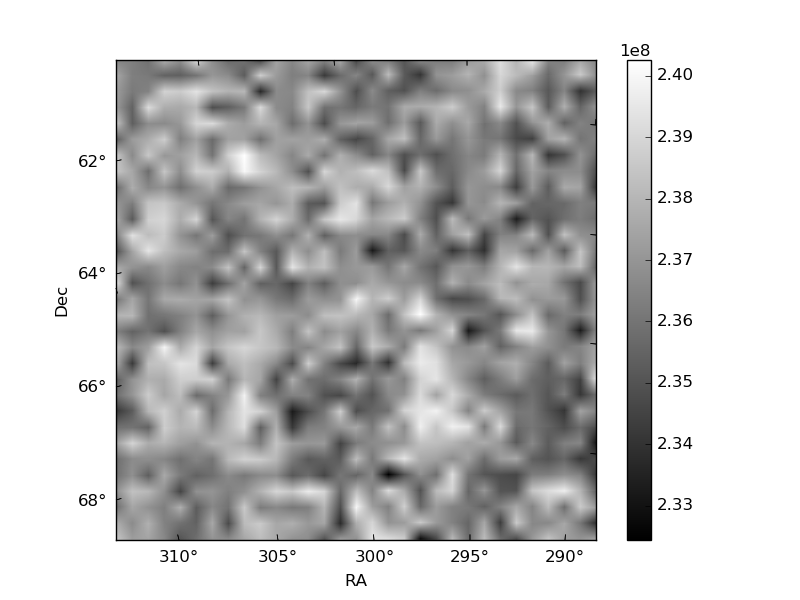
Quadrant B |
|---|---|---|---|
| Quadrant D | 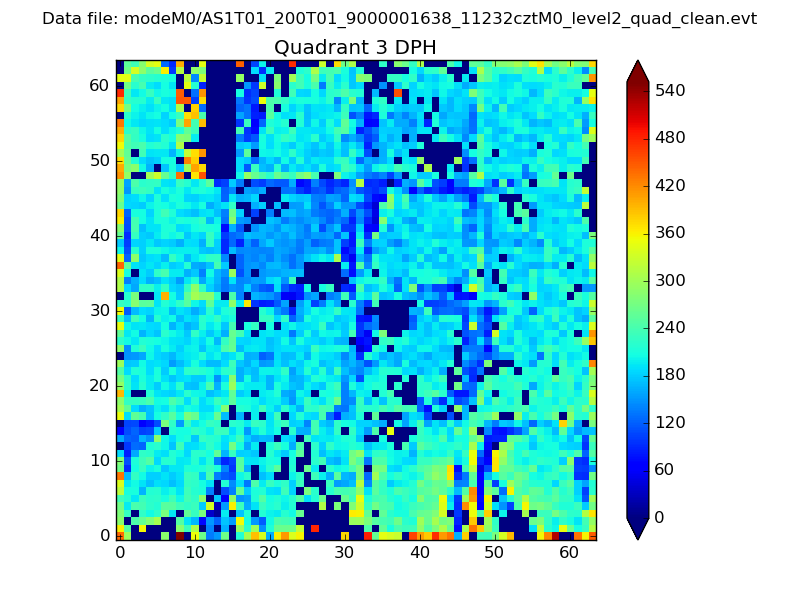 |
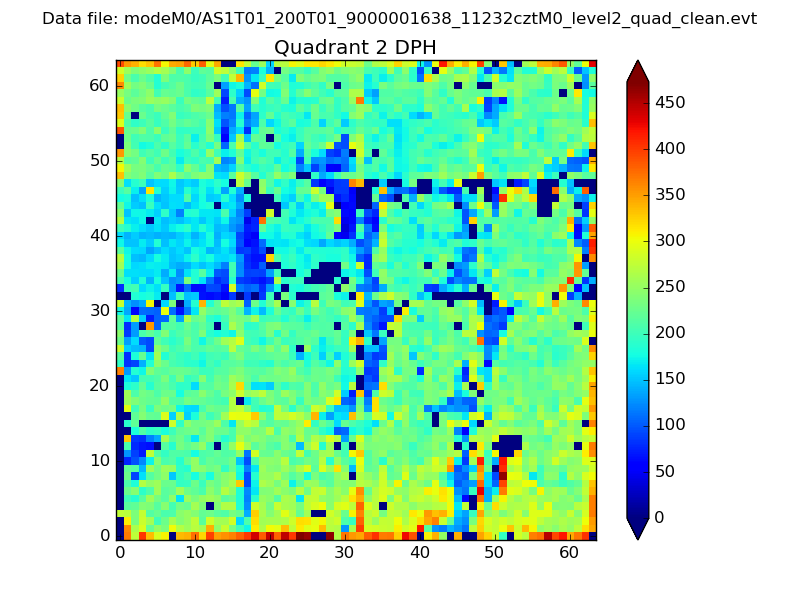 |
Quadrant C |
| Plot type | Count rate plots | Images |
|---|---|---|
| Comparison with Poisson distribution Blue bars denote a histogram of data divided into 1 sec bins. Red curve is a Poisson curve with rate = median count rate of data. |
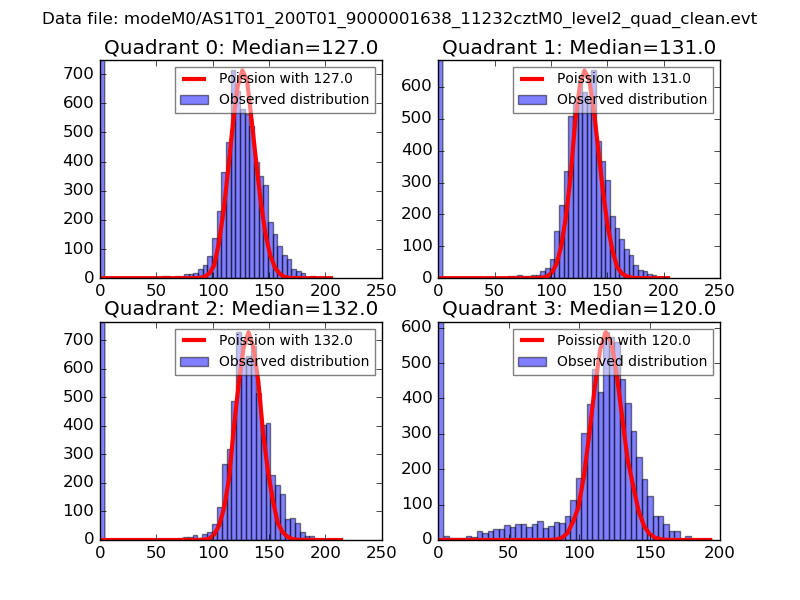 |
 |
| Quadrant-wise count rates Data is divided into 100 sec bins |
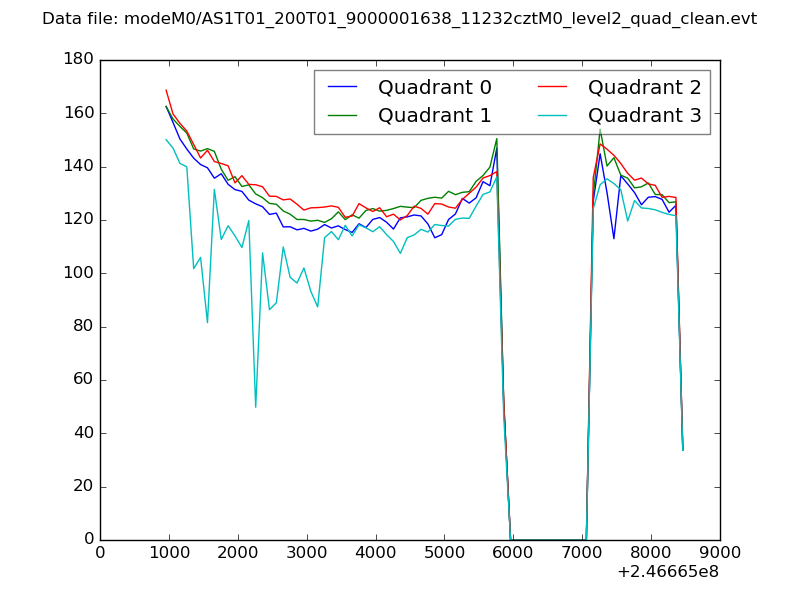 |
|
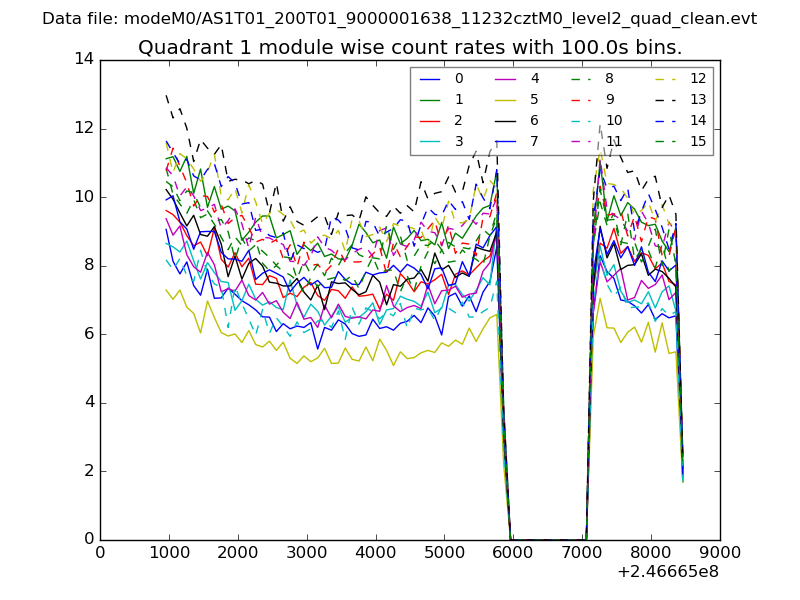
| Module-wise count rates for Quadrant A Data is divided into 100 sec bins |
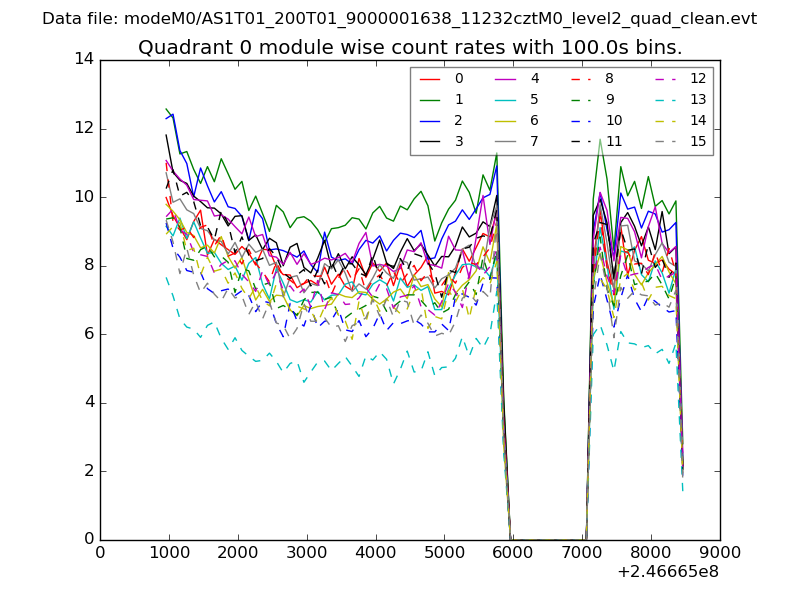 |
 |
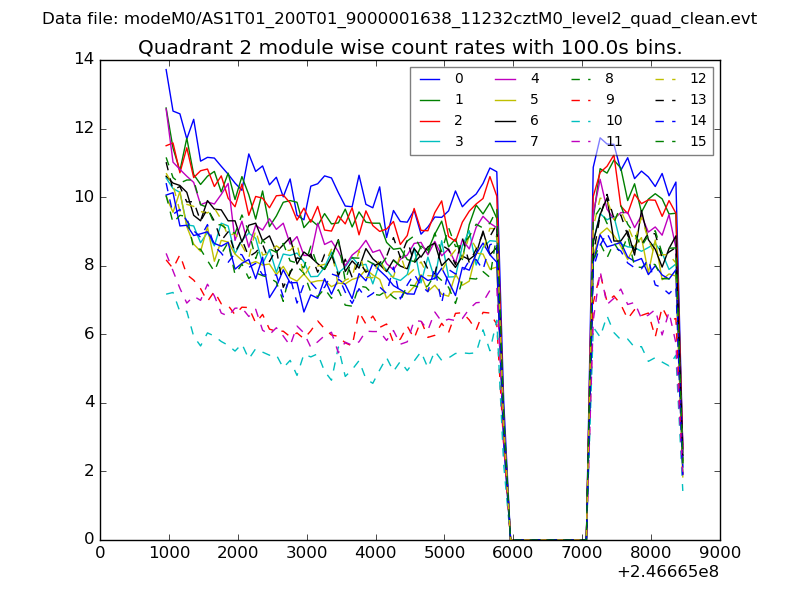
| Module-wise count rates for Quadrant B Data is divided into 100 sec bins |
 |
 |
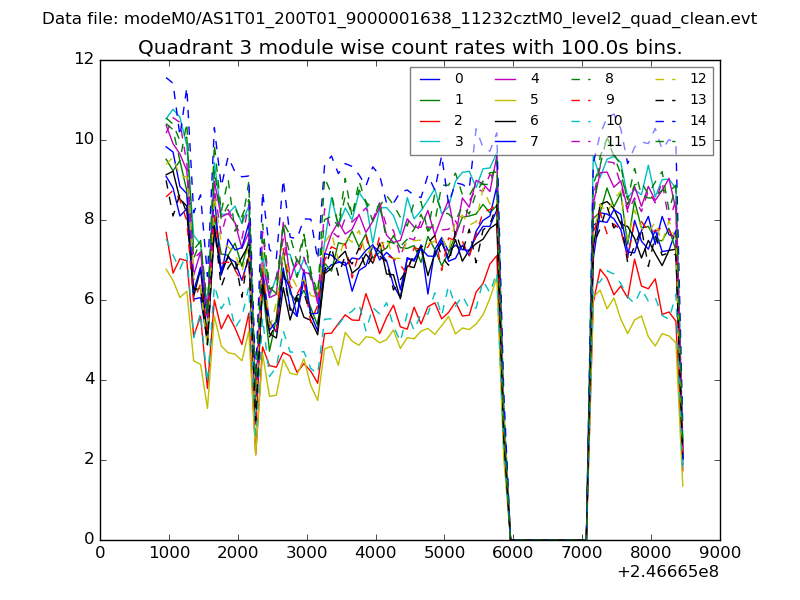
| Module-wise count rates for Quadrant C Data is divided into 100 sec bins |
 |
 |
| Module-wise count rates for Quadrant D Data is divided into 100 sec bins |
 |
 |
| Parameter | Plot |
|---|---|
| CZT HV Monitor |  |
| D_VDD | 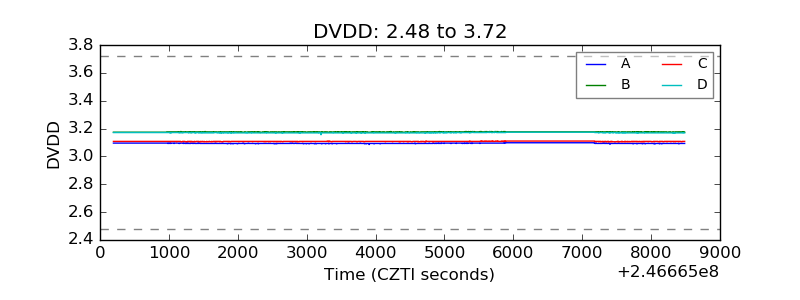 |
| Temperature 1 | 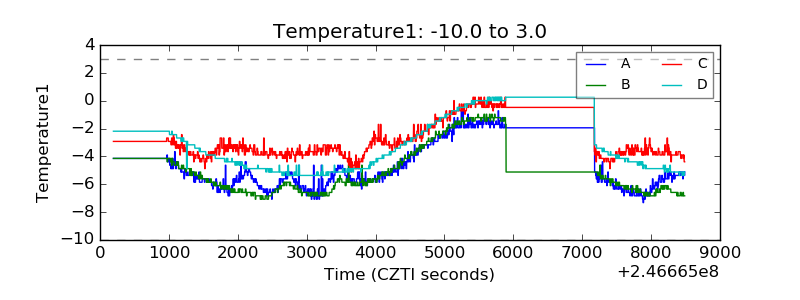 |
| Veto HV Monitor | 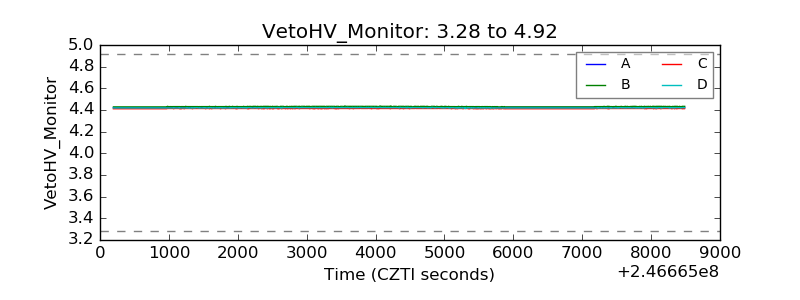 |
| Veto LLD |  |
| Alpha Counter | 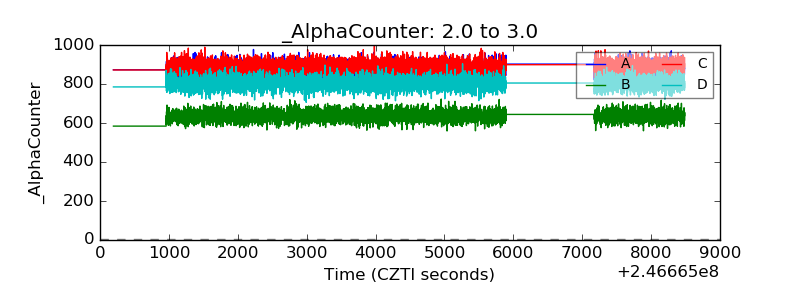 |
| _CPM_Rate | 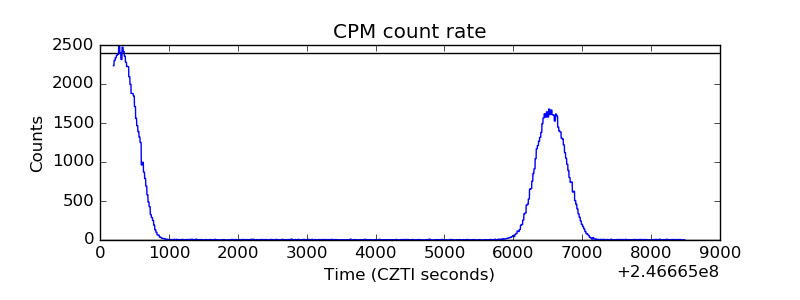 |
| CZT Counter | 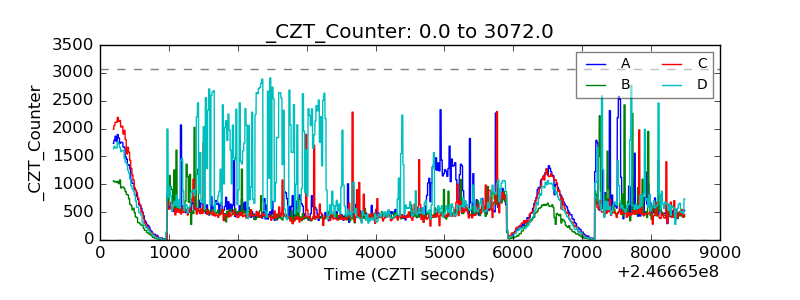 |
| +2.5 Volts monitor |  |
| +5 Volts monitor | 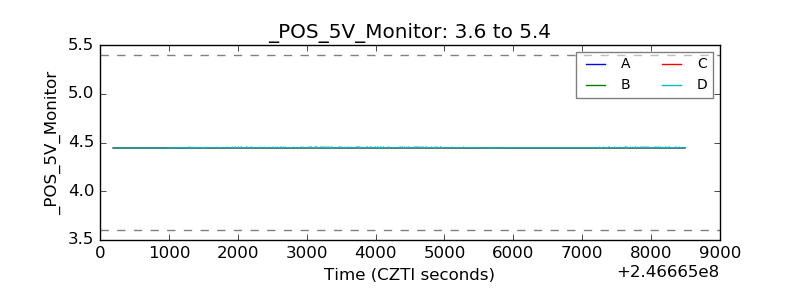 |
| _ROLL_ROT | 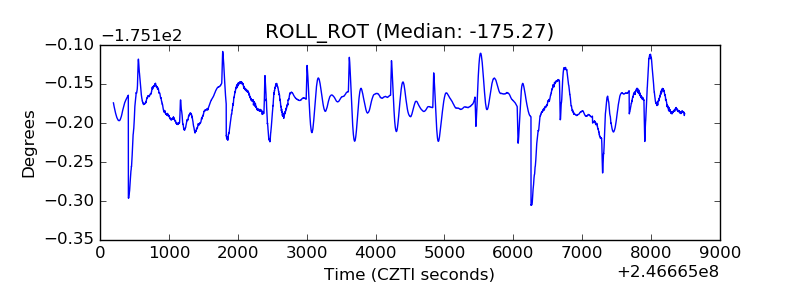 |
| _Roll_DEC | 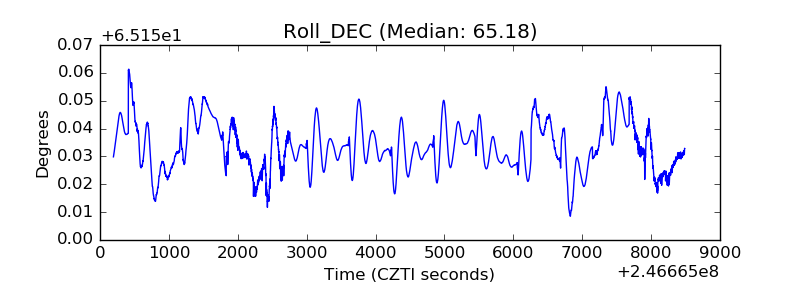 |
| _Roll_RA | 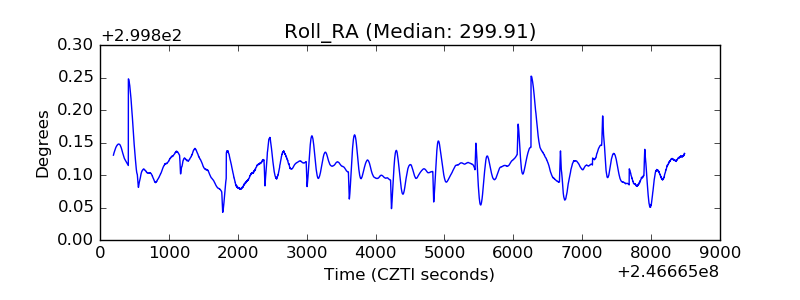 |
| Veto Counter |  |