| Param | Original file | Final file |
|---|---|---|
| Filename | modeM0/AS1T01_200T01_9000001638_11233cztM0_level2.evt | modeM0/AS1T01_200T01_9000001638_11233cztM0_level2_quad_clean.evt |
| Size (bytes) | 640,416,960 | 124,110,720 |
| Size | 610.7 MB | 118.4 MB |
| Events in quadrant A | 5,544,701 | 801,659 |
| Events in quadrant B | 3,674,359 | 861,112 |
| Events in quadrant C | 3,647,869 | 856,050 |
| Events in quadrant D | 6,069,802 | 767,741 |
| Mode M9 | |||
|---|---|---|---|
| Quadrant | BADHDUFLAG | Total packets | Discarded packets |
| A | 0 | 24 | 0 |
| B | 0 | 24 | 0 |
| C | 0 | 24 | 0 |
| D | 0 | 24 | 0 |
| Mode SS | |||
|---|---|---|---|
| Quadrant | BADHDUFLAG | Total packets | Discarded packets |
| A | 0 | 140 | 0 |
| B | 0 | 140 | 0 |
| C | 0 | 140 | 0 |
| D | 0 | 140 | 0 |
| Mode M0 | |||
|---|---|---|---|
| Quadrant | BADHDUFLAG | Total packets | Discarded packets |
| A | 0 | 21082 | 3 |
| B | 0 | 15599 | 2 |
| C | 0 | 15684 | 2 |
| D | 0 | 22580 | 2 |
| Quadrant | Total seconds | Saturated seconds | Saturation percentage |
|---|---|---|---|
| A | 6768 | 624 | 9.219858% |
| B | 6768 | 241 | 3.560875% |
| C | 6768 | 241 | 3.560875% |
| D | 6768 | 819 | 12.101064% |
Noise dominated data is calculated using 1-second bins in cleaned event files. If a bin has >2000 counts, and if more than 50% of those come from <1% of pixels, then it is considered to be noise-dominated and hence unusable.
| Quadrant | # 1 sec bins | Bins with >0 counts | Bins with >2000 counts | High rate bins dominated by noise | Noise dominated (total time) | Noise dominated (detector-on time) | Marked lightcurve |
|---|---|---|---|---|---|---|---|
| A | 9183 | 6770 | 397 | 397 | 4.32% | 5.86% | 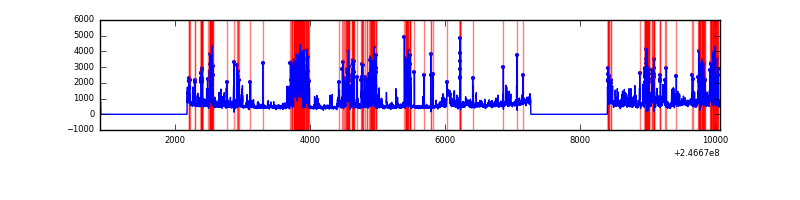 |
| B | 9183 | 6770 | 49 | 49 | 0.53% | 0.72% | 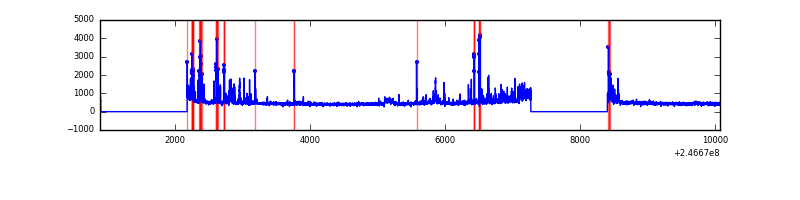 |
| C | 9183 | 6770 | 110 | 110 | 1.20% | 1.62% | 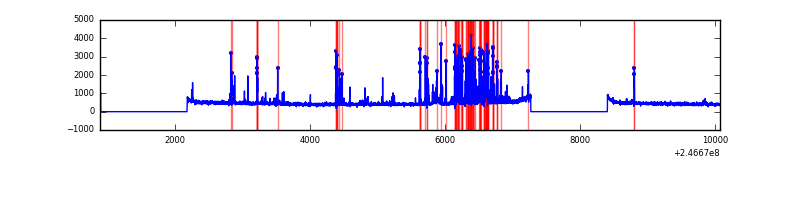 |
| D | 9183 | 6770 | 588 | 588 | 6.40% | 8.69% | 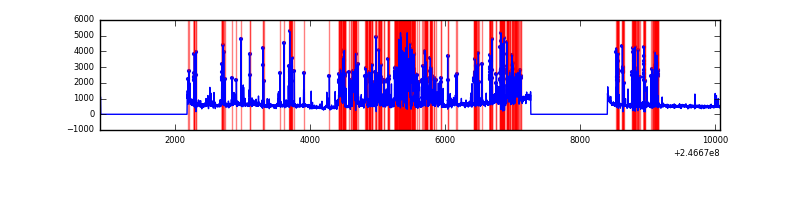 |
Top three noisy pixels from each quadrant. If the there are fewer than three noisy pixels in the level2.evt file, extra rows are filled as -1
| Pixel properties | Quadrant properties | ||||||
|---|---|---|---|---|---|---|---|
| Quadrant | DetID | PixID | Counts | Sigma | Mean | Median | Sigma |
| A | 14 | 238 | 1450299 | 9586.44 | 752 | 736 | 151.2 |
| A | 8 | 5 | 749336 | 4950.74 | 752 | 736 | 151.2 |
| A | 15 | 174 | 267213 | 1762.3 | 752 | 736 | 151.2 |
| B | 4 | 239 | 474704 | 3252.05 | 782 | 761 | 145.7 |
| B | 10 | 244 | 49213 | 332.46 | 782 | 761 | 145.7 |
| B | 0 | 214 | 22568 | 149.63 | 782 | 761 | 145.7 |
| C | 4 | 254 | 656755 | 3751.52 | 761 | 763 | 174.9 |
| C | 1 | 3 | 12387 | 66.48 | 761 | 763 | 174.9 |
| C | 4 | 238 | 6322 | 31.79 | 761 | 763 | 174.9 |
| D | 1 | 52 | 1180937 | 6905.03 | 718 | 698 | 170.9 |
| D | 8 | 195 | 791245 | 4625.12 | 718 | 698 | 170.9 |
| D | 2 | 14 | 479372 | 2800.5 | 718 | 698 | 170.9 |
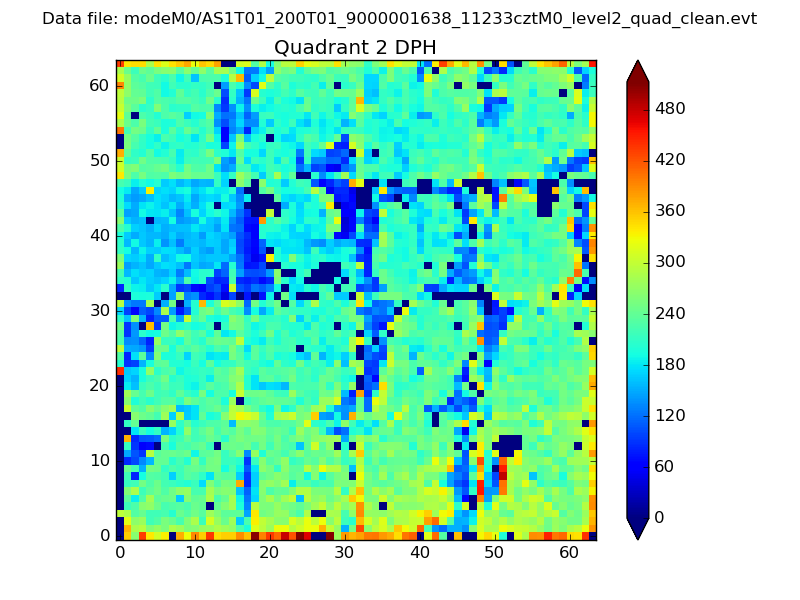
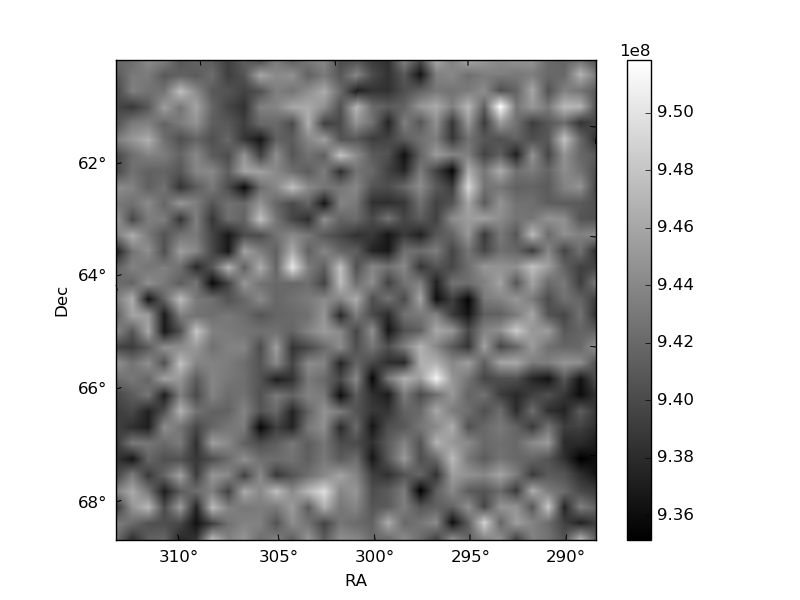
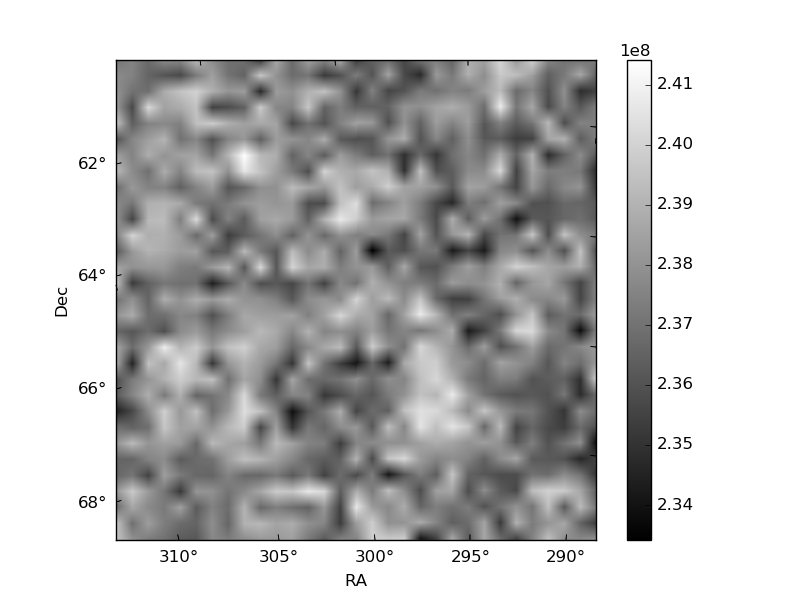
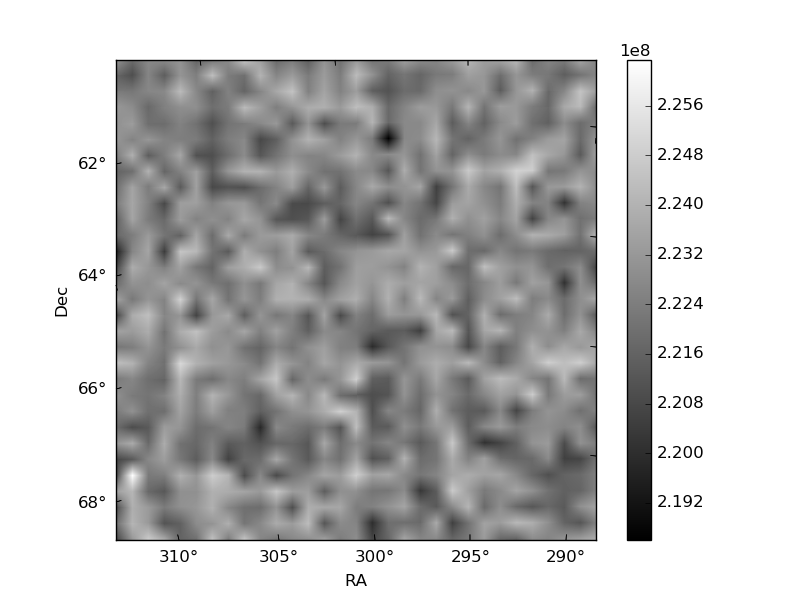
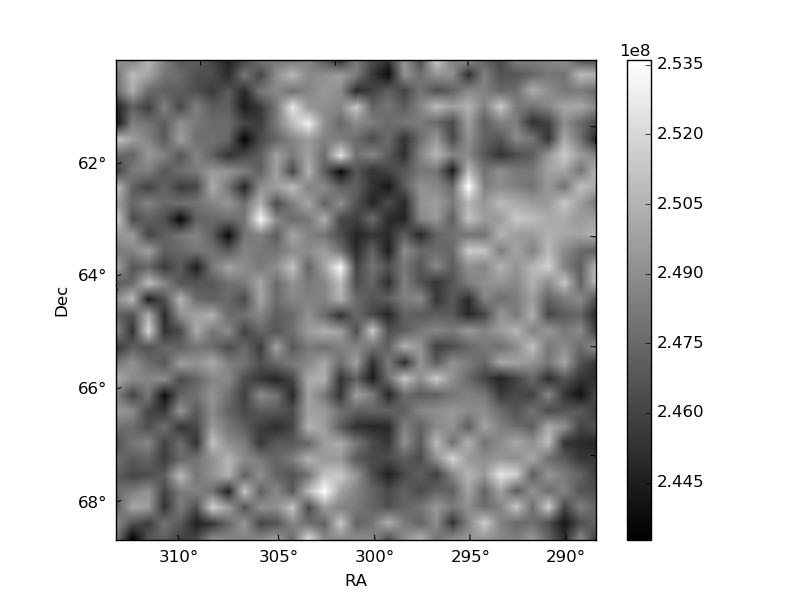
Histogram calculated using DETX and DETY for each event in the final _common_clean file
| Quadrant A | 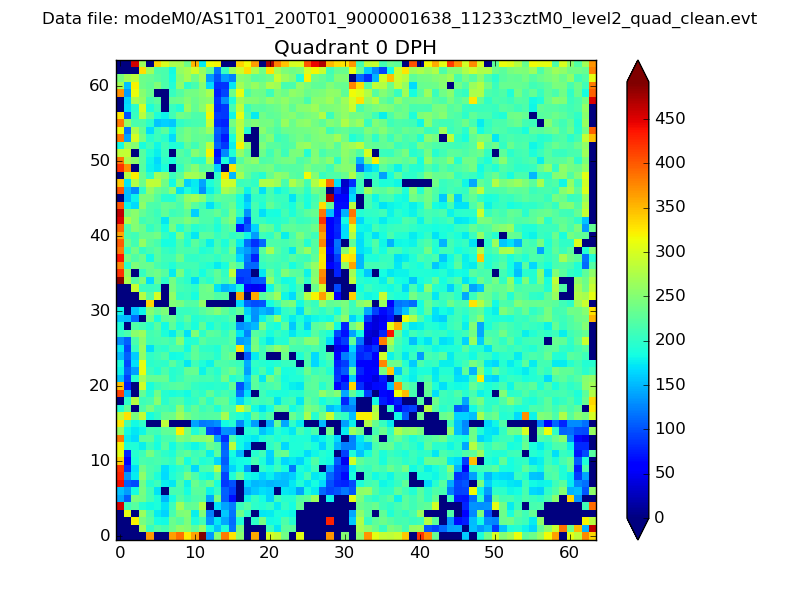 |
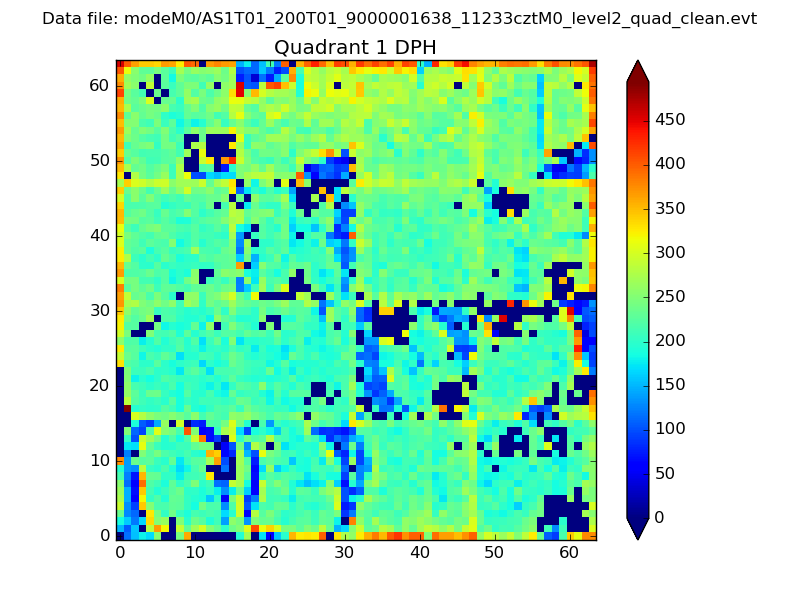 |
Quadrant B |
|---|---|---|---|
| Quadrant D | 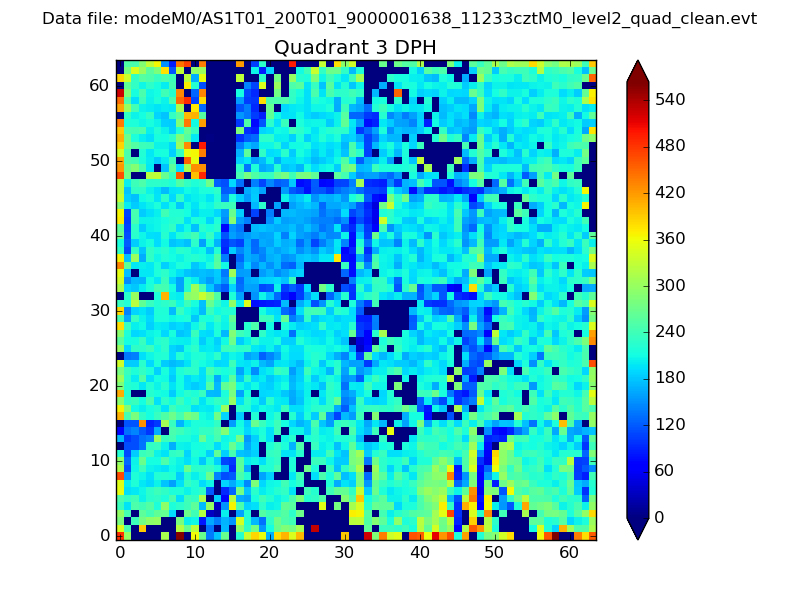 |
 |
Quadrant C |
| Plot type | Count rate plots | Images |
|---|---|---|
| Comparison with Poisson distribution Blue bars denote a histogram of data divided into 1 sec bins. Red curve is a Poisson curve with rate = median count rate of data. |
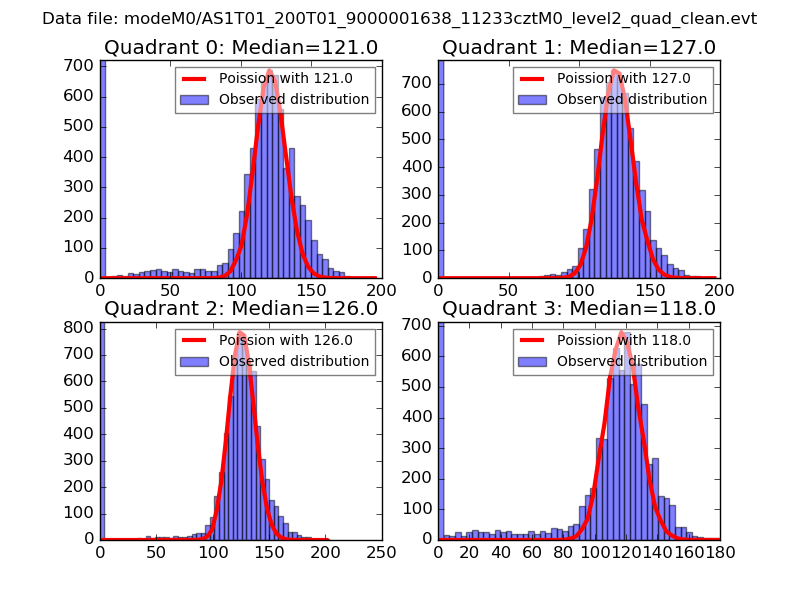 |
 |
| Quadrant-wise count rates Data is divided into 100 sec bins |
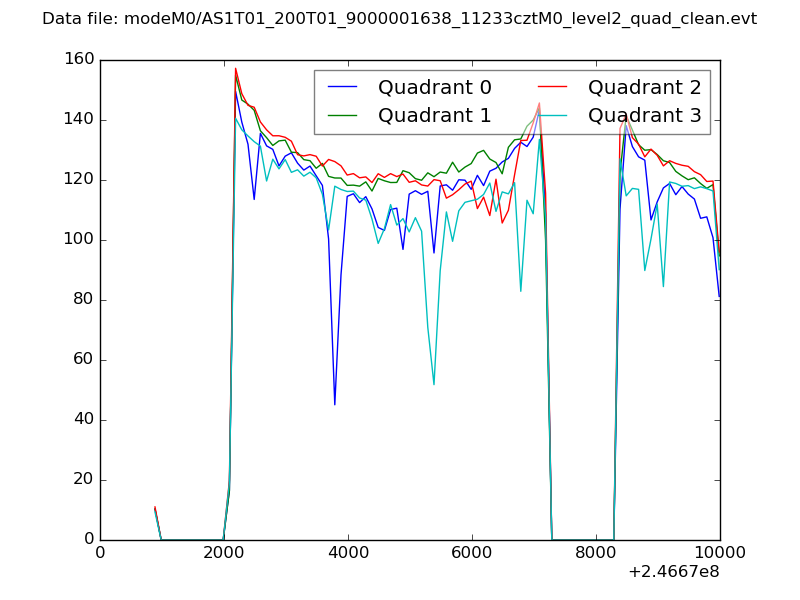 |
|
| Module-wise count rates for Quadrant A Data is divided into 100 sec bins |
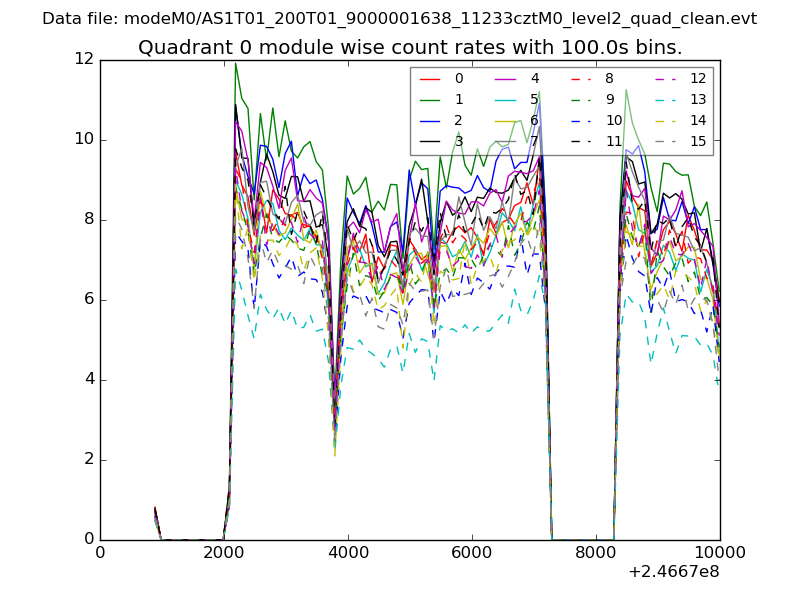 |
 |
| Module-wise count rates for Quadrant B Data is divided into 100 sec bins |
 |
 |
| Module-wise count rates for Quadrant C Data is divided into 100 sec bins |
 |
 |
| Module-wise count rates for Quadrant D Data is divided into 100 sec bins |
 |
 |
| Parameter | Plot |
|---|---|
| CZT HV Monitor | 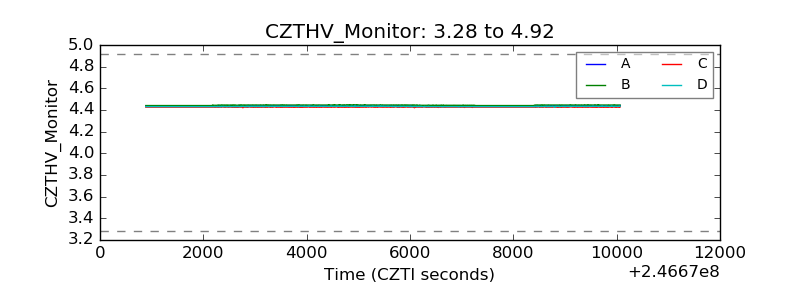 |
| D_VDD | 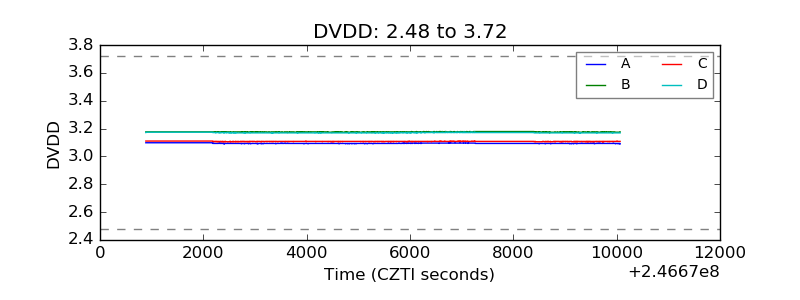 |
| Temperature 1 | 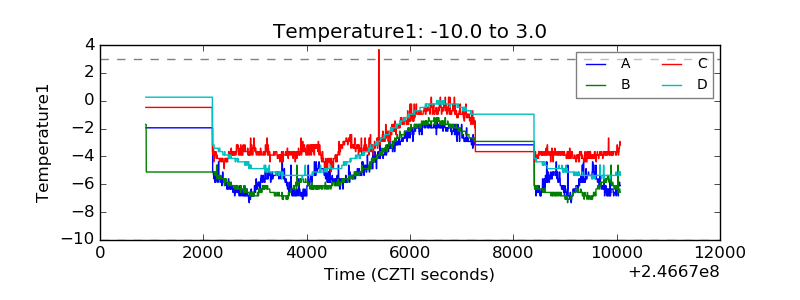 |
| Veto HV Monitor | 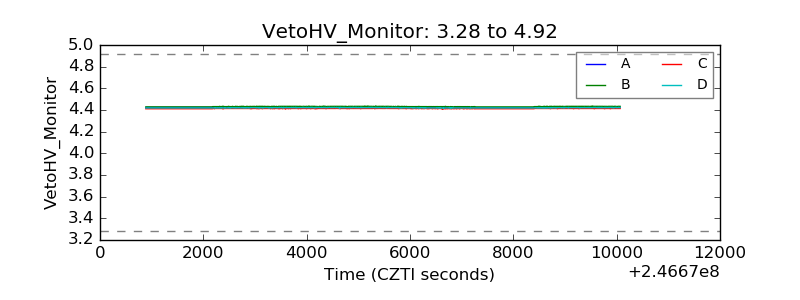 |
| Veto LLD |  |
| Alpha Counter | 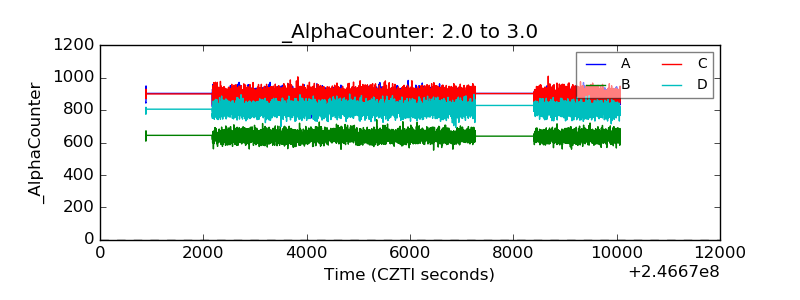 |
| _CPM_Rate | 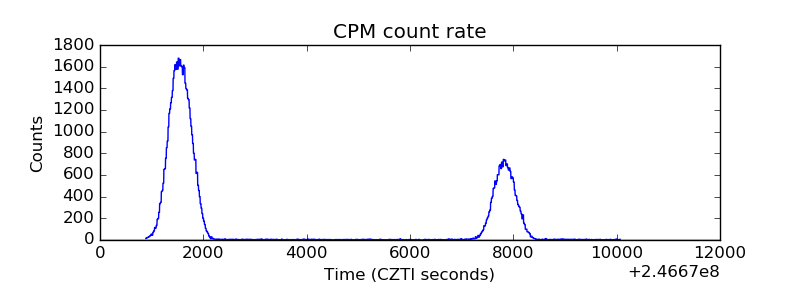 |
| CZT Counter | 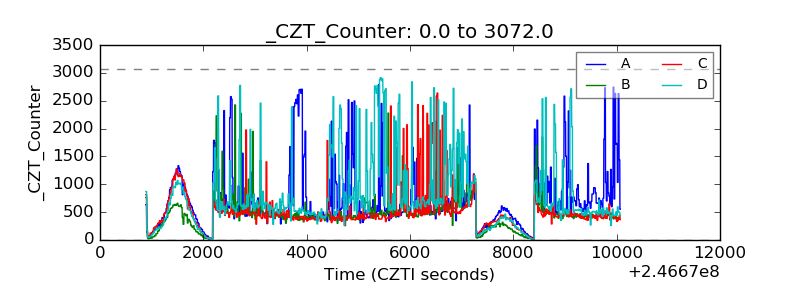 |
| +2.5 Volts monitor |  |
| +5 Volts monitor | 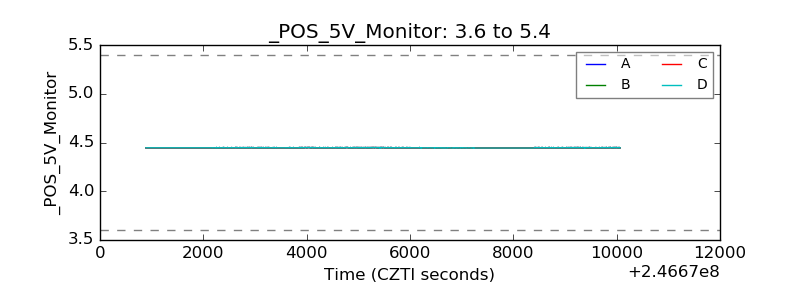 |
| _ROLL_ROT | 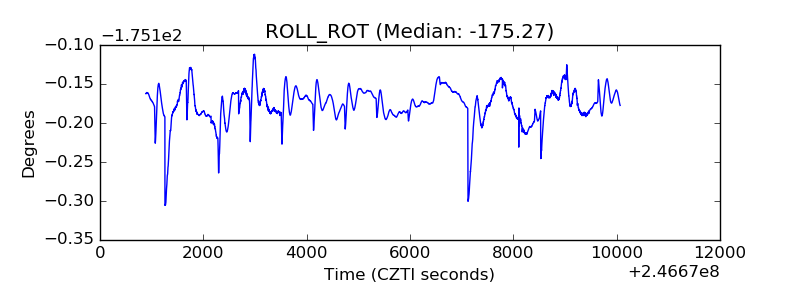 |
| _Roll_DEC | 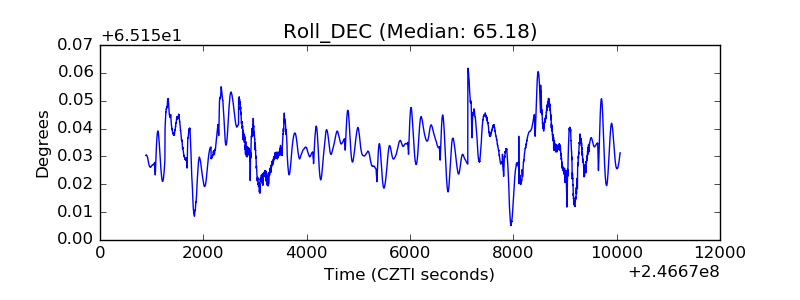 |
| _Roll_RA | 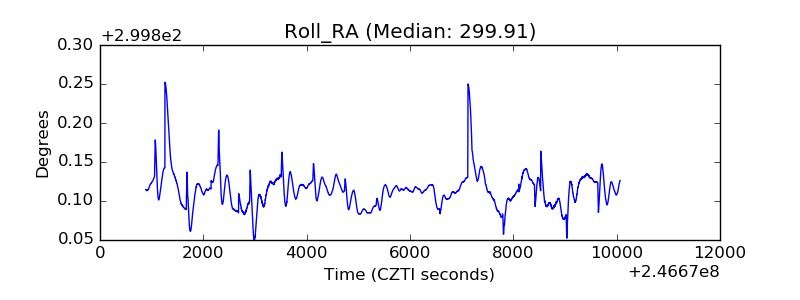 |
| Veto Counter | 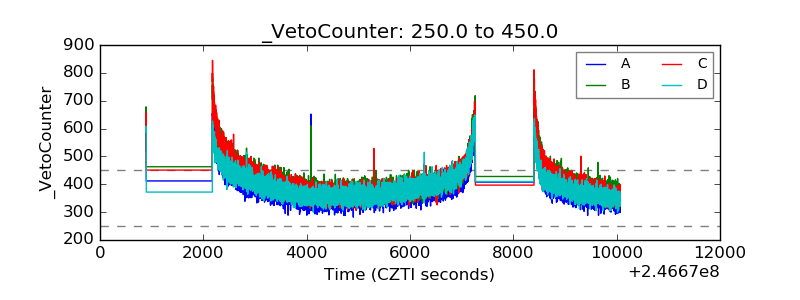 |