| Param | Original file | Final file |
|---|---|---|
| Filename | modeM0/AS1T01_200T01_9000001638_11236cztM0_level2.evt | modeM0/AS1T01_200T01_9000001638_11236cztM0_level2_quad_clean.evt |
| Size (bytes) | 592,462,080 | 128,678,400 |
| Size | 565.0 MB | 122.7 MB |
| Events in quadrant A | 4,910,053 | 834,392 |
| Events in quadrant B | 3,848,631 | 868,975 |
| Events in quadrant C | 3,977,885 | 864,776 |
| Events in quadrant D | 4,712,033 | 821,330 |
| Mode SS | |||
|---|---|---|---|
| Quadrant | BADHDUFLAG | Total packets | Discarded packets |
| A | 0 | 146 | 0 |
| B | 0 | 146 | 0 |
| C | 0 | 146 | 0 |
| D | 0 | 146 | 0 |
| Mode M0 | |||
|---|---|---|---|
| Quadrant | BADHDUFLAG | Total packets | Discarded packets |
| A | 0 | 19455 | 1 |
| B | 0 | 16450 | 0 |
| C | 0 | 17194 | 0 |
| D | 0 | 18957 | 0 |
| Quadrant | Total seconds | Saturated seconds | Saturation percentage |
|---|---|---|---|
| A | 7291 | 458 | 6.281717% |
| B | 7291 | 289 | 3.963791% |
| C | 7291 | 239 | 3.278014% |
| D | 7291 | 277 | 3.799204% |
Noise dominated data is calculated using 1-second bins in cleaned event files. If a bin has >2000 counts, and if more than 50% of those come from <1% of pixels, then it is considered to be noise-dominated and hence unusable.
| Quadrant | # 1 sec bins | Bins with >0 counts | Bins with >2000 counts | High rate bins dominated by noise | Noise dominated (total time) | Noise dominated (detector-on time) | Marked lightcurve |
|---|---|---|---|---|---|---|---|
| A | 7291 | 7291 | 145 | 145 | 1.99% | 1.99% | 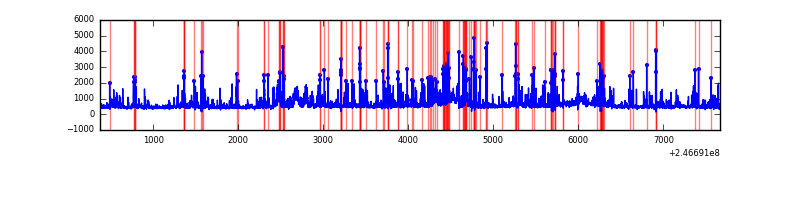 |
| B | 7291 | 7291 | 35 | 35 | 0.48% | 0.48% | 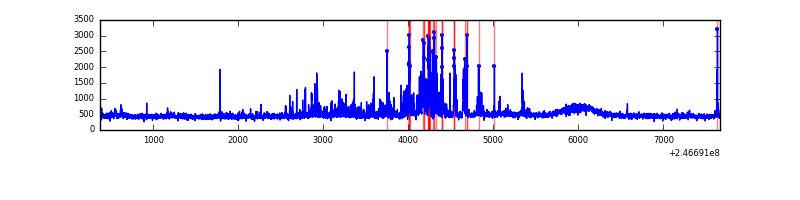 |
| C | 7291 | 7291 | 109 | 109 | 1.49% | 1.49% | 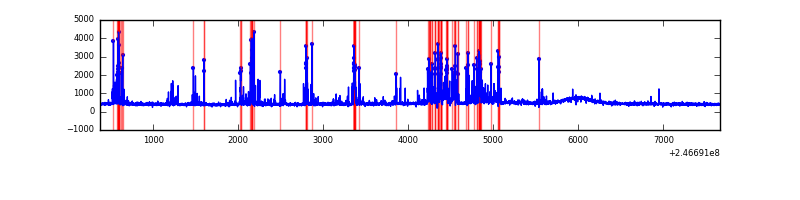 |
| D | 7291 | 7291 | 83 | 83 | 1.14% | 1.14% | 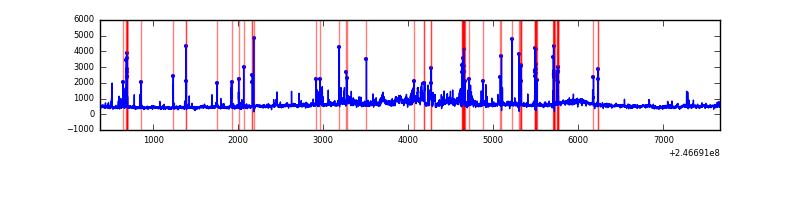 |
Top three noisy pixels from each quadrant. If the there are fewer than three noisy pixels in the level2.evt file, extra rows are filled as -1
| Pixel properties | Quadrant properties | ||||||
|---|---|---|---|---|---|---|---|
| Quadrant | DetID | PixID | Counts | Sigma | Mean | Median | Sigma |
| A | 8 | 5 | 1067563 | 6328.92 | 819 | 799 | 168.6 |
| A | 15 | 174 | 277061 | 1639.01 | 819 | 799 | 168.6 |
| A | 14 | 238 | 224441 | 1326.83 | 819 | 799 | 168.6 |
| B | 4 | 239 | 433024 | 2683.96 | 833 | 812 | 161.0 |
| B | 15 | 204 | 50938 | 311.27 | 833 | 812 | 161.0 |
| B | 0 | 219 | 43175 | 263.07 | 833 | 812 | 161.0 |
| C | 4 | 254 | 818730 | 4348.35 | 807 | 809 | 188.1 |
| C | 14 | 234 | 6380 | 29.62 | 807 | 809 | 188.1 |
| C | 13 | 61 | 5797 | 26.52 | 807 | 809 | 188.1 |
| D | 8 | 195 | 746546 | 3838.51 | 800 | 774 | 194.3 |
| D | 1 | 52 | 375035 | 1926.33 | 800 | 774 | 194.3 |
| D | 10 | 199 | 176611 | 905.04 | 800 | 774 | 194.3 |
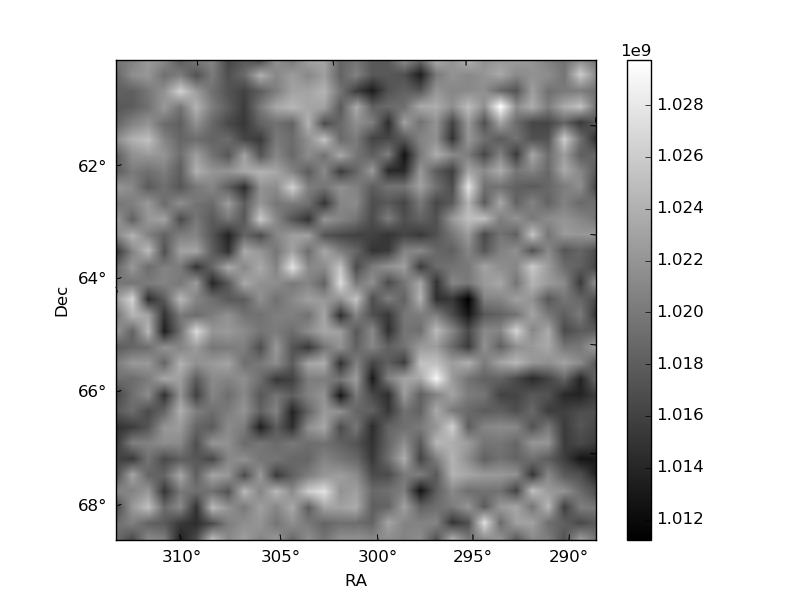
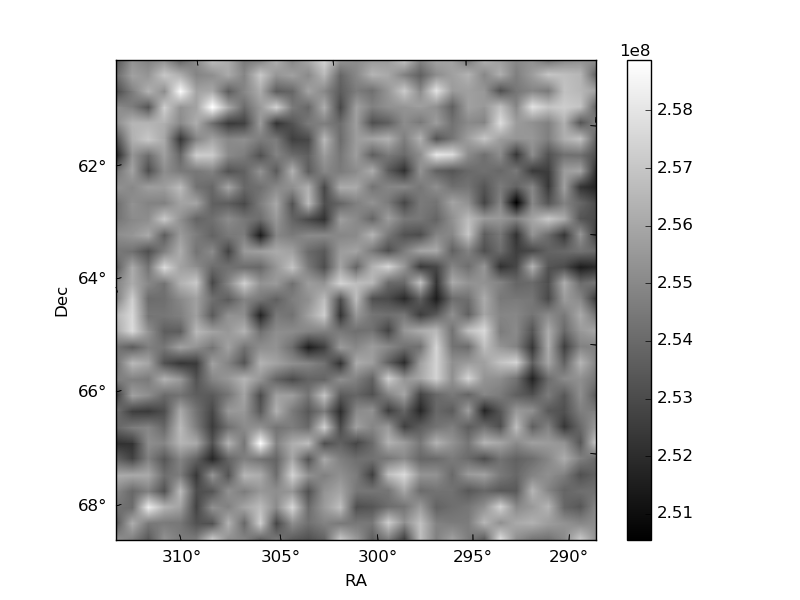
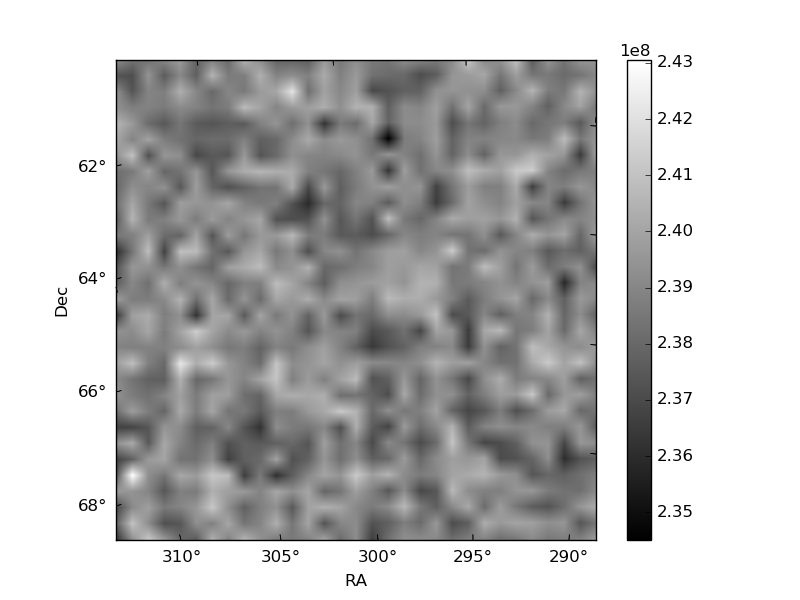
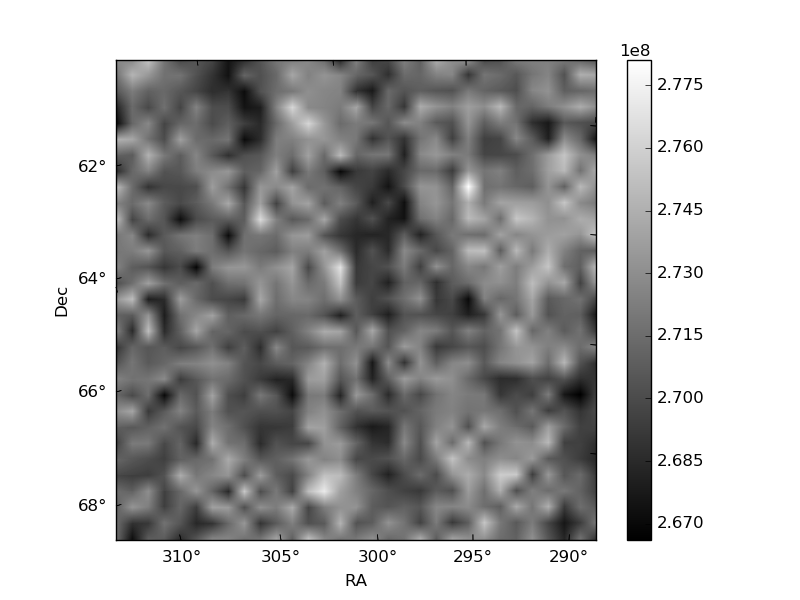
Histogram calculated using DETX and DETY for each event in the final _common_clean file
| Quadrant A | 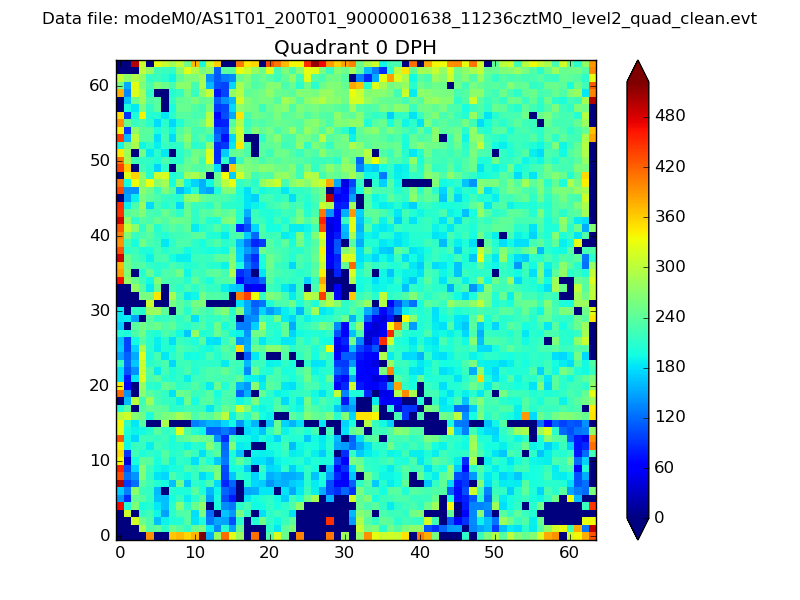 |
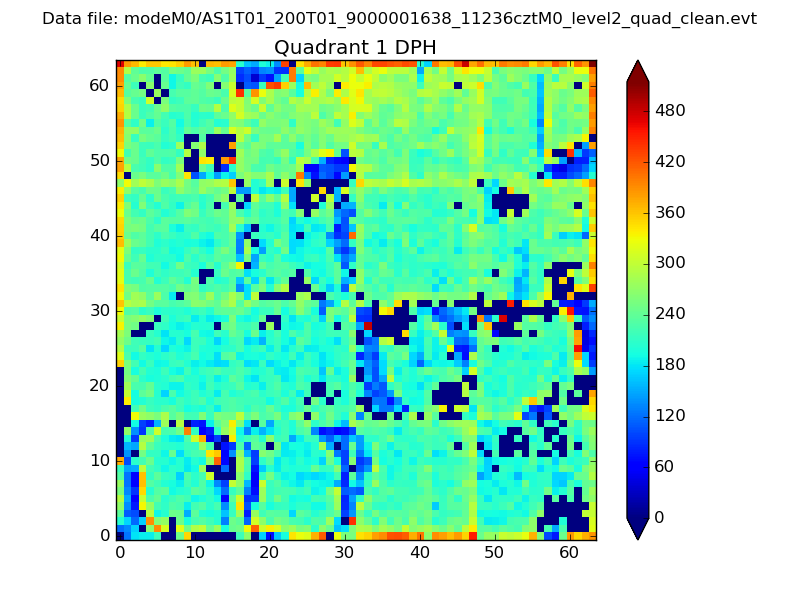 |
Quadrant B |
|---|---|---|---|
| Quadrant D |  |
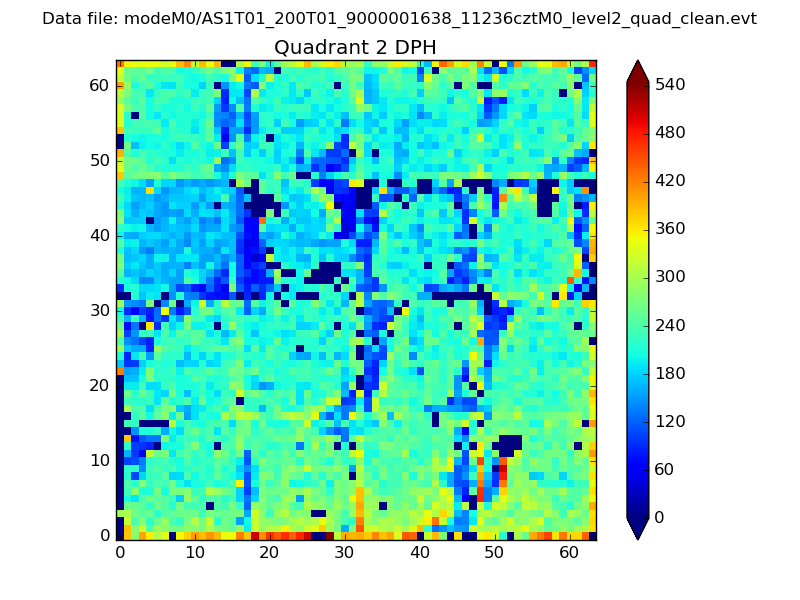 |
Quadrant C |
| Plot type | Count rate plots | Images |
|---|---|---|
| Comparison with Poisson distribution Blue bars denote a histogram of data divided into 1 sec bins. Red curve is a Poisson curve with rate = median count rate of data. |
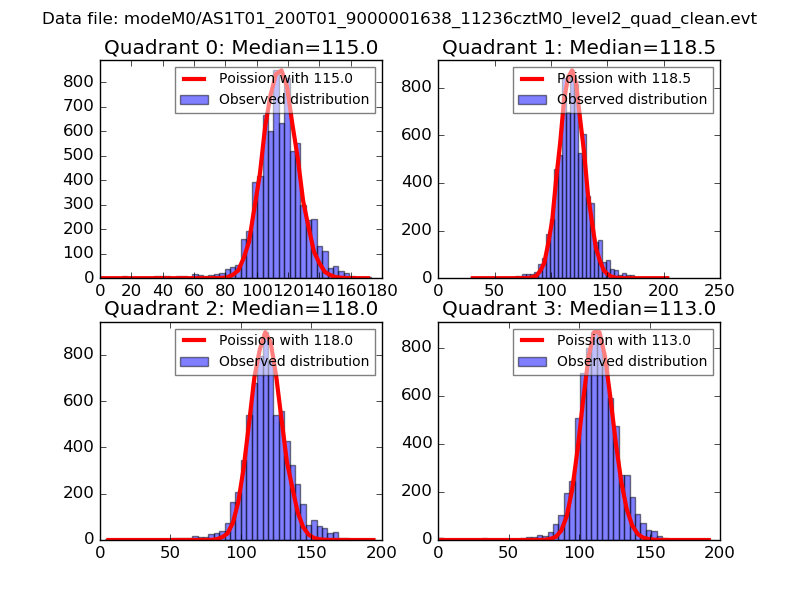 |
 |
| Quadrant-wise count rates Data is divided into 100 sec bins |
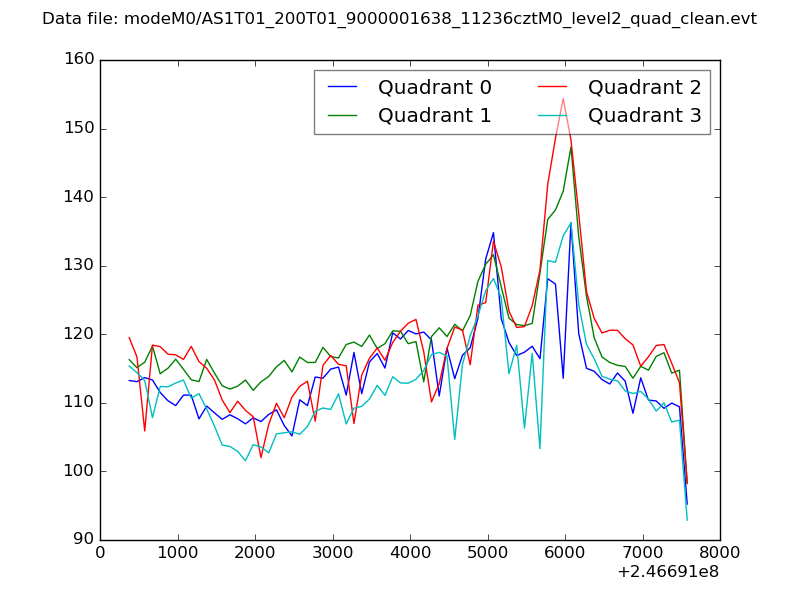 |
|
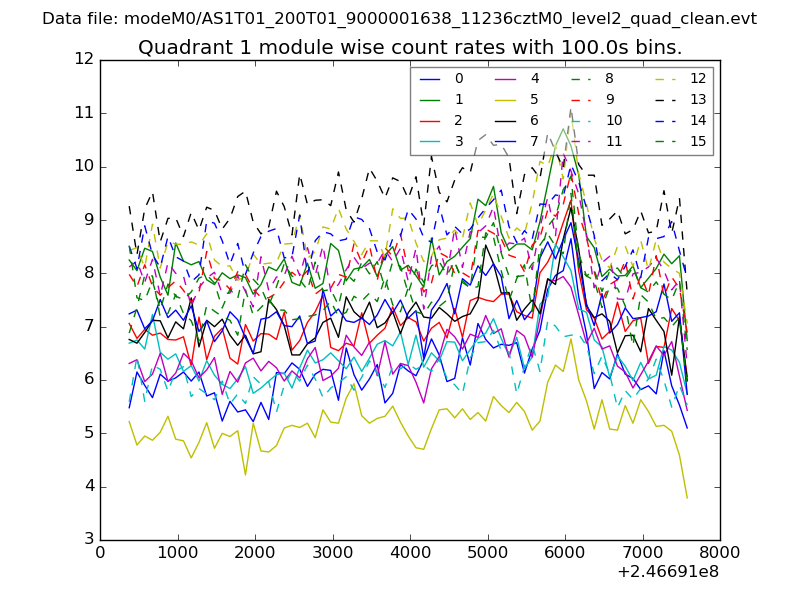
| Module-wise count rates for Quadrant A Data is divided into 100 sec bins |
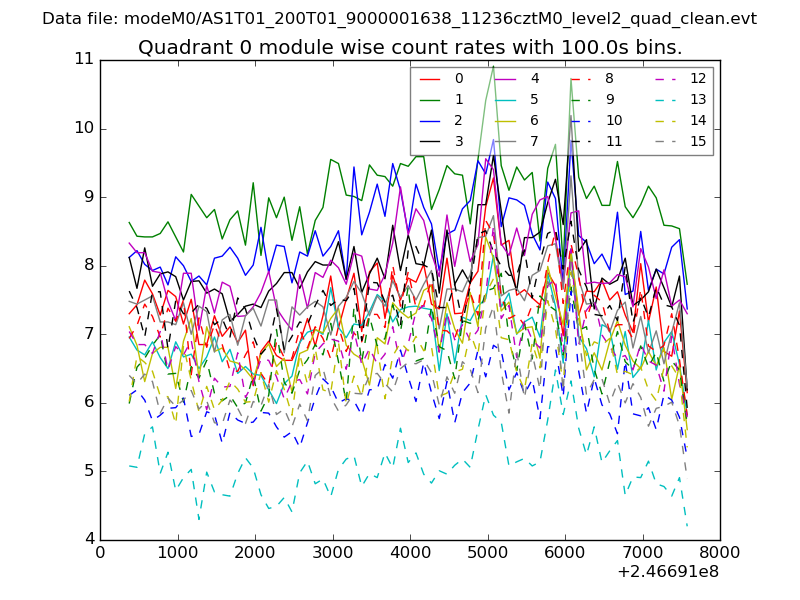 |
 |
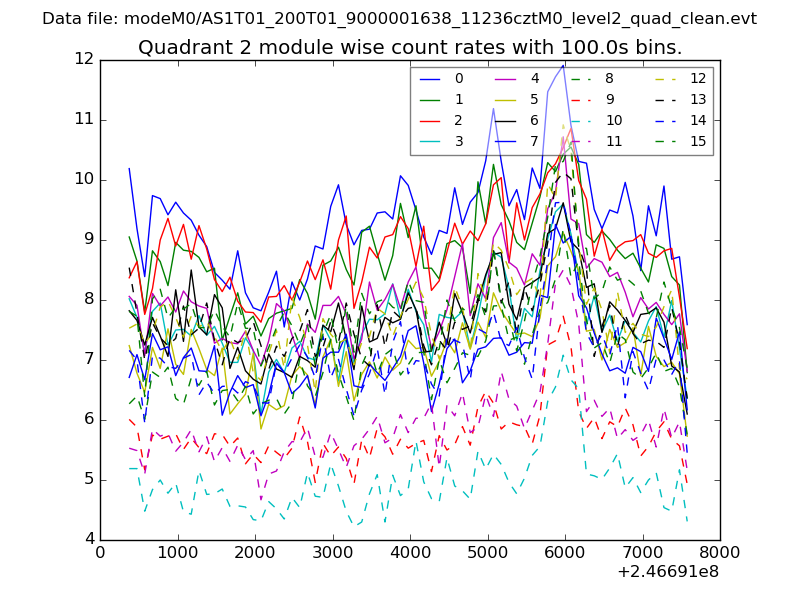
| Module-wise count rates for Quadrant B Data is divided into 100 sec bins |
 |
 |
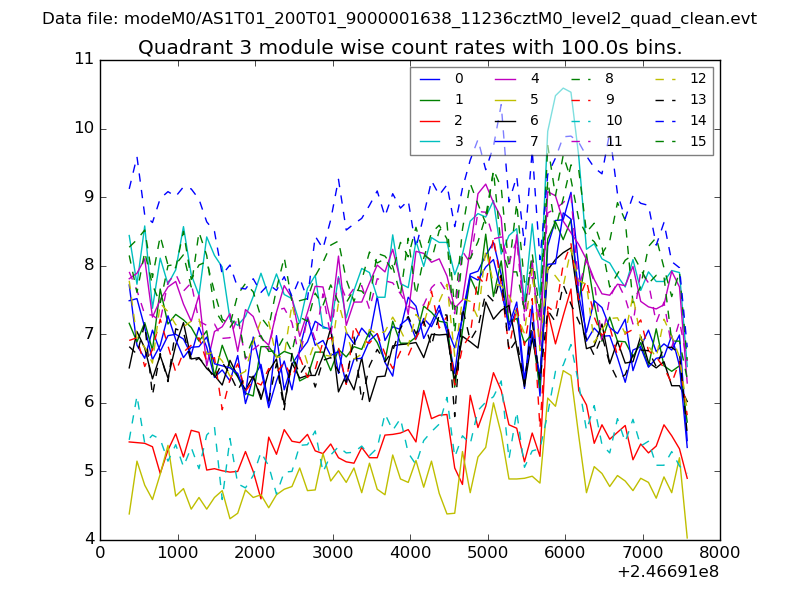
| Module-wise count rates for Quadrant C Data is divided into 100 sec bins |
 |
 |
| Module-wise count rates for Quadrant D Data is divided into 100 sec bins |
 |
 |
| Parameter | Plot |
|---|---|
| CZT HV Monitor | 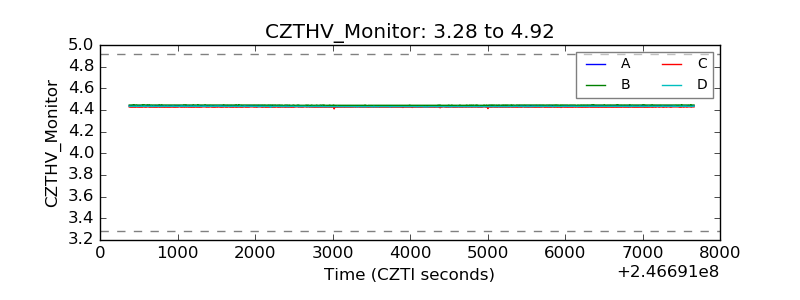 |
| D_VDD | 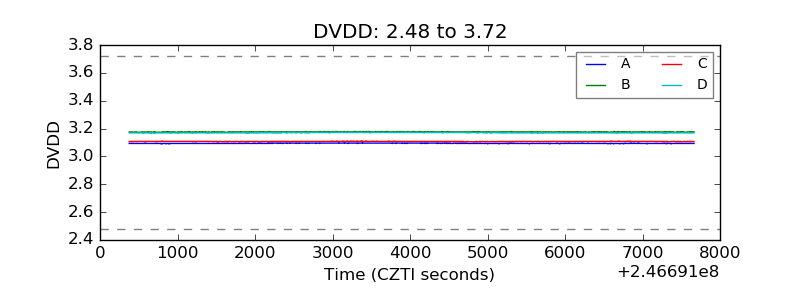 |
| Temperature 1 | 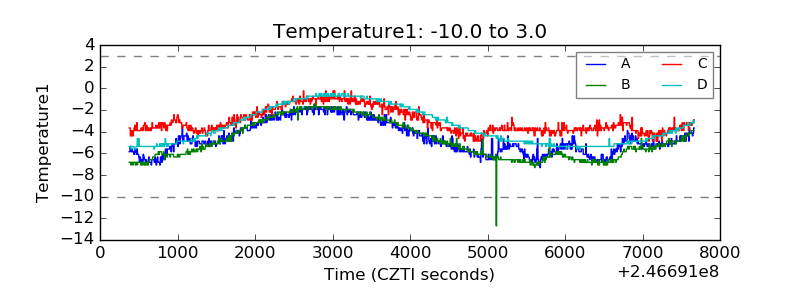 |
| Veto HV Monitor | 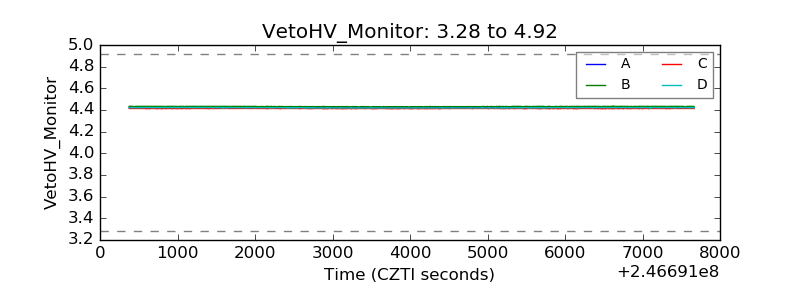 |
| Veto LLD | 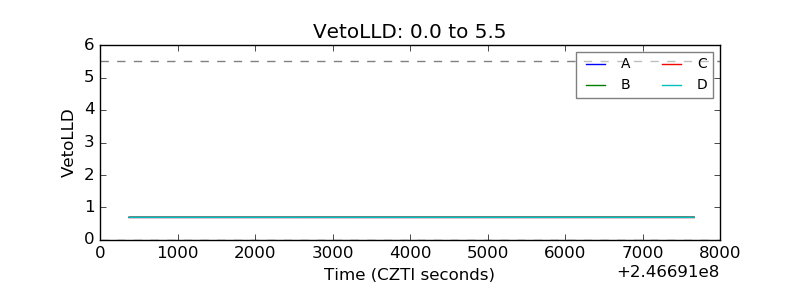 |
| Alpha Counter | 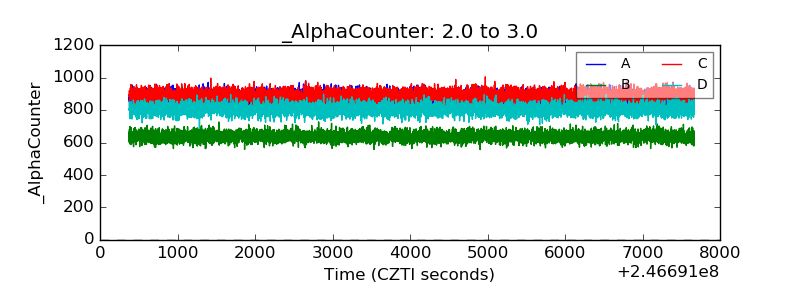 |
| _CPM_Rate | 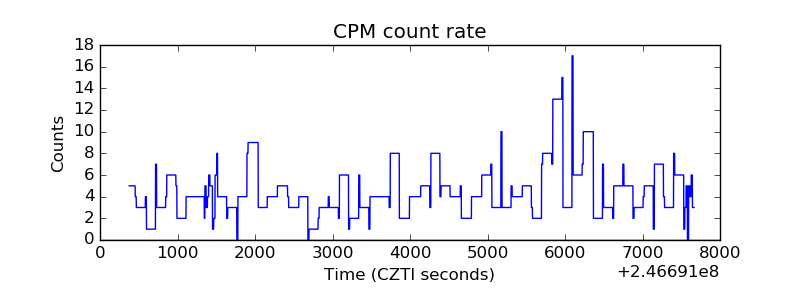 |
| CZT Counter | 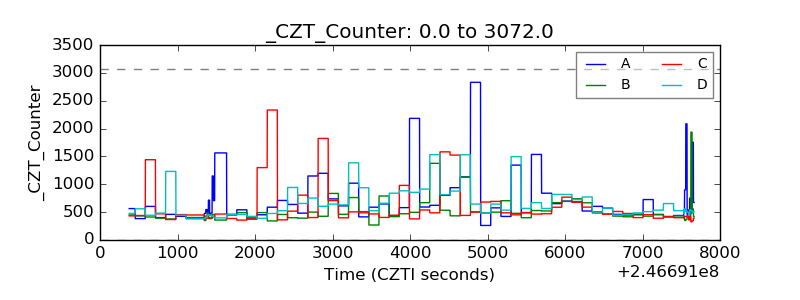 |
| +2.5 Volts monitor |  |
| +5 Volts monitor |  |
| _ROLL_ROT | 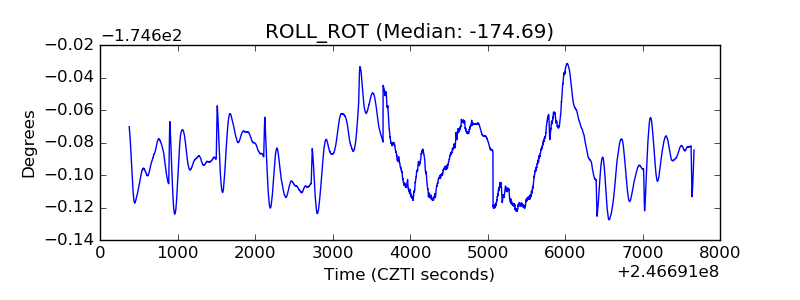 |
| _Roll_DEC | 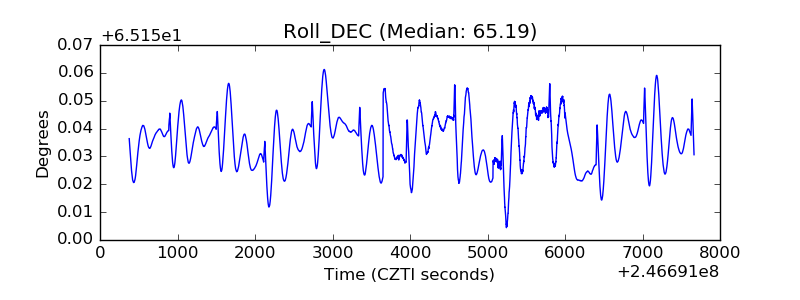 |
| _Roll_RA | 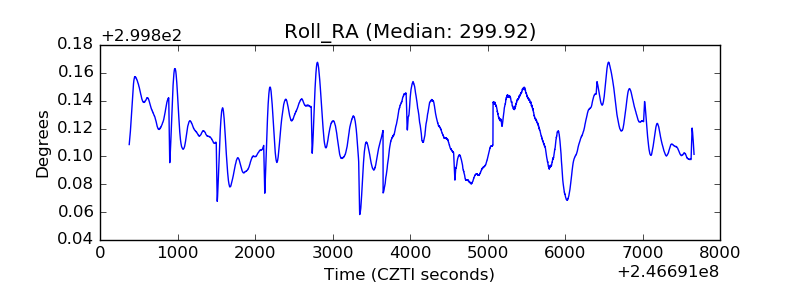 |
| Veto Counter | 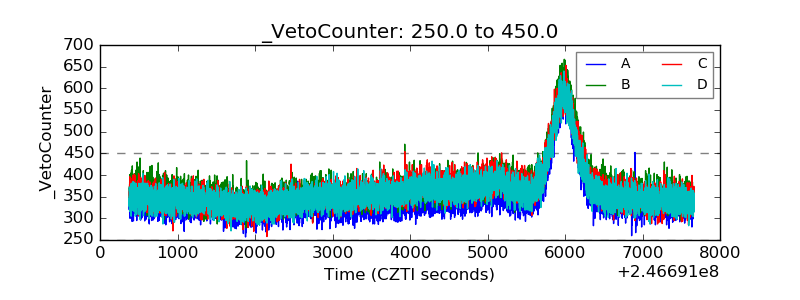 |