| Param | Original file | Final file |
|---|---|---|
| Filename | modeM0/AS1T01_200T01_9000001638_11237cztM0_level2.evt | modeM0/AS1T01_200T01_9000001638_11237cztM0_level2_quad_clean.evt |
| Size (bytes) | 551,422,080 | 120,496,320 |
| Size | 525.9 MB | 114.9 MB |
| Events in quadrant A | 4,315,715 | 787,749 |
| Events in quadrant B | 3,872,020 | 809,616 |
| Events in quadrant C | 2,992,468 | 815,132 |
| Events in quadrant D | 5,053,568 | 757,779 |
| Mode M9 | |||
|---|---|---|---|
| Quadrant | BADHDUFLAG | Total packets | Discarded packets |
| A | 0 | 3 | 0 |
| B | 0 | 3 | 0 |
| C | 0 | 3 | 0 |
| D | 0 | 3 | 0 |
| Mode SS | |||
|---|---|---|---|
| Quadrant | BADHDUFLAG | Total packets | Discarded packets |
| A | 0 | 138 | 0 |
| B | 0 | 138 | 0 |
| C | 0 | 138 | 0 |
| D | 0 | 138 | 0 |
| Mode M0 | |||
|---|---|---|---|
| Quadrant | BADHDUFLAG | Total packets | Discarded packets |
| A | 0 | 17424 | 2 |
| B | 0 | 16112 | 1 |
| C | 0 | 14053 | 1 |
| D | 0 | 19741 | 1 |
| Quadrant | Total seconds | Saturated seconds | Saturation percentage |
|---|---|---|---|
| A | 6885 | 334 | 4.851126% |
| B | 6885 | 261 | 3.790850% |
| C | 6885 | 54 | 0.784314% |
| D | 6885 | 315 | 4.575163% |
Noise dominated data is calculated using 1-second bins in cleaned event files. If a bin has >2000 counts, and if more than 50% of those come from <1% of pixels, then it is considered to be noise-dominated and hence unusable.
| Quadrant | # 1 sec bins | Bins with >0 counts | Bins with >2000 counts | High rate bins dominated by noise | Noise dominated (total time) | Noise dominated (detector-on time) | Marked lightcurve |
|---|---|---|---|---|---|---|---|
| A | 7090 | 6888 | 125 | 125 | 1.76% | 1.81% | 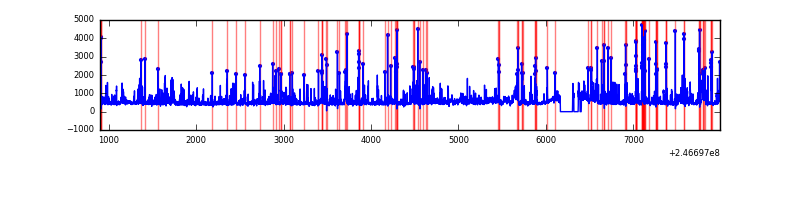 |
| B | 7090 | 6888 | 63 | 63 | 0.89% | 0.91% | 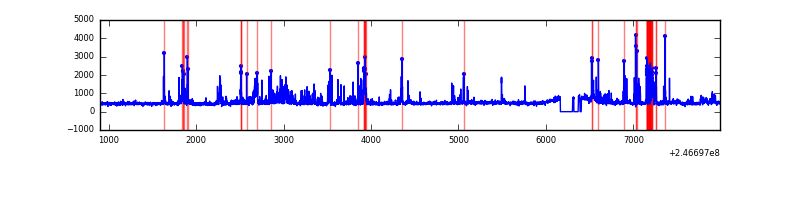 |
| C | 7090 | 6888 | 0 | 0 | 0.00% | 0.00% | 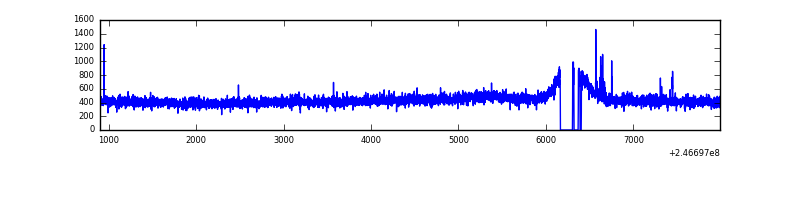 |
| D | 7090 | 6888 | 186 | 186 | 2.62% | 2.70% | 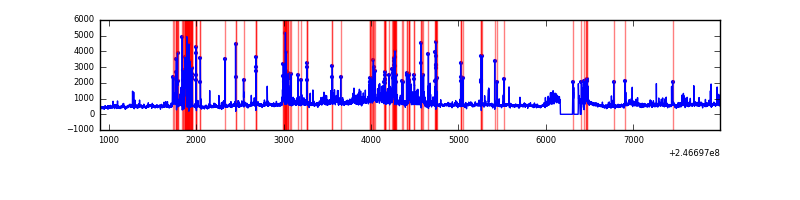 |
Top three noisy pixels from each quadrant. If the there are fewer than three noisy pixels in the level2.evt file, extra rows are filled as -1
| Pixel properties | Quadrant properties | ||||||
|---|---|---|---|---|---|---|---|
| Quadrant | DetID | PixID | Counts | Sigma | Mean | Median | Sigma |
| A | 8 | 5 | 1046342 | 6582.16 | 772 | 754 | 158.9 |
| A | 15 | 174 | 149165 | 934.27 | 772 | 754 | 158.9 |
| A | 14 | 238 | 102241 | 638.88 | 772 | 754 | 158.9 |
| B | 4 | 239 | 383192 | 2566.56 | 779 | 759 | 149.0 |
| B | 4 | 81 | 252144 | 1687.08 | 779 | 759 | 149.0 |
| B | 11 | 51 | 64836 | 430.03 | 779 | 759 | 149.0 |
| C | 5 | 239 | 16046 | 86.3 | 762 | 764 | 177.1 |
| C | 13 | 61 | 5636 | 27.51 | 762 | 764 | 177.1 |
| C | 12 | 4 | 3654 | 16.32 | 762 | 764 | 177.1 |
| D | 8 | 195 | 967929 | 5330.31 | 746 | 723 | 181.5 |
| D | 14 | 34 | 459821 | 2530.1 | 746 | 723 | 181.5 |
| D | 1 | 52 | 289357 | 1590.67 | 746 | 723 | 181.5 |
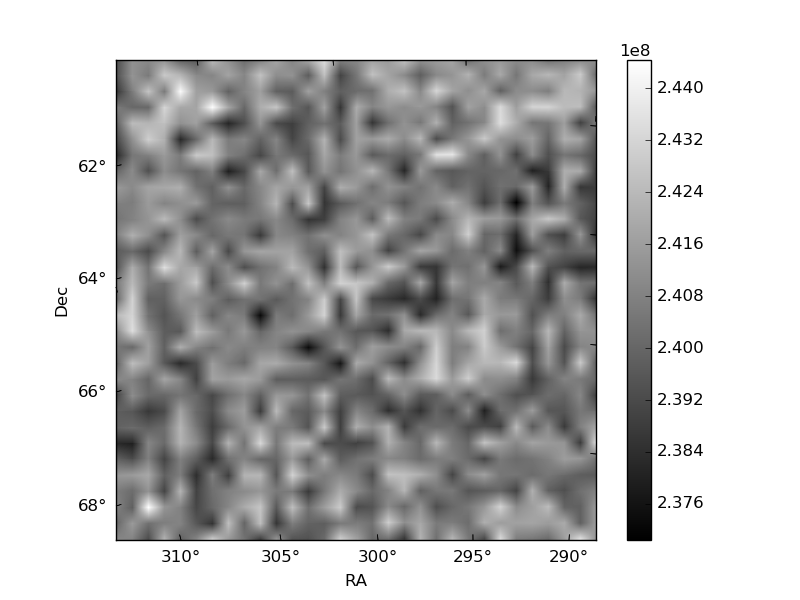
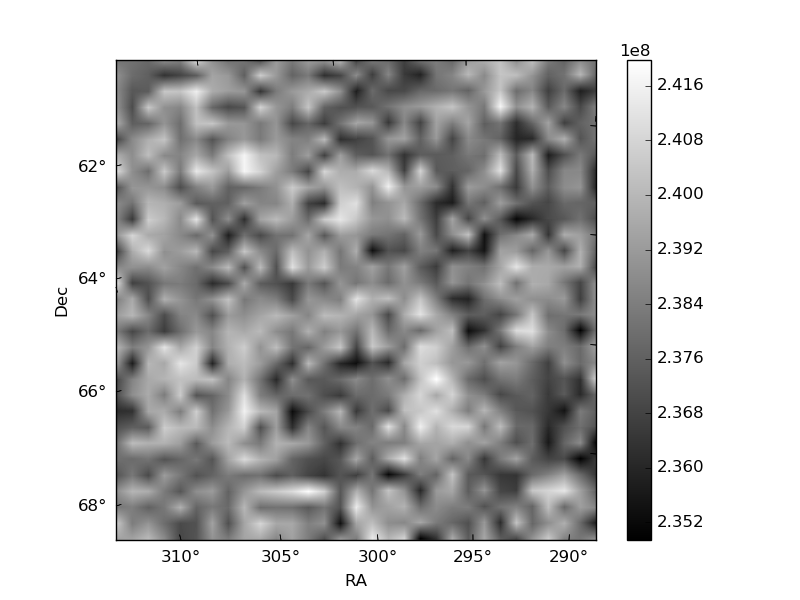
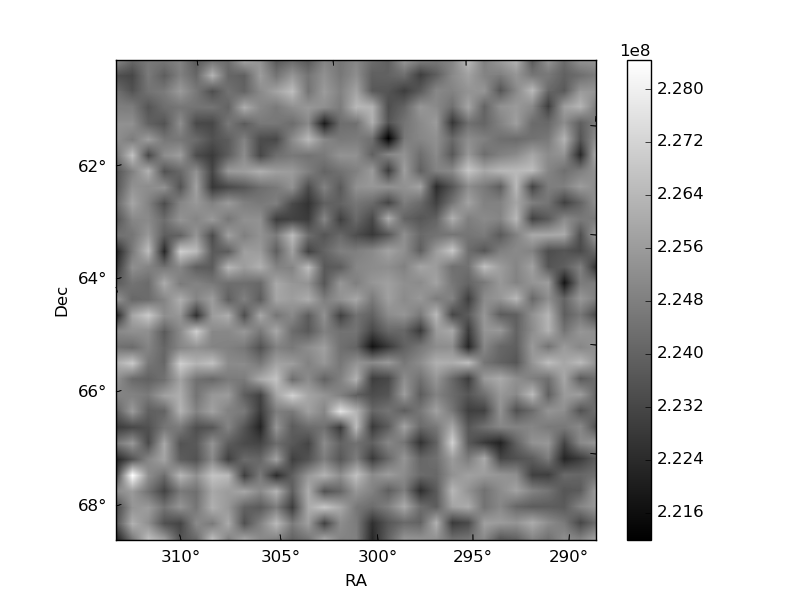
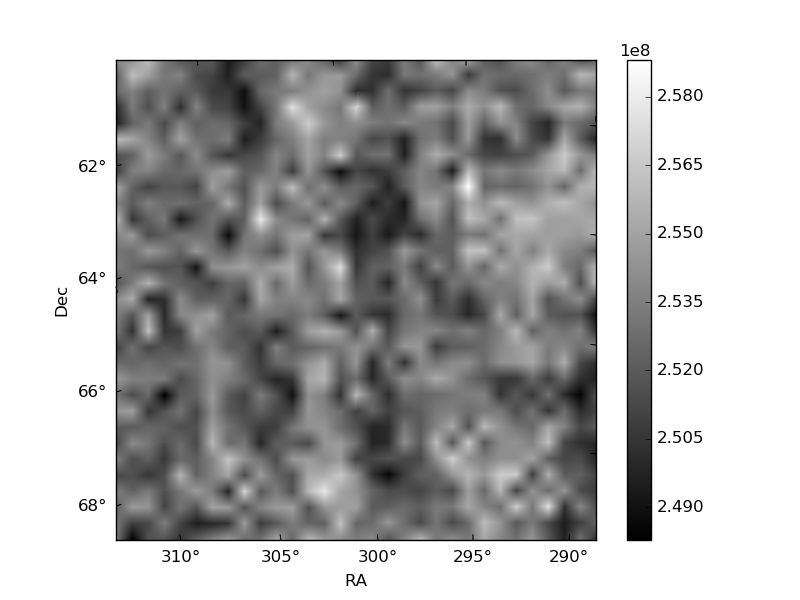
Histogram calculated using DETX and DETY for each event in the final _common_clean file
| Quadrant A | 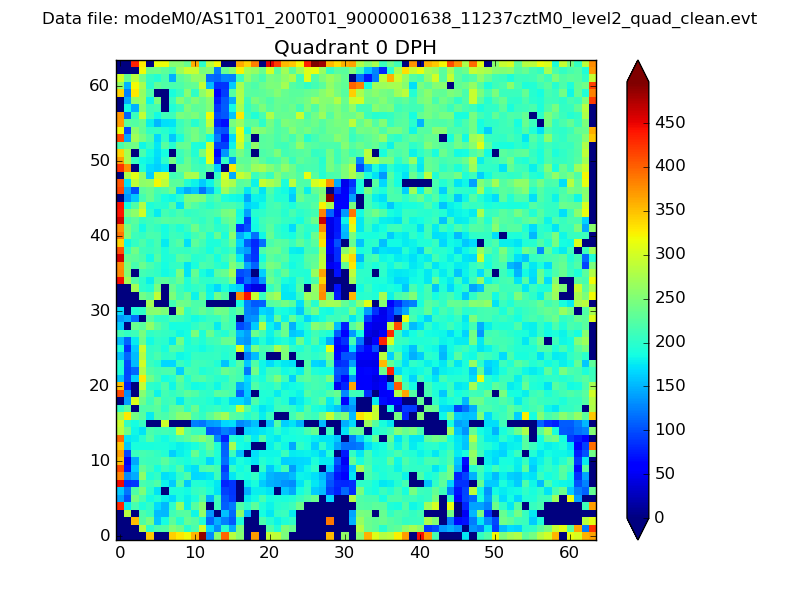 |
 |
Quadrant B |
|---|---|---|---|
| Quadrant D |  |
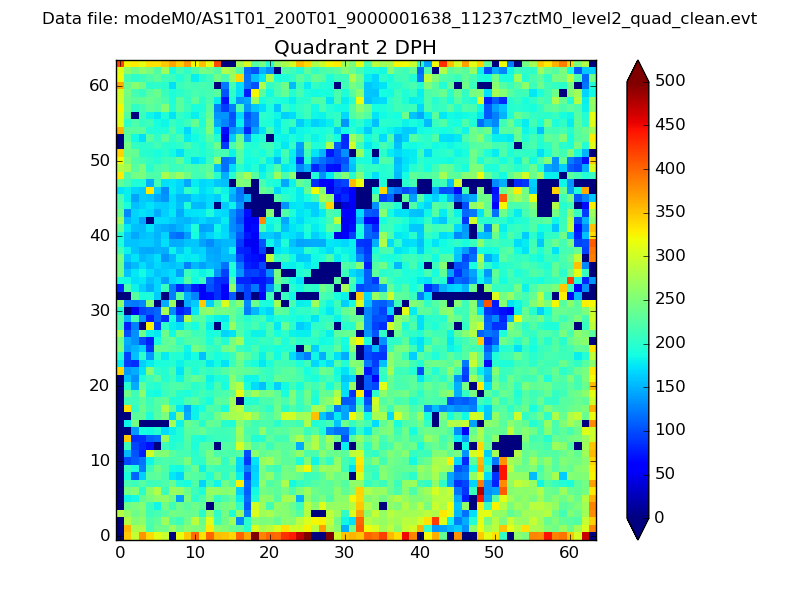 |
Quadrant C |
| Plot type | Count rate plots | Images |
|---|---|---|
| Comparison with Poisson distribution Blue bars denote a histogram of data divided into 1 sec bins. Red curve is a Poisson curve with rate = median count rate of data. |
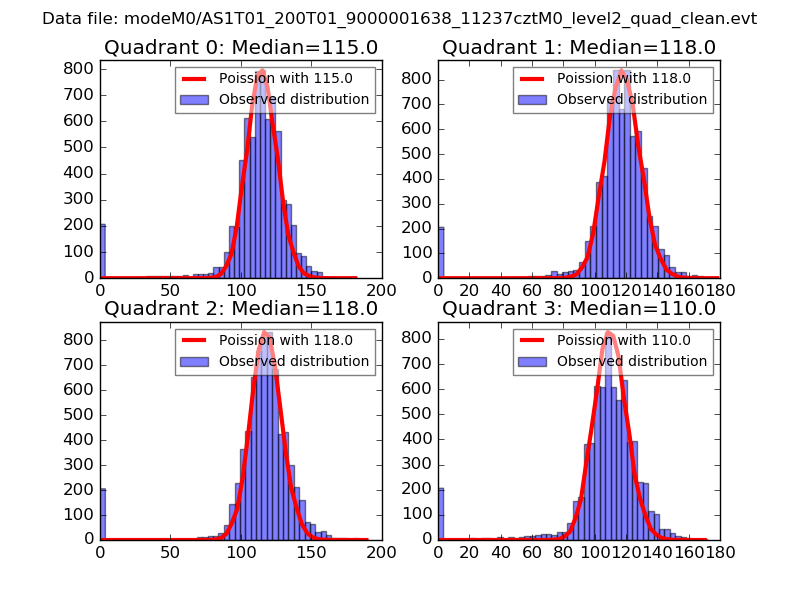 |
 |
| Quadrant-wise count rates Data is divided into 100 sec bins |
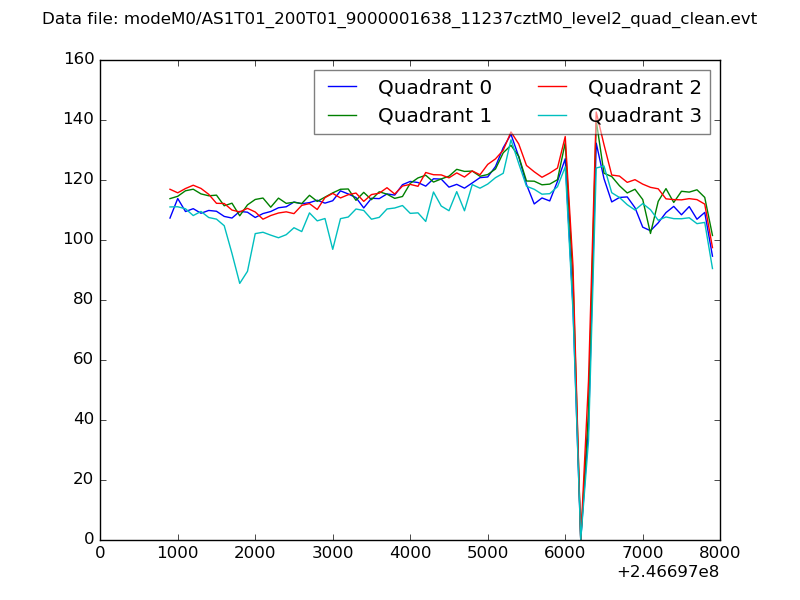 |
|
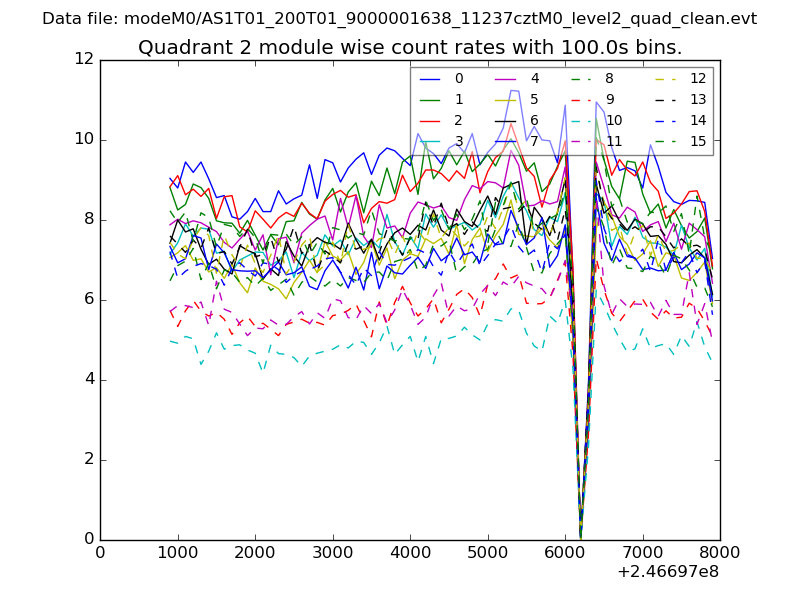
| Module-wise count rates for Quadrant A Data is divided into 100 sec bins |
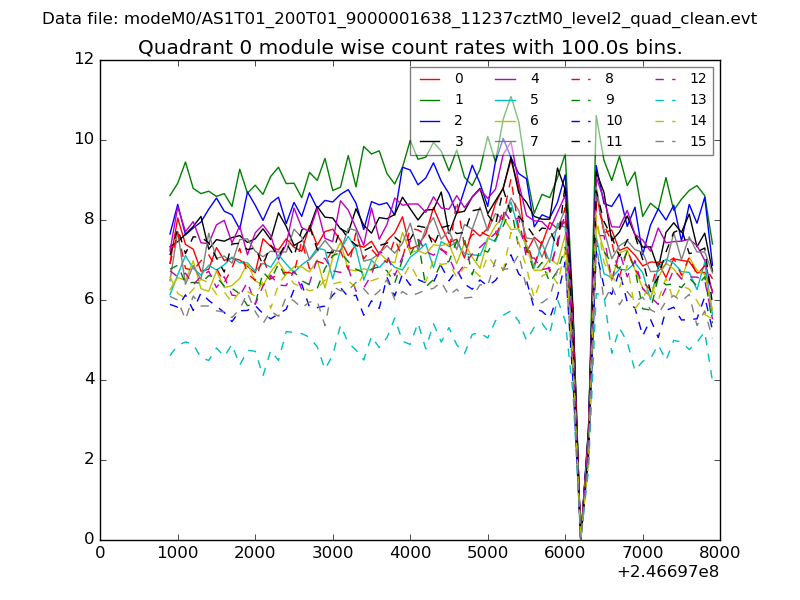 |
 |
| Module-wise count rates for Quadrant B Data is divided into 100 sec bins |
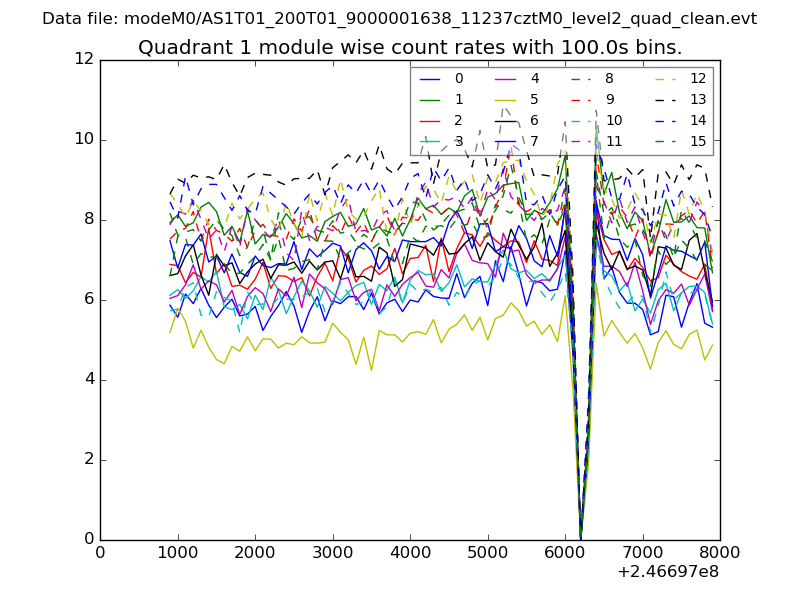 |
 |
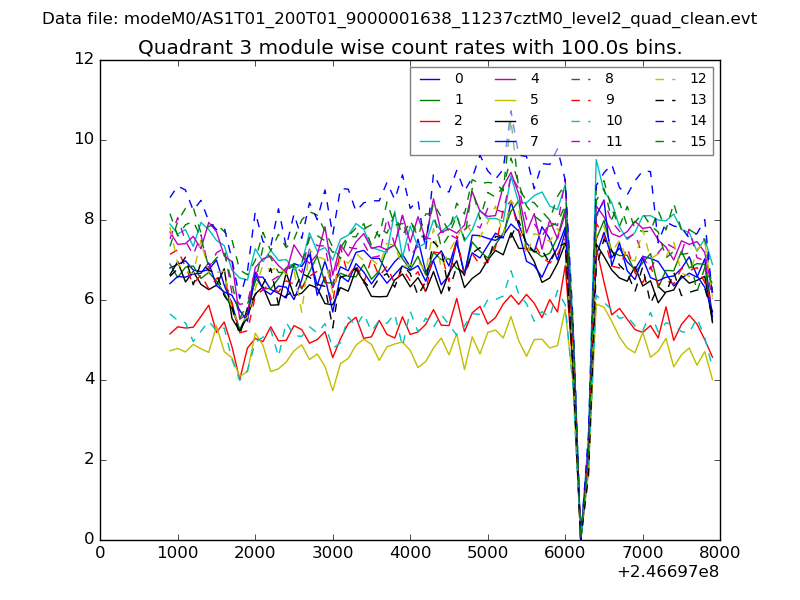
| Module-wise count rates for Quadrant C Data is divided into 100 sec bins |
 |
 |
| Module-wise count rates for Quadrant D Data is divided into 100 sec bins |
 |
 |
| Parameter | Plot |
|---|---|
| CZT HV Monitor |  |
| D_VDD | 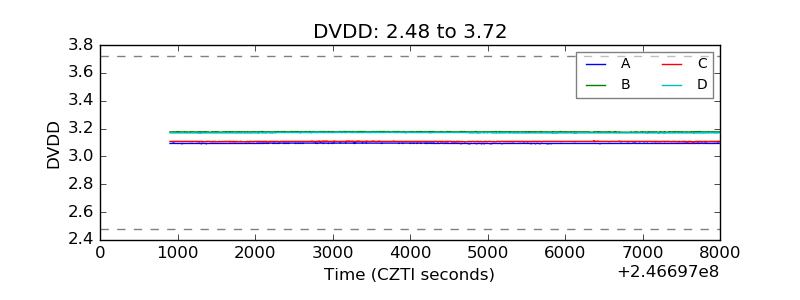 |
| Temperature 1 | 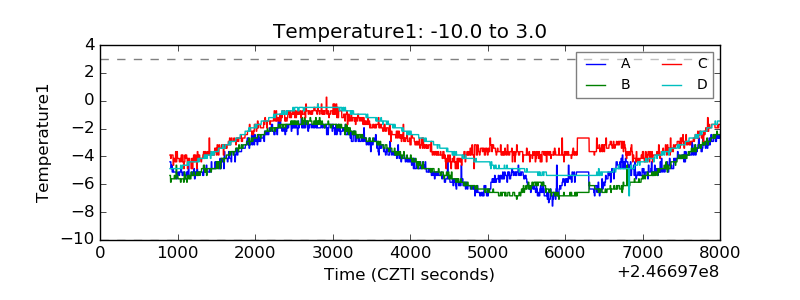 |
| Veto HV Monitor | 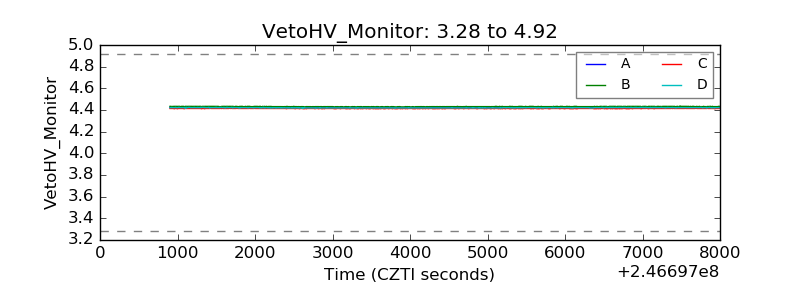 |
| Veto LLD | 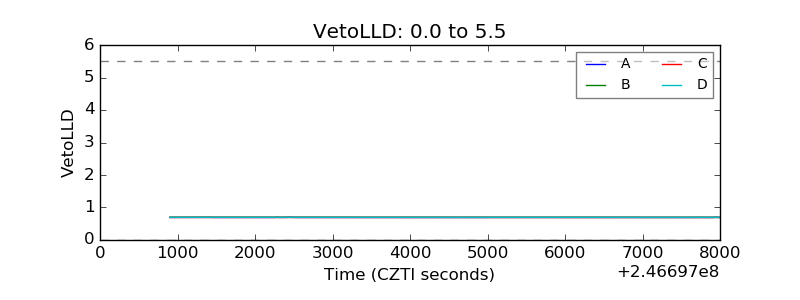 |
| Alpha Counter | 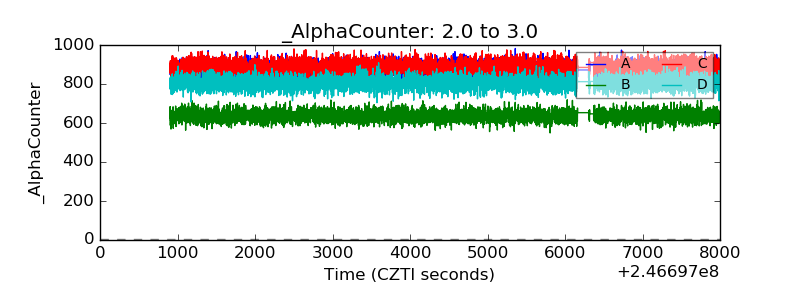 |
| _CPM_Rate | 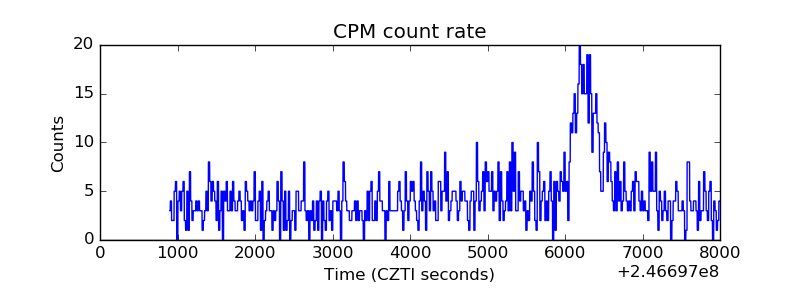 |
| CZT Counter | 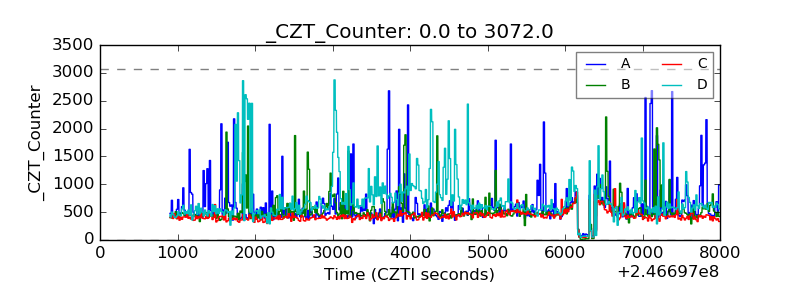 |
| +2.5 Volts monitor |  |
| +5 Volts monitor |  |
| _ROLL_ROT | 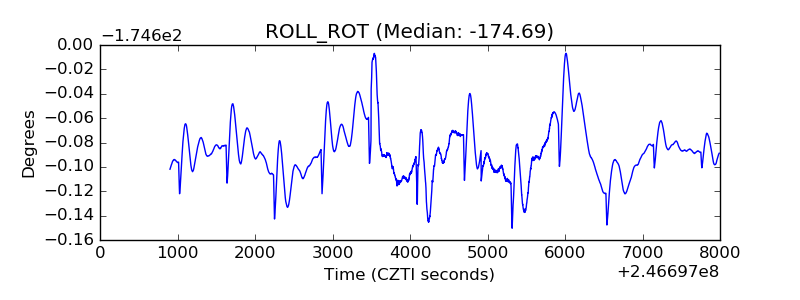 |
| _Roll_DEC | 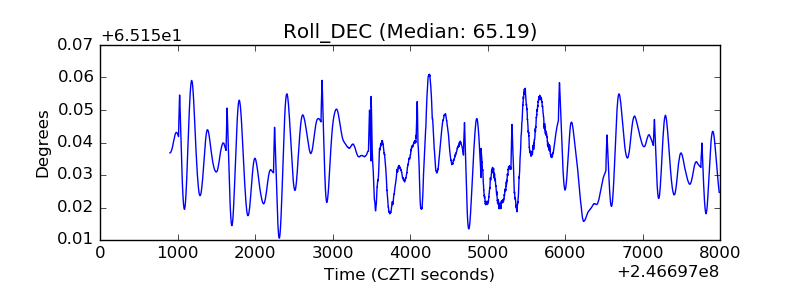 |
| _Roll_RA | 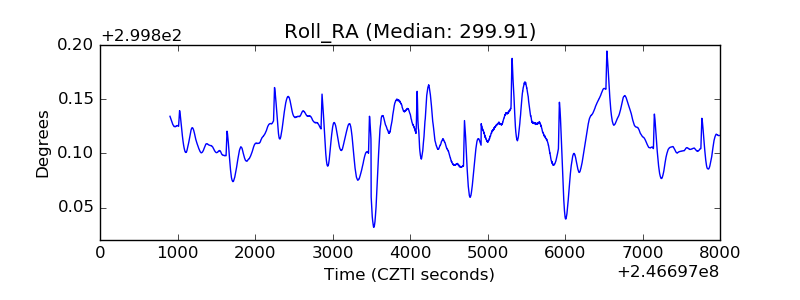 |
| Veto Counter | 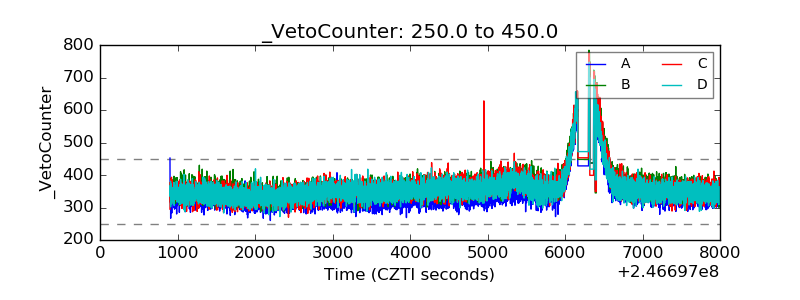 |