| Param | Original file | Final file |
|---|---|---|
| Filename | modeM0/AS1T01_200T01_9000001638_11240cztM0_level2.evt | modeM0/AS1T01_200T01_9000001638_11240cztM0_level2_quad_clean.evt |
| Size (bytes) | 1,526,705,280 | 317,903,040 |
| Size | 1.4 GB | 303.2 MB |
| Events in quadrant A | 13,971,482 | 2,059,101 |
| Events in quadrant B | 10,344,743 | 2,132,890 |
| Events in quadrant C | 7,976,876 | 2,156,478 |
| Events in quadrant D | 12,716,990 | 2,026,845 |
| Mode M9 | |||
|---|---|---|---|
| Quadrant | BADHDUFLAG | Total packets | Discarded packets |
| A | 0 | 18 | 0 |
| B | 0 | 18 | 0 |
| C | 0 | 18 | 0 |
| D | 0 | 18 | 0 |
| Mode SS | |||
|---|---|---|---|
| Quadrant | BADHDUFLAG | Total packets | Discarded packets |
| A | 0 | 370 | 0 |
| B | 0 | 370 | 0 |
| C | 0 | 370 | 0 |
| D | 0 | 370 | 0 |
| Mode M0 | |||
|---|---|---|---|
| Quadrant | BADHDUFLAG | Total packets | Discarded packets |
| A | 0 | 53893 | 4 |
| B | 0 | 42798 | 3 |
| C | 0 | 36959 | 3 |
| D | 0 | 49835 | 3 |
| Quadrant | Total seconds | Saturated seconds | Saturation percentage |
|---|---|---|---|
| A | 18186 | 1332 | 7.324315% |
| B | 18186 | 596 | 3.277246% |
| C | 18186 | 109 | 0.599362% |
| D | 18186 | 623 | 3.425712% |
Noise dominated data is calculated using 1-second bins in cleaned event files. If a bin has >2000 counts, and if more than 50% of those come from <1% of pixels, then it is considered to be noise-dominated and hence unusable.
| Quadrant | # 1 sec bins | Bins with >0 counts | Bins with >2000 counts | High rate bins dominated by noise | Noise dominated (total time) | Noise dominated (detector-on time) | Marked lightcurve |
|---|---|---|---|---|---|---|---|
| A | 19985 | 18189 | 694 | 694 | 3.47% | 3.82% | 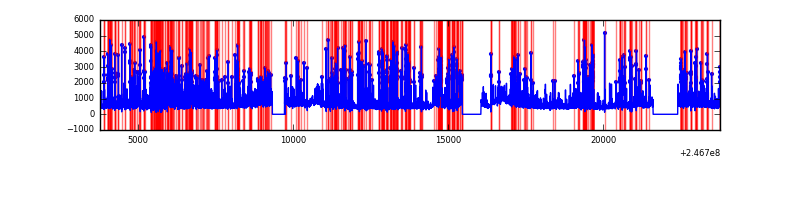 |
| B | 19986 | 18190 | 241 | 241 | 1.21% | 1.32% | 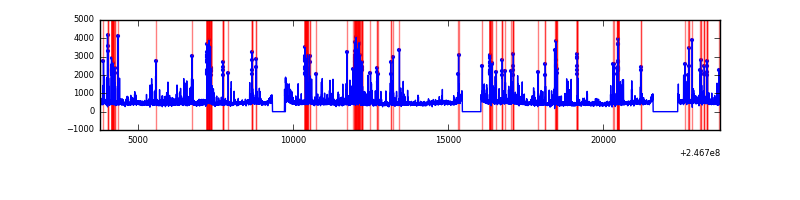 |
| C | 19986 | 18190 | 1 | 1 | 0.01% | 0.01% | 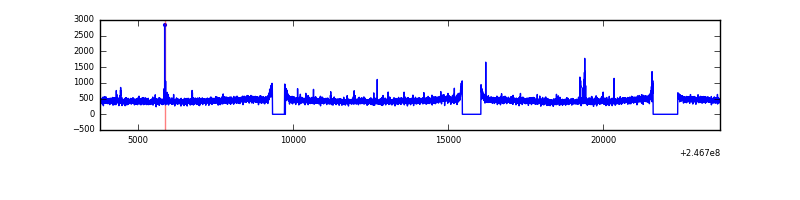 |
| D | 19986 | 18190 | 359 | 359 | 1.80% | 1.97% | 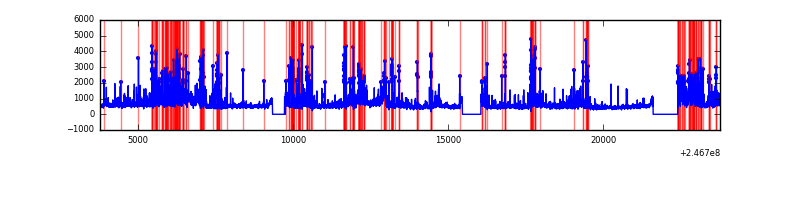 |
Top three noisy pixels from each quadrant. If the there are fewer than three noisy pixels in the level2.evt file, extra rows are filled as -1
| Pixel properties | Quadrant properties | ||||||
|---|---|---|---|---|---|---|---|
| Quadrant | DetID | PixID | Counts | Sigma | Mean | Median | Sigma |
| A | 8 | 5 | 4068970 | 9908.76 | 2021 | 1975 | 410.4 |
| A | 15 | 174 | 972642 | 2364.92 | 2021 | 1975 | 410.4 |
| A | 14 | 238 | 936452 | 2276.75 | 2021 | 1975 | 410.4 |
| B | 4 | 239 | 1560663 | 3973.15 | 2059 | 2001 | 392.3 |
| B | 4 | 81 | 220167 | 556.12 | 2059 | 2001 | 392.3 |
| B | 11 | 51 | 130762 | 328.22 | 2059 | 2001 | 392.3 |
| C | 12 | 4 | 38070 | 76.84 | 2026 | 2031 | 469.0 |
| C | 14 | 234 | 15084 | 27.83 | 2026 | 2031 | 469.0 |
| C | 13 | 61 | 15067 | 27.8 | 2026 | 2031 | 469.0 |
| D | 8 | 195 | 1305901 | 2677.89 | 2002 | 1940 | 486.9 |
| D | 12 | 157 | 967047 | 1982.0 | 2002 | 1940 | 486.9 |
| D | 1 | 52 | 783501 | 1605.06 | 2002 | 1940 | 486.9 |
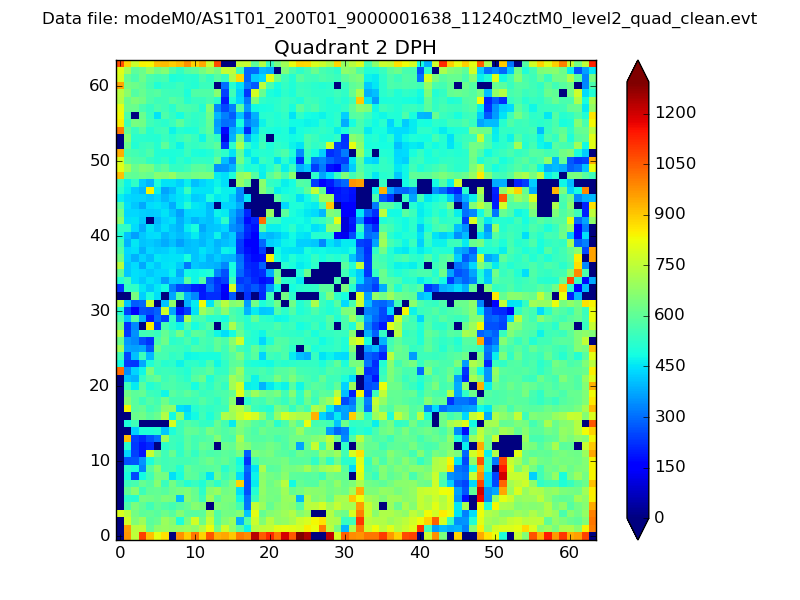
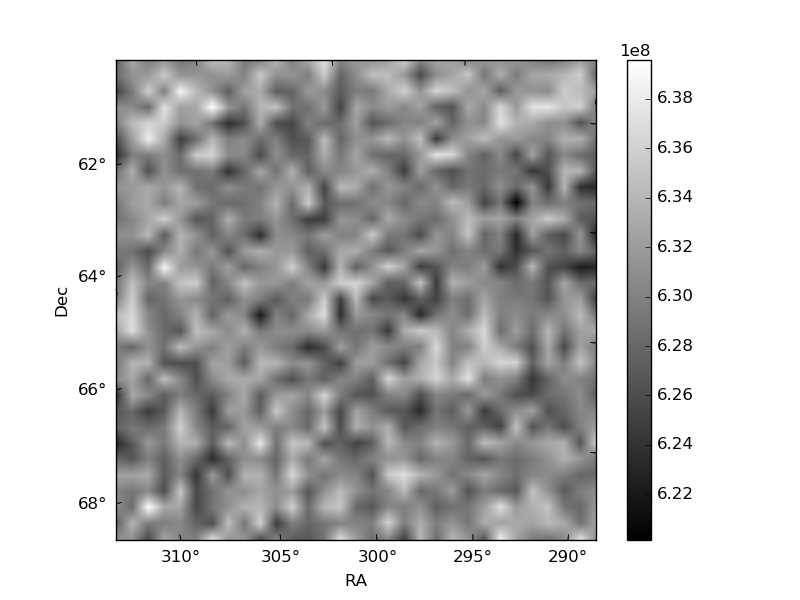
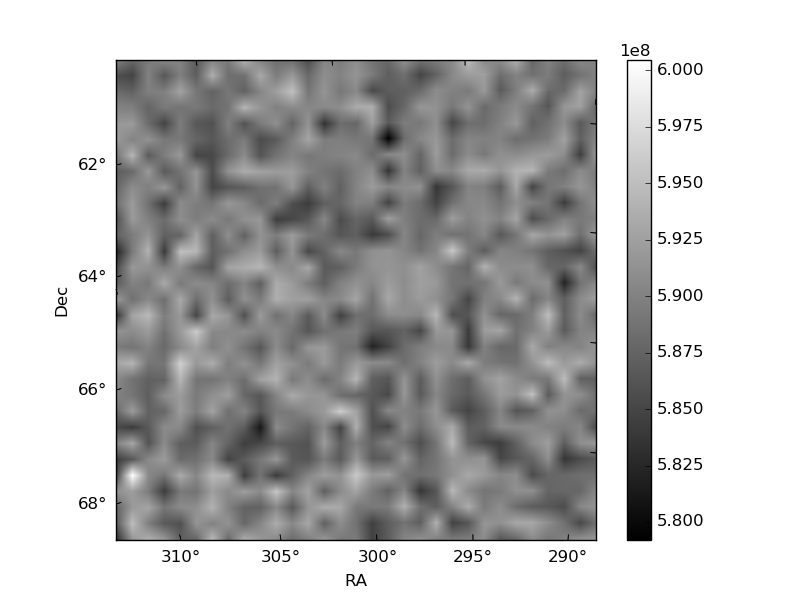
Histogram calculated using DETX and DETY for each event in the final _common_clean file
| Quadrant A | 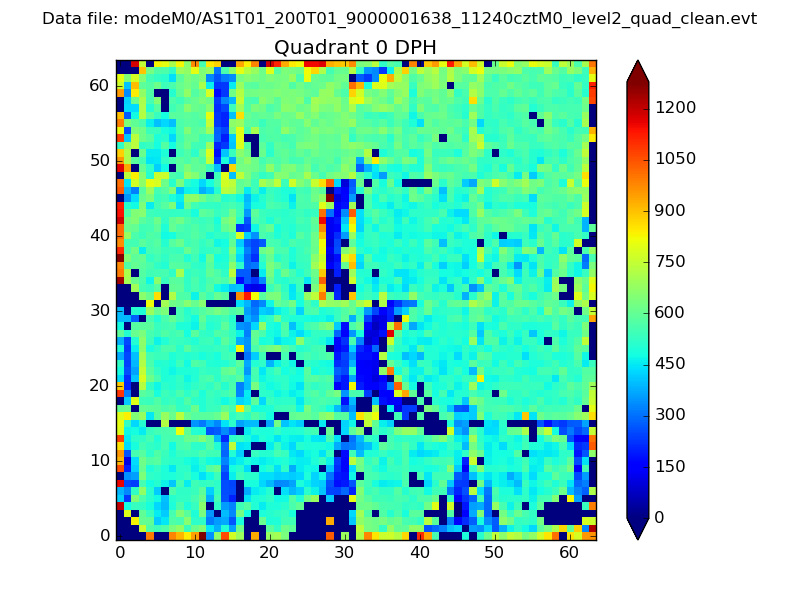 |
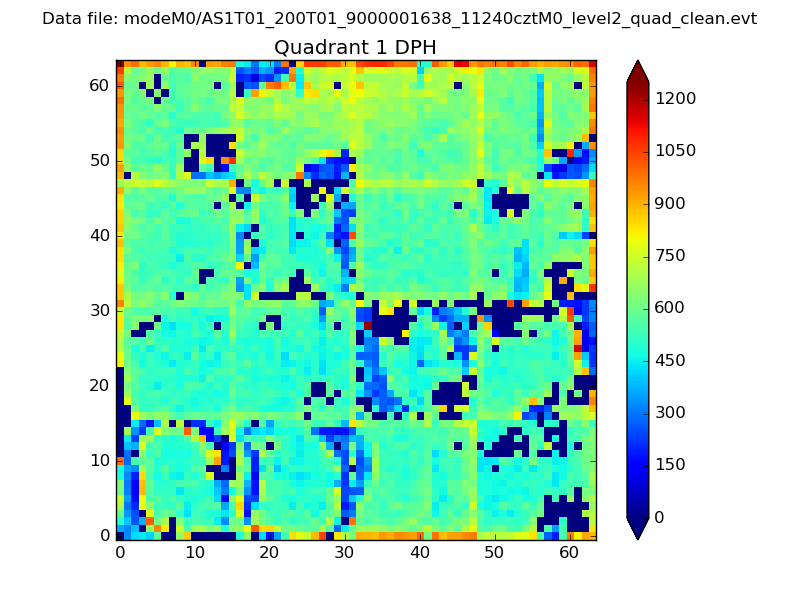 |
Quadrant B |
|---|---|---|---|
| Quadrant D | 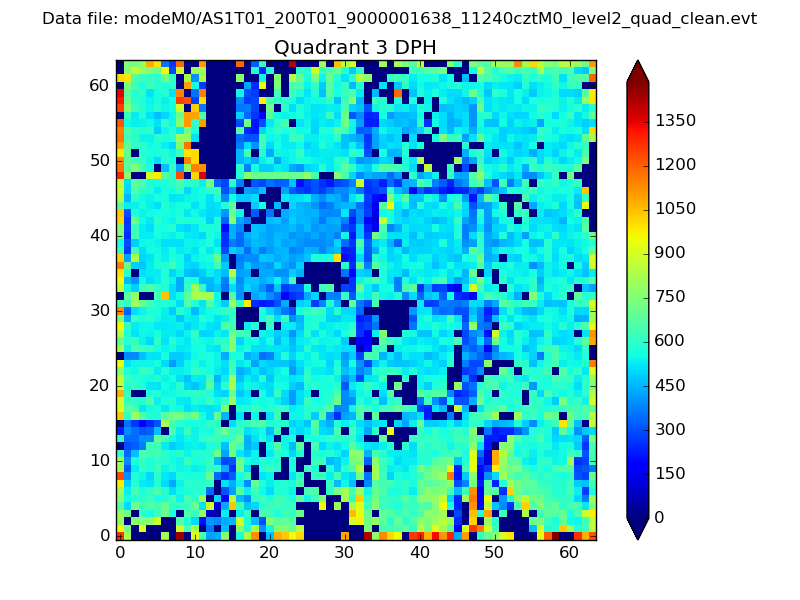 |
 |
Quadrant C |
| Plot type | Count rate plots | Images |
|---|---|---|
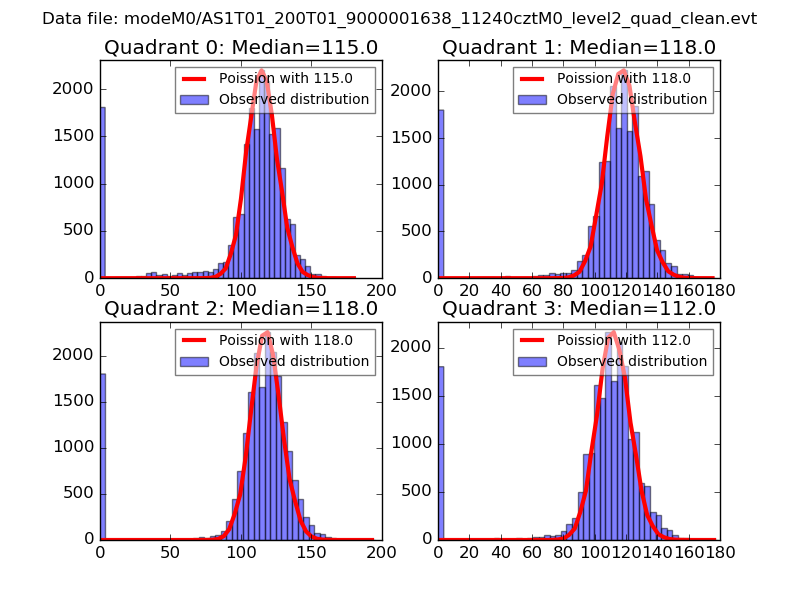
| Comparison with Poisson distribution Blue bars denote a histogram of data divided into 1 sec bins. Red curve is a Poisson curve with rate = median count rate of data. |
 |
 |
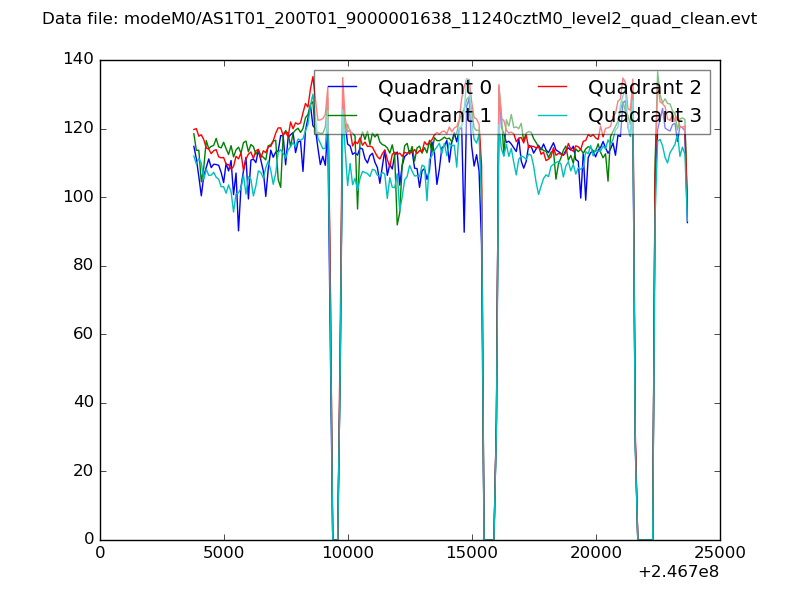
| Quadrant-wise count rates Data is divided into 100 sec bins |
 |
|
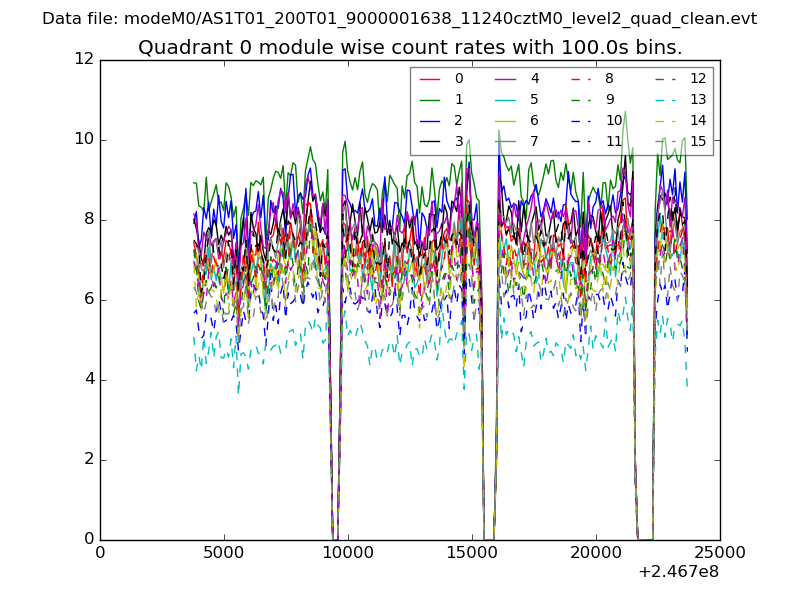
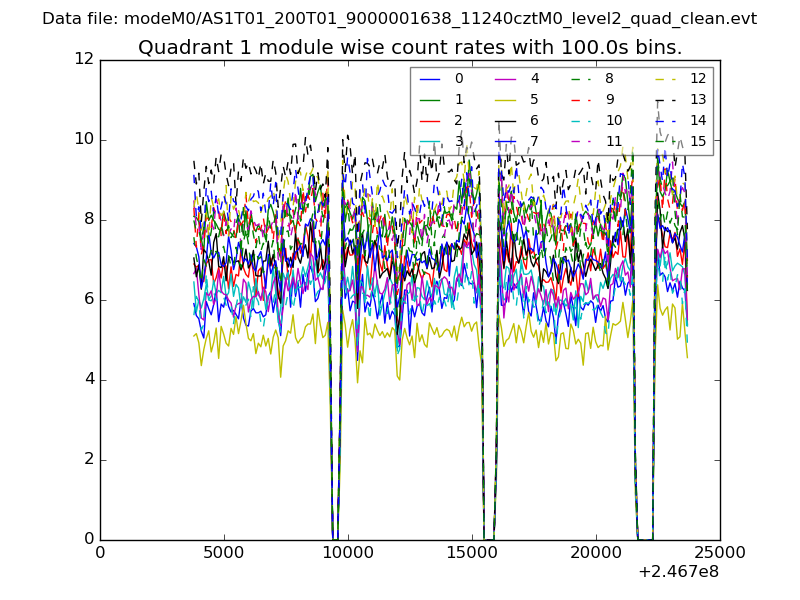
| Module-wise count rates for Quadrant A Data is divided into 100 sec bins |
 |
 |
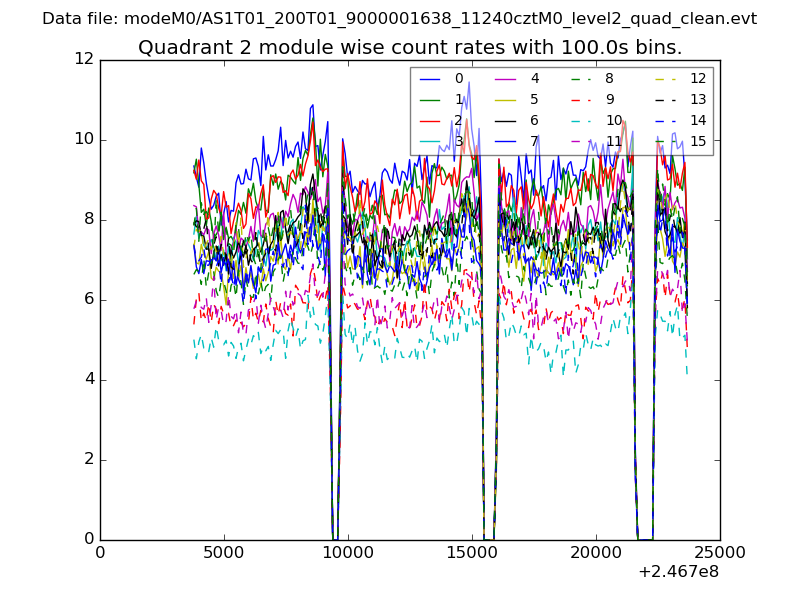
| Module-wise count rates for Quadrant B Data is divided into 100 sec bins |
 |
 |
| Module-wise count rates for Quadrant C Data is divided into 100 sec bins |
 |
 |
| Module-wise count rates for Quadrant D Data is divided into 100 sec bins |
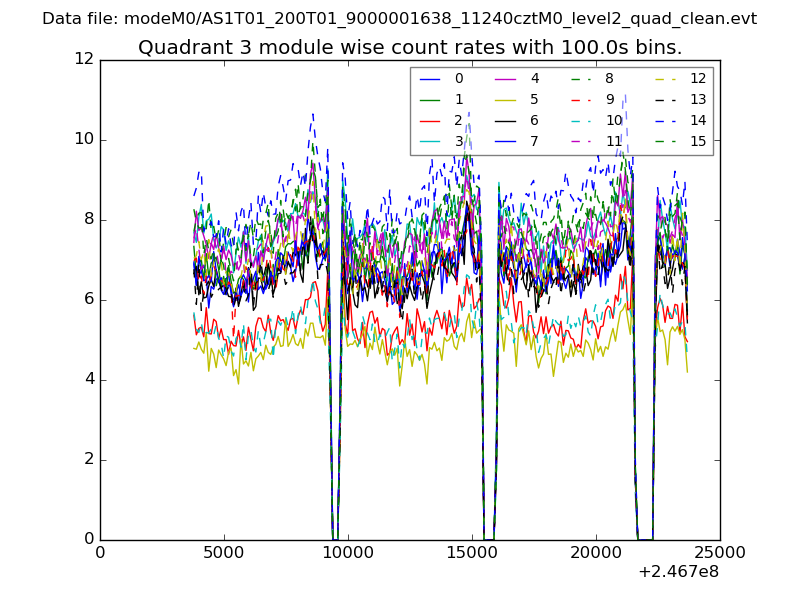 |
 |
| Parameter | Plot |
|---|---|
| CZT HV Monitor | 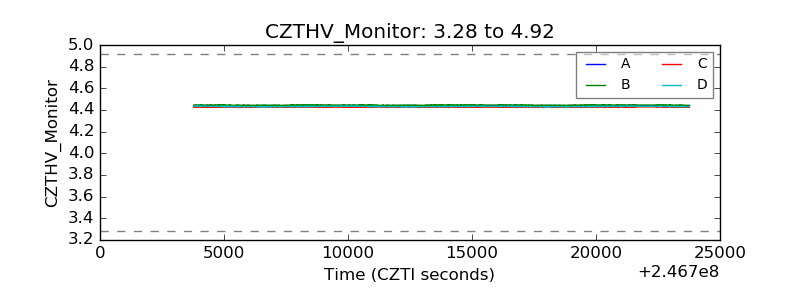 |
| D_VDD | 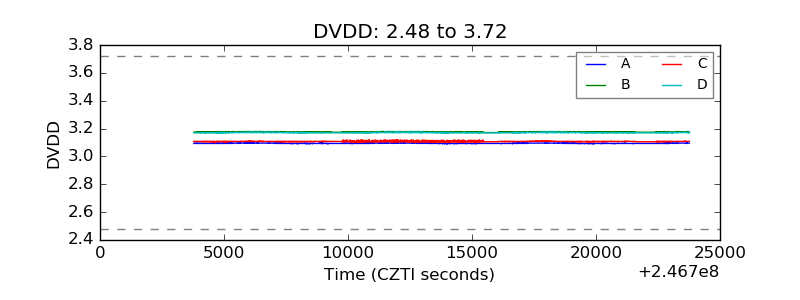 |
| Temperature 1 |  |
| Veto HV Monitor | 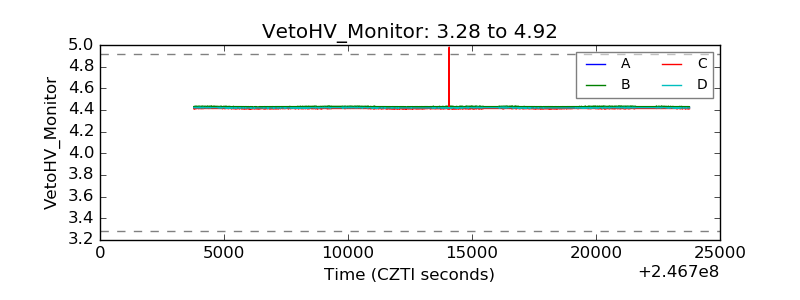 |
| Veto LLD | 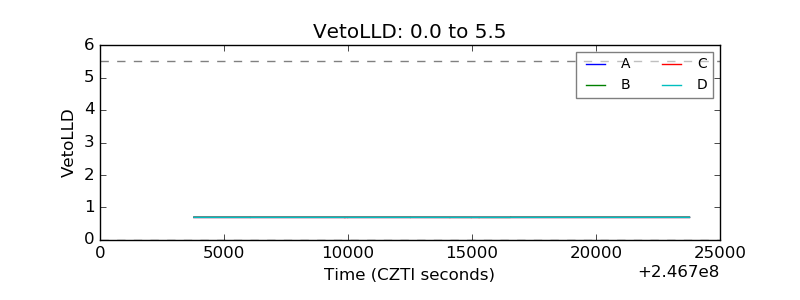 |
| Alpha Counter | 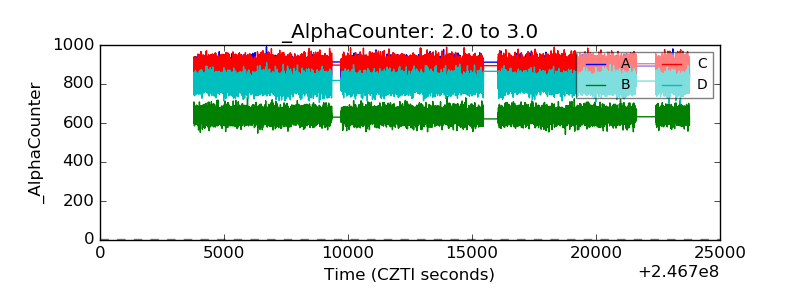 |
| _CPM_Rate | 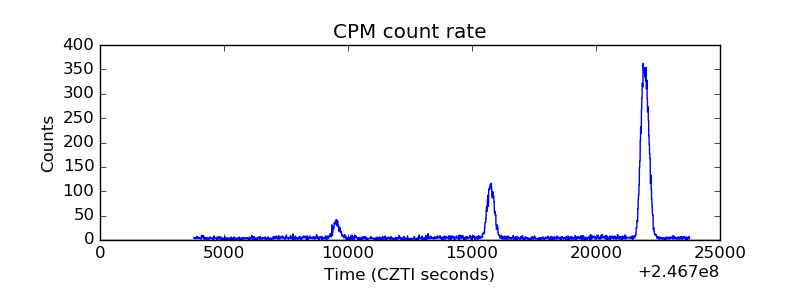 |
| CZT Counter | 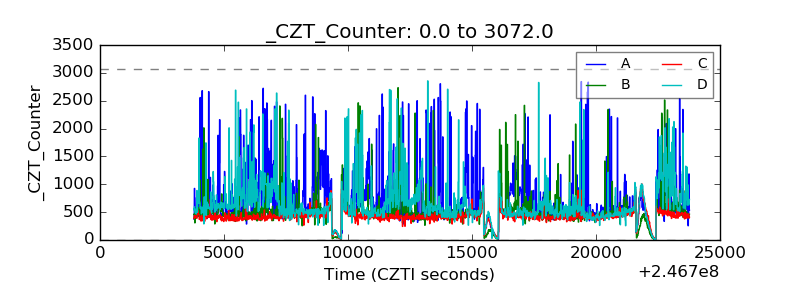 |
| +2.5 Volts monitor |  |
| +5 Volts monitor |  |
| _ROLL_ROT | 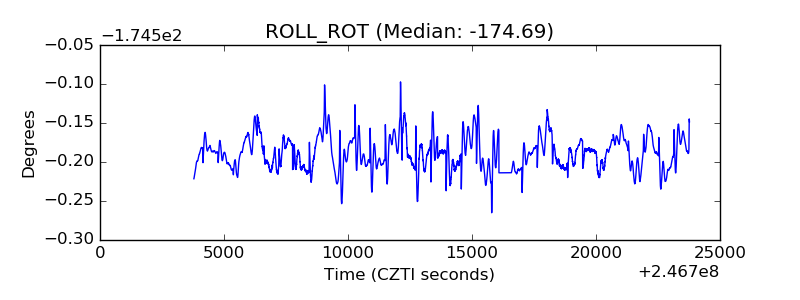 |
| _Roll_DEC | 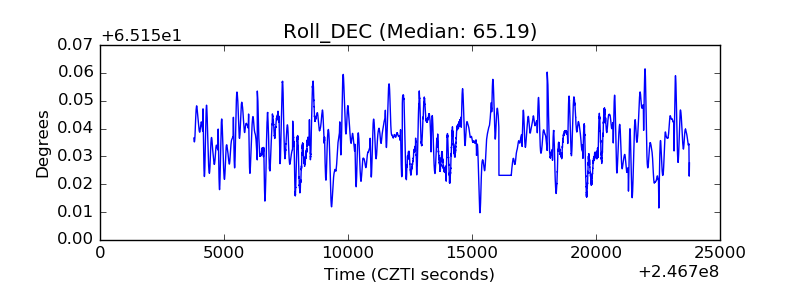 |
| _Roll_RA | 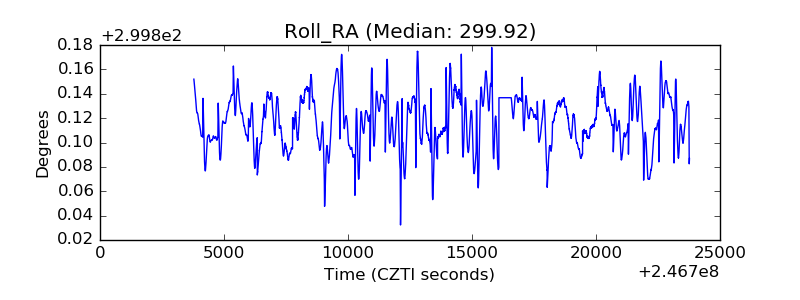 |
| Veto Counter | 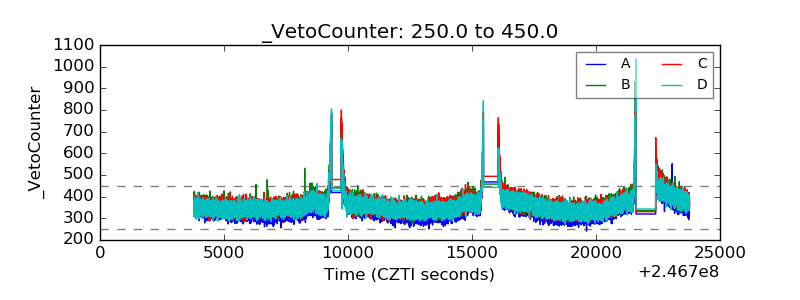 |