| Param | Original file | Final file |
|---|---|---|
| Filename | modeM0/AS1T01_200T01_9000001638_11241cztM0_level2.evt | modeM0/AS1T01_200T01_9000001638_11241cztM0_level2_quad_clean.evt |
| Size (bytes) | 216,803,520 | 45,138,240 |
| Size | 206.8 MB | 43.0 MB |
| Events in quadrant A | 1,793,847 | 295,808 |
| Events in quadrant B | 1,387,099 | 304,557 |
| Events in quadrant C | 1,101,198 | 302,548 |
| Events in quadrant D | 2,111,097 | 282,960 |
| Mode M9 | |||
|---|---|---|---|
| Quadrant | BADHDUFLAG | Total packets | Discarded packets |
| A | 1 | 273359709408 | 0 |
| B | 1 | -1 | -1 |
| C | 1 | -1 | -1 |
| D | 1 | -1 | -1 |
| Mode SS | |||
|---|---|---|---|
| Quadrant | BADHDUFLAG | Total packets | Discarded packets |
| A | 0 | 50 | 0 |
| B | 0 | 50 | 0 |
| C | 0 | 50 | 0 |
| D | 0 | 50 | 0 |
| Mode M0 | |||
|---|---|---|---|
| Quadrant | BADHDUFLAG | Total packets | Discarded packets |
| A | 0 | 6994 | 1 |
| B | 0 | 5816 | 1 |
| C | 0 | 5065 | 1 |
| D | 0 | 8004 | 1 |
| Quadrant | Total seconds | Saturated seconds | Saturation percentage |
|---|---|---|---|
| A | 2519 | 112 | 4.446209% |
| B | 2519 | 33 | 1.310044% |
| C | 2519 | 2 | 0.079397% |
| D | 2519 | 125 | 4.962287% |
Noise dominated data is calculated using 1-second bins in cleaned event files. If a bin has >2000 counts, and if more than 50% of those come from <1% of pixels, then it is considered to be noise-dominated and hence unusable.
| Quadrant | # 1 sec bins | Bins with >0 counts | Bins with >2000 counts | High rate bins dominated by noise | Noise dominated (total time) | Noise dominated (detector-on time) | Marked lightcurve |
|---|---|---|---|---|---|---|---|
| A | 2519 | 2519 | 66 | 66 | 2.62% | 2.62% | 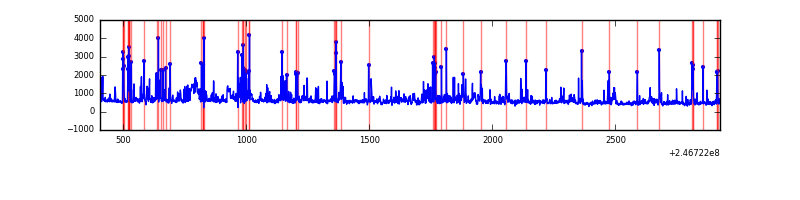 |
| B | 2519 | 2519 | 18 | 18 | 0.71% | 0.71% | 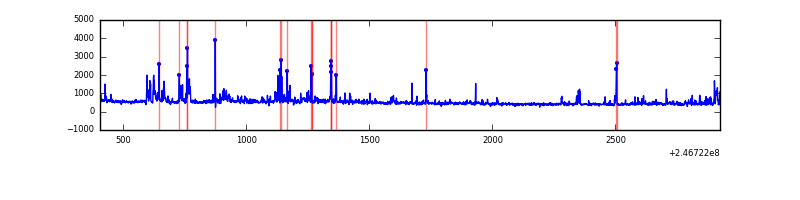 |
| C | 2519 | 2519 | 0 | 0 | 0.00% | 0.00% | 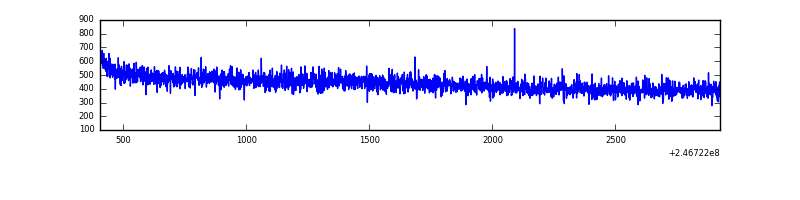 |
| D | 2519 | 2519 | 73 | 73 | 2.90% | 2.90% | 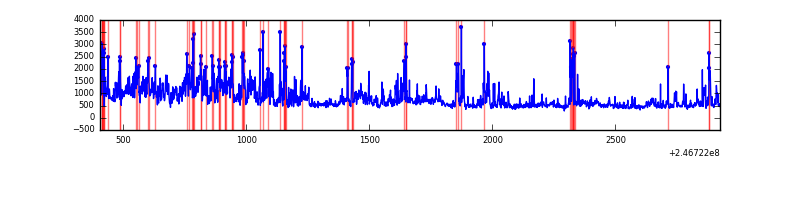 |
Top three noisy pixels from each quadrant. If the there are fewer than three noisy pixels in the level2.evt file, extra rows are filled as -1
| Pixel properties | Quadrant properties | ||||||
|---|---|---|---|---|---|---|---|
| Quadrant | DetID | PixID | Counts | Sigma | Mean | Median | Sigma |
| A | 8 | 5 | 421249 | 7033.82 | 285 | 279 | 59.8 |
| A | 15 | 174 | 60634 | 1008.45 | 285 | 279 | 59.8 |
| A | 1 | 162 | 60584 | 1007.61 | 285 | 279 | 59.8 |
| B | 4 | 239 | 113603 | 2006.64 | 287 | 280 | 56.5 |
| B | 11 | 51 | 66783 | 1177.59 | 287 | 280 | 56.5 |
| B | 4 | 80 | 36888 | 648.23 | 287 | 280 | 56.5 |
| C | 13 | 61 | 2108 | 27.53 | 282 | 283 | 66.3 |
| C | 5 | 239 | 1175 | 13.46 | 282 | 283 | 66.3 |
| C | 4 | 254 | 962 | 10.24 | 282 | 283 | 66.3 |
| D | 12 | 157 | 536246 | 7772.95 | 280 | 272 | 69.0 |
| D | 1 | 52 | 290685 | 4211.71 | 280 | 272 | 69.0 |
| D | 8 | 195 | 59040 | 852.28 | 280 | 272 | 69.0 |
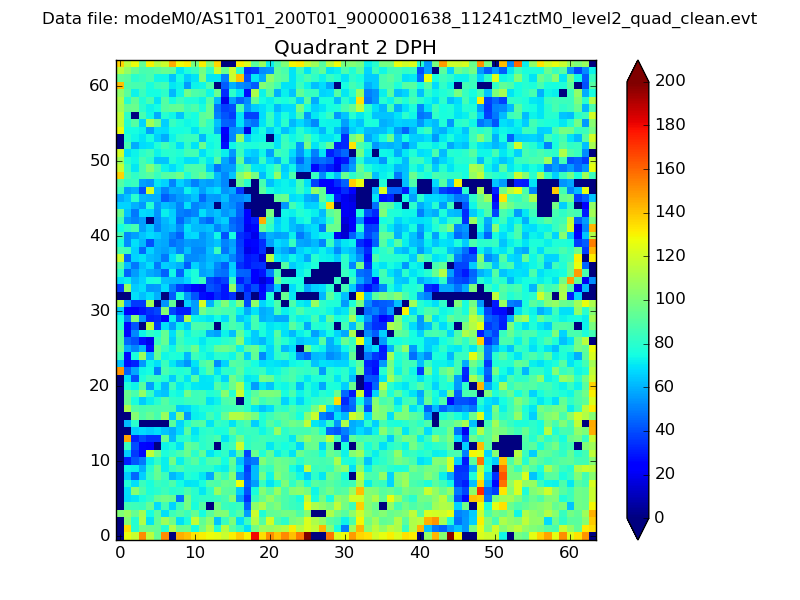
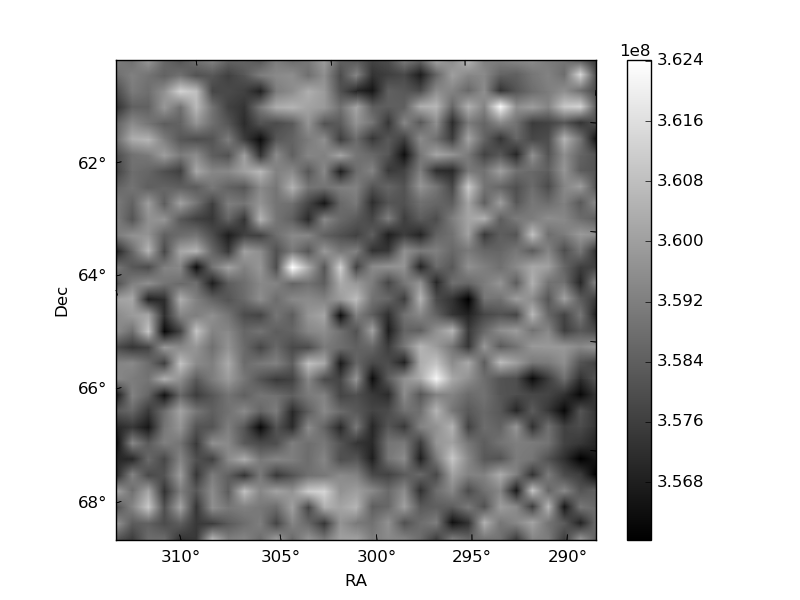
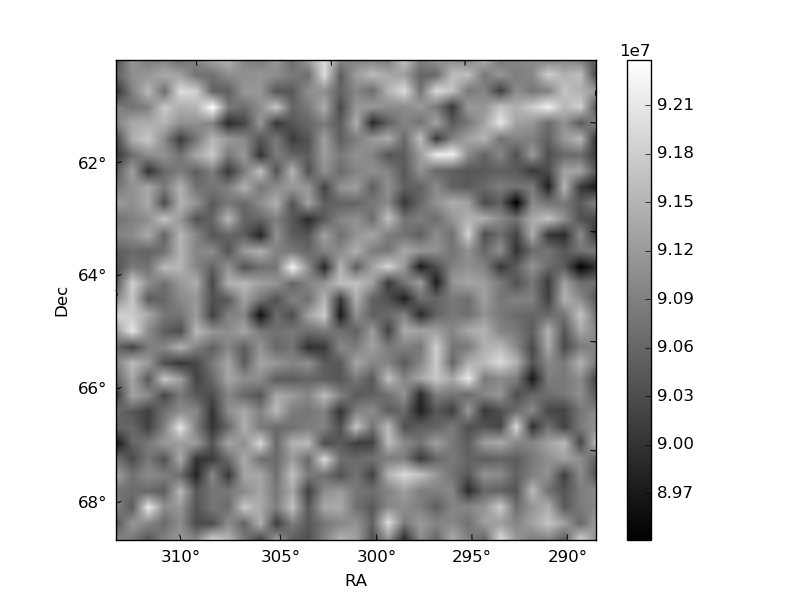
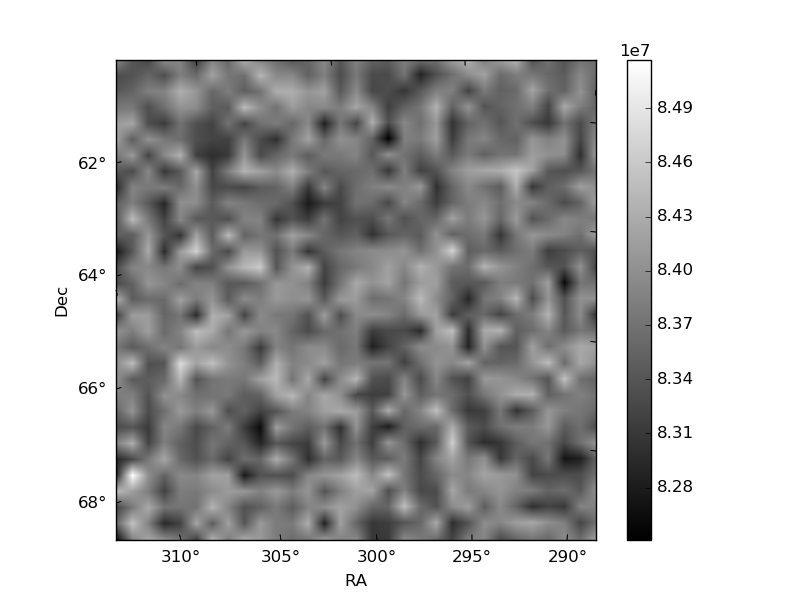
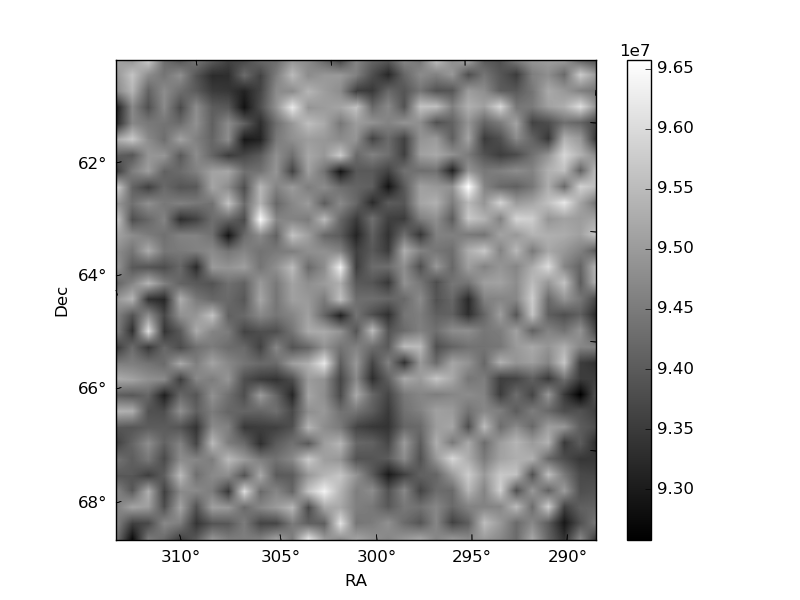
Histogram calculated using DETX and DETY for each event in the final _common_clean file
| Quadrant A | 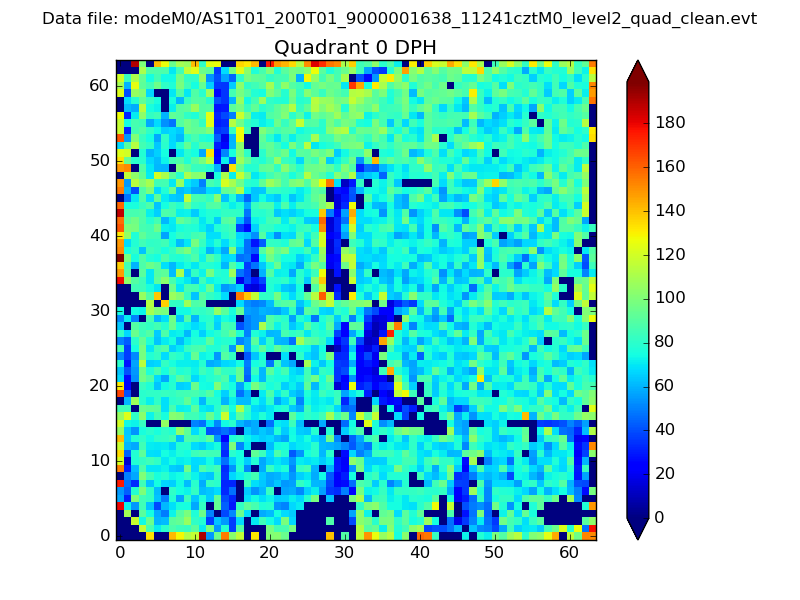 |
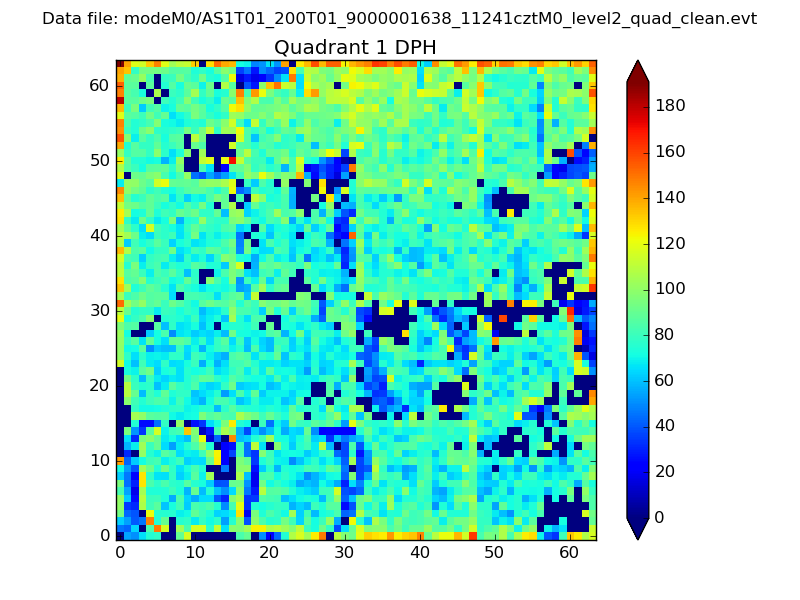 |
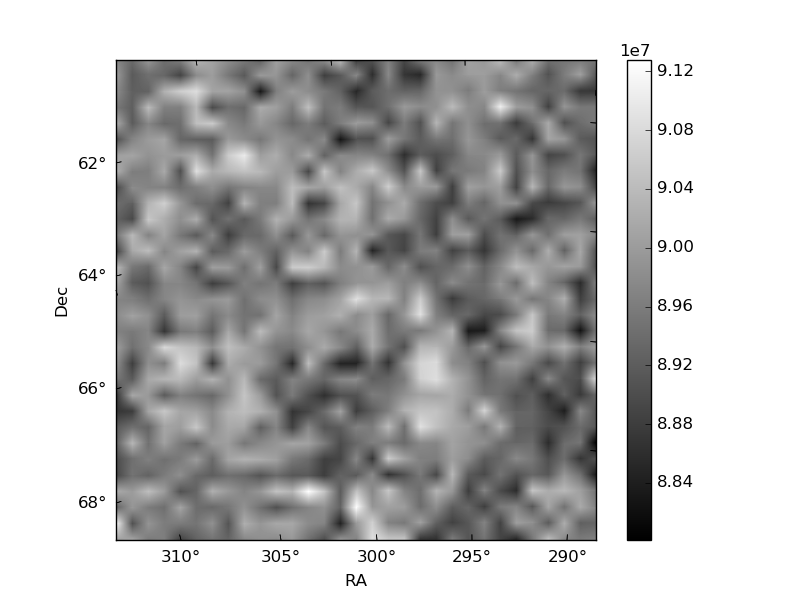
Quadrant B |
|---|---|---|---|
| Quadrant D | 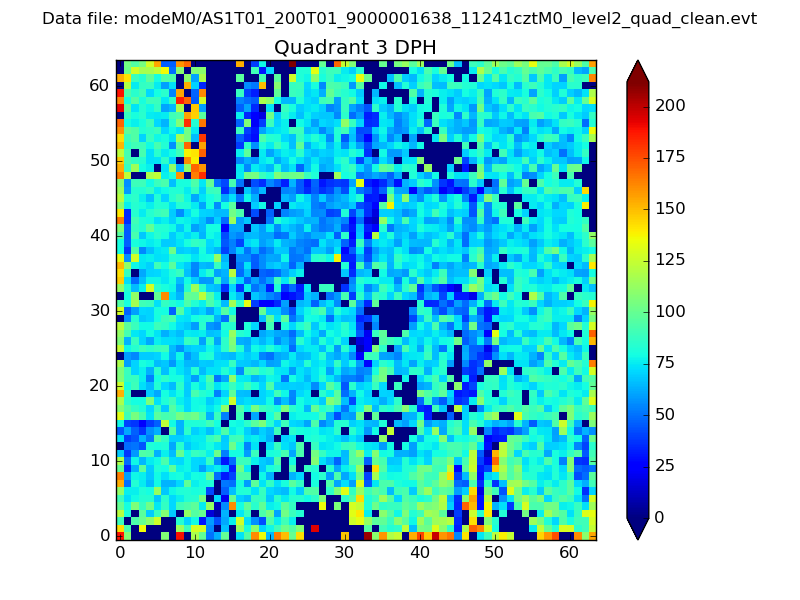 |
 |
Quadrant C |
| Plot type | Count rate plots | Images |
|---|---|---|
| Comparison with Poisson distribution Blue bars denote a histogram of data divided into 1 sec bins. Red curve is a Poisson curve with rate = median count rate of data. |
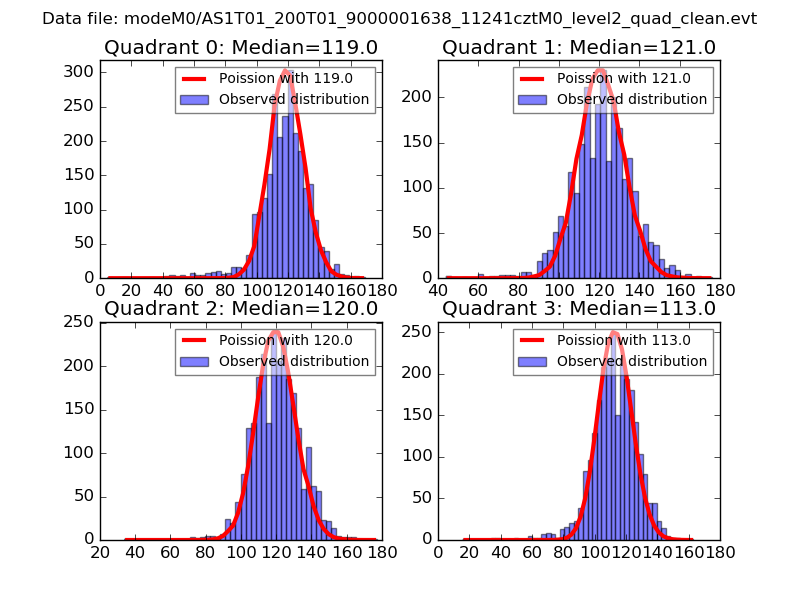 |
 |
| Quadrant-wise count rates Data is divided into 100 sec bins |
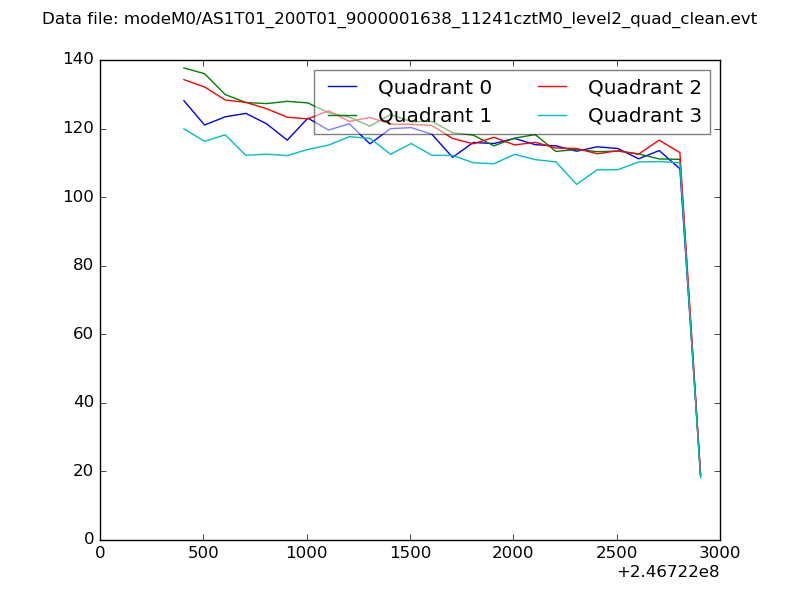 |
|
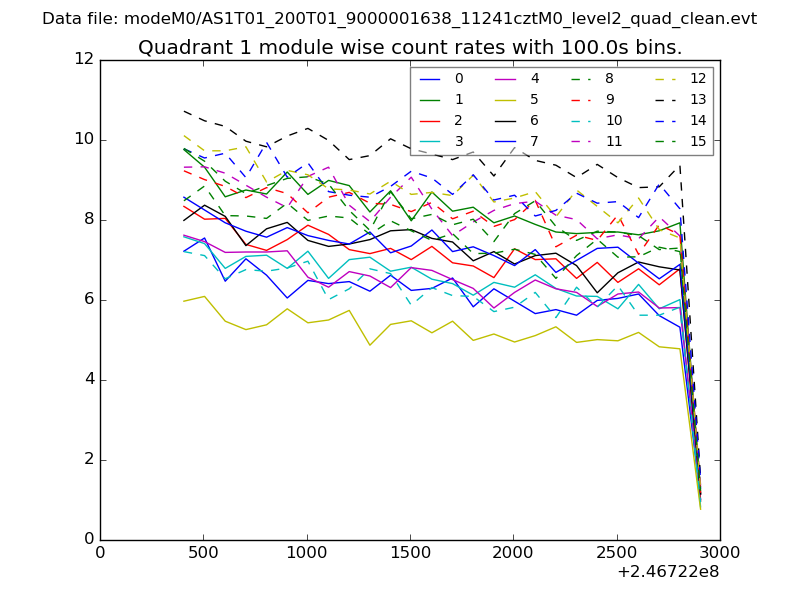
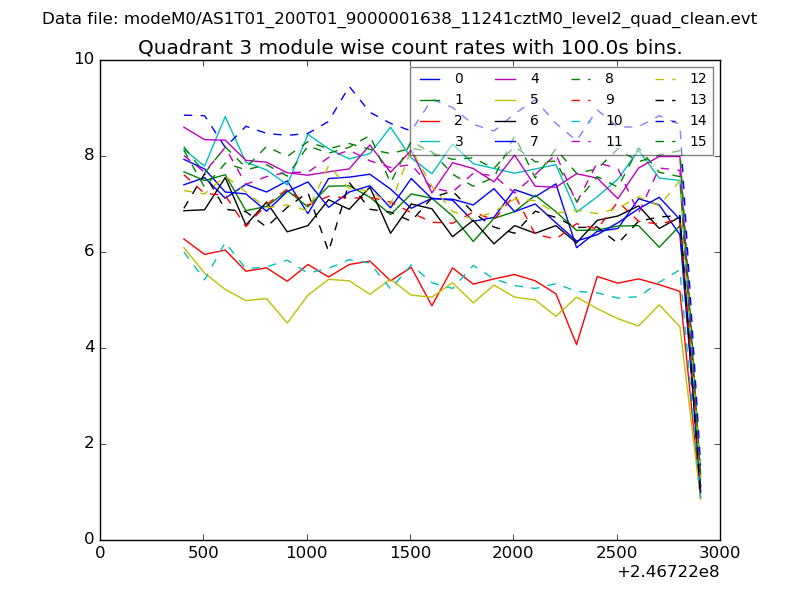
| Module-wise count rates for Quadrant A Data is divided into 100 sec bins |
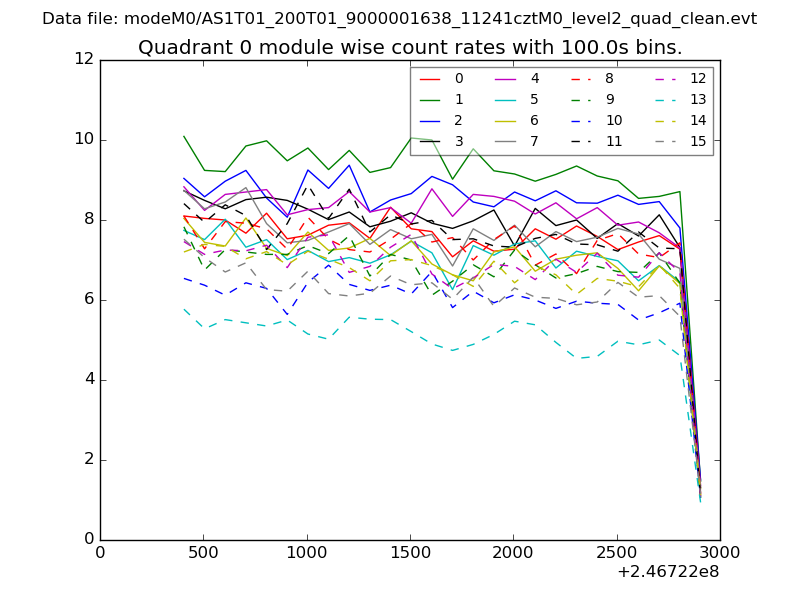 |
 |
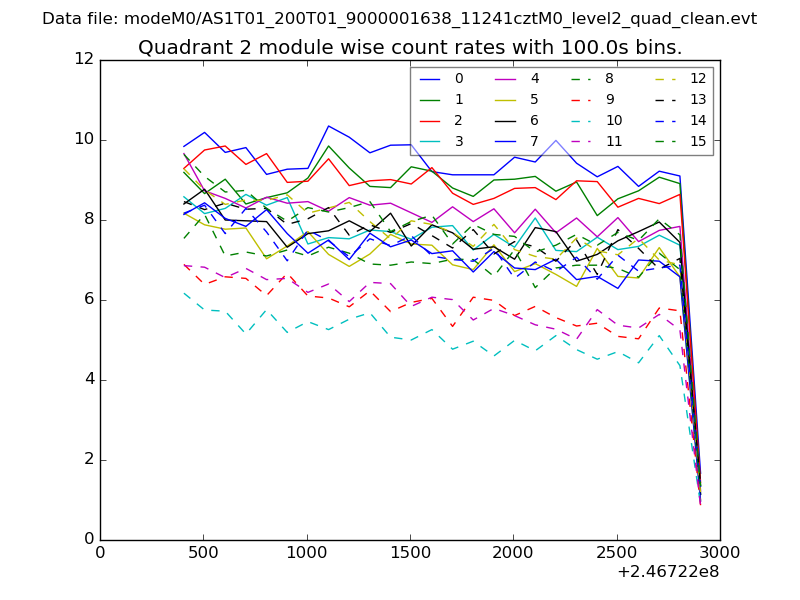
| Module-wise count rates for Quadrant B Data is divided into 100 sec bins |
 |
 |
| Module-wise count rates for Quadrant C Data is divided into 100 sec bins |
 |
 |
| Module-wise count rates for Quadrant D Data is divided into 100 sec bins |
 |
 |
| Parameter | Plot |
|---|---|
| CZT HV Monitor | 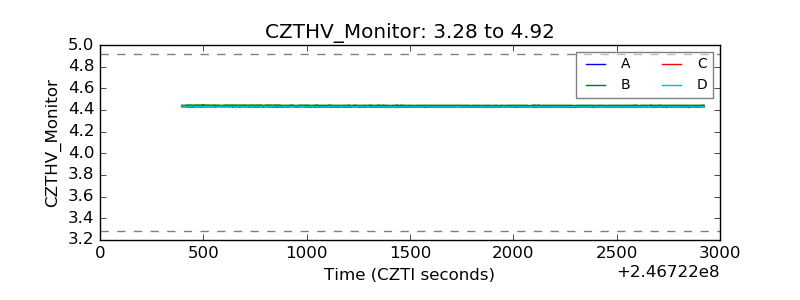 |
| D_VDD | 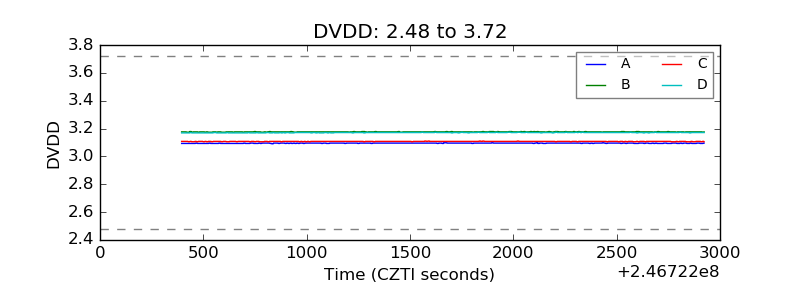 |
| Temperature 1 | 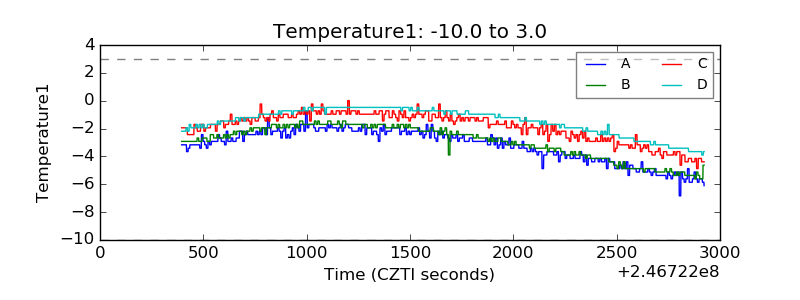 |
| Veto HV Monitor | 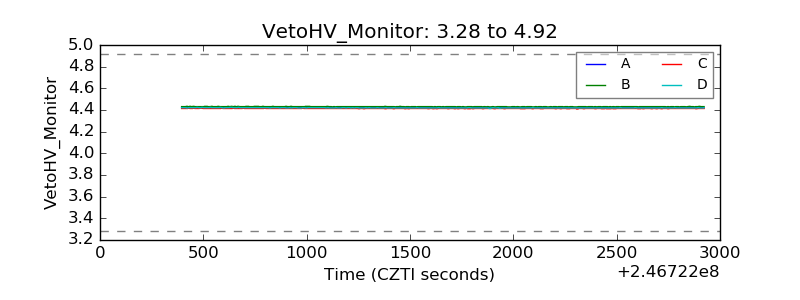 |
| Veto LLD | 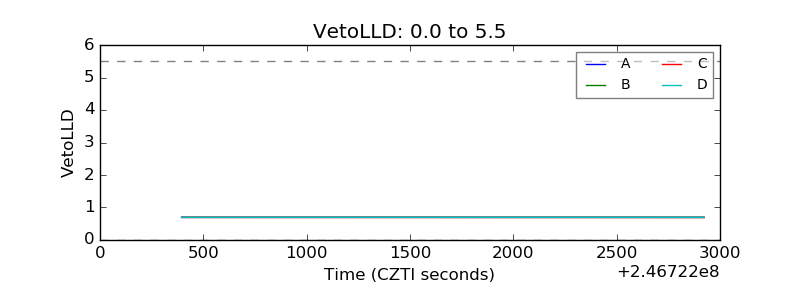 |
| Alpha Counter | 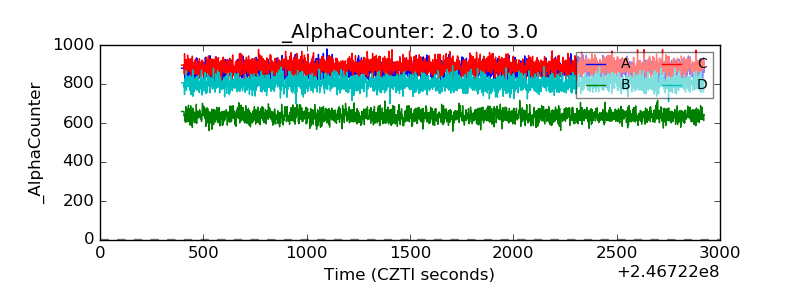 |
| _CPM_Rate | 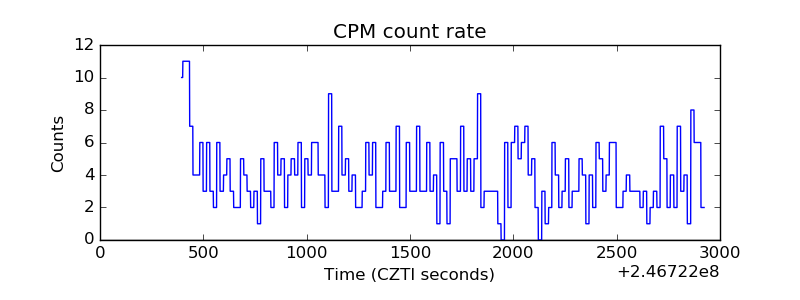 |
| CZT Counter | 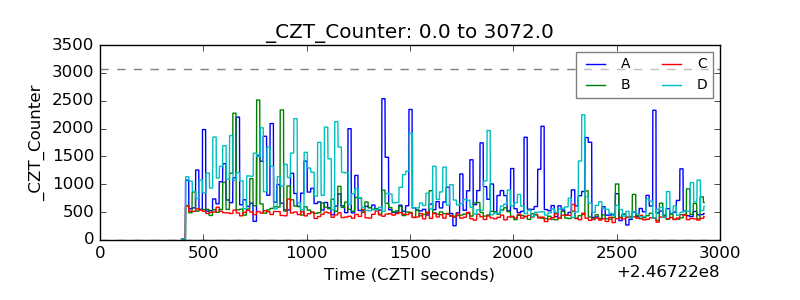 |
| +2.5 Volts monitor |  |
| +5 Volts monitor | 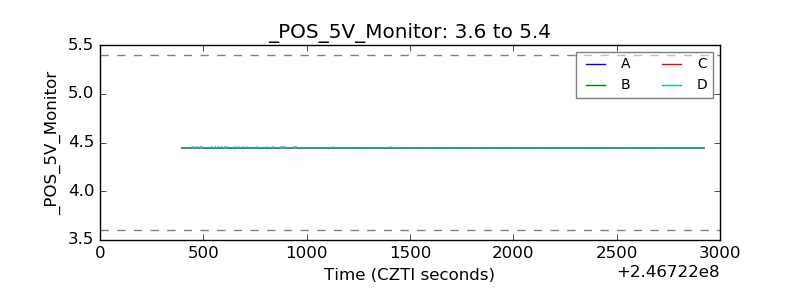 |
| _ROLL_ROT | 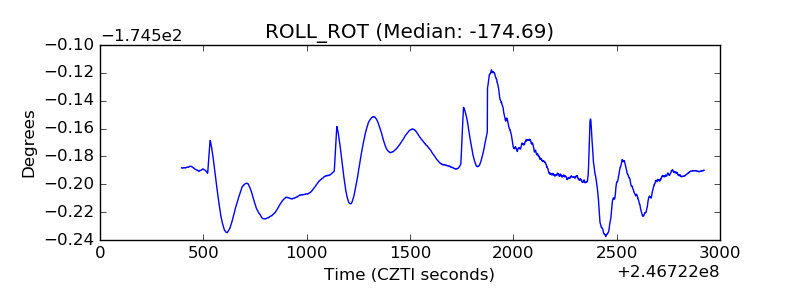 |
| _Roll_DEC | 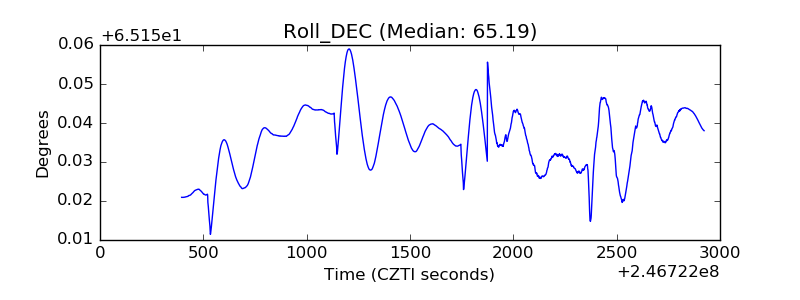 |
| _Roll_RA | 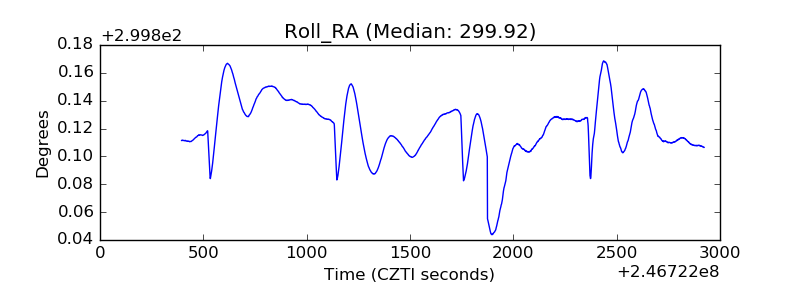 |
| Veto Counter | 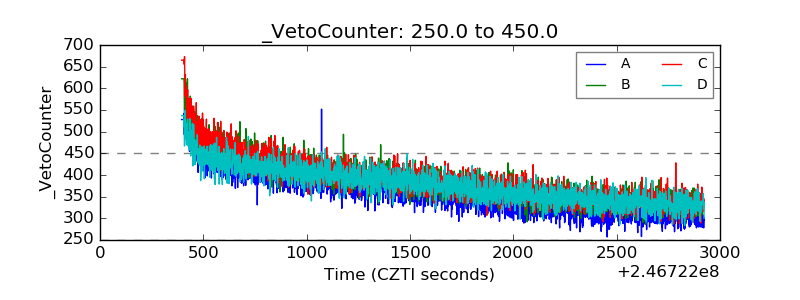 |