| Param | Original file | Final file |
|---|---|---|
| Filename | modeM0/AS1T01_202T01_9000001640cztM0_level2.fits | modeM0/AS1T01_202T01_9000001640cztM0_level2_quad_clean.evt |
| Size (bytes) | 603,587,520 | 800,841,600 |
| Size | 575.6 MB | 763.7 MB |
| Events in quadrant A | 3,598,842 | 5,216,425 |
| Events in quadrant B | 3,525,462 | 5,212,295 |
| Events in quadrant C | 3,549,876 | 4,791,266 |
| Events in quadrant D | 3,087,842 | 4,524,364 |
| Mode M9 | |||
|---|---|---|---|
| Quadrant | BADHDUFLAG | Total packets | Discarded packets |
| A | 0 | 96 | 0 |
| B | 0 | 96 | 0 |
| C | 0 | 96 | 0 |
| D | 0 | 96 | 0 |
| Mode M0 | |||
|---|---|---|---|
| Quadrant | BADHDUFLAG | Total packets | Discarded packets |
| A | 0 | 169530 | 0 |
| B | 0 | 163369 | 0 |
| C | 0 | 166892 | 0 |
| D | 0 | 179075 | 0 |
| Mode SS | |||
|---|---|---|---|
| Quadrant | BADHDUFLAG | Total packets | Discarded packets |
| A | 0 | 1342 | 0 |
| B | 0 | 1342 | 0 |
| C | 0 | 1344 | 0 |
| D | 0 | 1344 | 0 |
| Quadrant | Total seconds | Saturated seconds | Saturation percentage |
|---|---|---|---|
| A | 65777 | 2869 | 4.361707% |
| B | 65775 | 2838 | 4.314709% |
| C | 65777 | 5212 | 7.923742% |
| D | 65774 | 3134 | 4.764801% |
Noise dominated data is calculated using 1-second bins in cleaned event files. If a bin has >2000 counts, and if more than 50% of those come from <1% of pixels, then it is considered to be noise-dominated and hence unusable.
| Quadrant | # 1 sec bins | Bins with >0 counts | Bins with >2000 counts | High rate bins dominated by noise | Noise dominated (total time) | Noise dominated (detector-on time) | Marked lightcurve |
|---|---|---|---|---|---|---|---|
| A | 75688 | 65732 | 0 | 0 | 0.00% | 0.00% |  |
| B | 75688 | 65775 | 0 | 0 | 0.00% | 0.00% |  |
| C | 75688 | 65699 | 0 | 0 | 0.00% | 0.00% |  |
| D | 75688 | 65679 | 0 | 0 | 0.00% | 0.00% |  |
Top three noisy pixels from each quadrant. If the there are fewer than three noisy pixels in the level2.evt file, extra rows are filled as -1
| Pixel properties | Quadrant properties | ||||||
|---|---|---|---|---|---|---|---|
| Quadrant | DetID | PixID | Counts | Sigma | Mean | Median | Sigma |
| A | 14 | 188 | 3648 | 11.57 | 935 | 876 | 239.6 |
| A | 0 | 29 | 3529 | 11.07 | 935 | 876 | 239.6 |
| A | 14 | 204 | 3103 | 9.3 | 935 | 876 | 239.6 |
| B | 2 | 9 | 3167 | 12.52 | 929 | 888 | 182.0 |
| B | 12 | 226 | 2556 | 9.16 | 929 | 888 | 182.0 |
| B | 2 | 8 | 2405 | 8.33 | 929 | 888 | 182.0 |
| C | 3 | 202 | 3208 | 9.58 | 935 | 875 | 243.5 |
| C | 1 | 80 | 2968 | 8.6 | 935 | 875 | 243.5 |
| C | 1 | 81 | 2928 | 8.43 | 935 | 875 | 243.5 |
| D | 4 | 246 | 2435 | 6.92 | 878 | 801 | 235.9 |
| D | 3 | 14 | 2296 | 6.34 | 878 | 801 | 235.9 |
| D | 6 | 231 | 2258 | 6.17 | 878 | 801 | 235.9 |
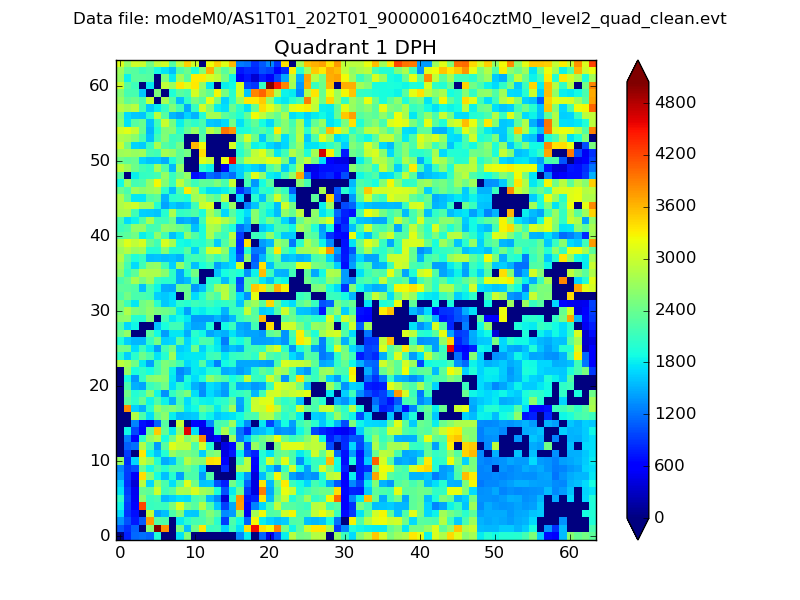
Histogram calculated using DETX and DETY for each event in the final _common_clean file
| Quadrant A |  |
 |
Quadrant B |
|---|---|---|---|
| Quadrant D |  |
 |
Quadrant C |
| Plot type | Count rate plots | Images |
|---|---|---|
| Comparison with Poisson distribution Blue bars denote a histogram of data divided into 1 sec bins. Red curve is a Poisson curve with rate = median count rate of data. |
 |
 |
| Quadrant-wise count rates Data is divided into 100 sec bins |
 |
|
| Module-wise count rates for Quadrant A Data is divided into 100 sec bins |
 |
 |
| Module-wise count rates for Quadrant B Data is divided into 100 sec bins |
 |
 |
| Module-wise count rates for Quadrant C Data is divided into 100 sec bins |
 |
 |
| Module-wise count rates for Quadrant D Data is divided into 100 sec bins |
 |
 |
| Parameter | Plot |
|---|---|
| CZT HV Monitor |  |
| D_VDD |  |
| Temperature 1 |  |
| Veto HV Monitor |  |
| Veto LLD |  |
| Alpha Counter |  |
| _CPM_Rate |  |
| CZT Counter |  |
| +2.5 Volts monitor |  |
| +5 Volts monitor |  |
| _ROLL_ROT |  |
| _Roll_DEC |  |
| _Roll_RA |  |
| Veto Counter |  |