| Param | Original file | Final file |
|---|---|---|
| Filename | modeM0/AS1T01_202T01_9000001640_11241cztM0_level2.evt | modeM0/AS1T01_202T01_9000001640_11241cztM0_level2_quad_clean.evt |
| Size (bytes) | 319,348,800 | 70,381,440 |
| Size | 304.6 MB | 67.1 MB |
| Events in quadrant A | 2,700,728 | 471,365 |
| Events in quadrant B | 2,166,640 | 478,689 |
| Events in quadrant C | 1,821,455 | 486,368 |
| Events in quadrant D | 2,736,085 | 438,847 |
| Mode M9 | |||
|---|---|---|---|
| Quadrant | BADHDUFLAG | Total packets | Discarded packets |
| A | 0 | 9 | 0 |
| B | 0 | 9 | 0 |
| C | 0 | 9 | 0 |
| D | 0 | 9 | 0 |
| Mode M0 | |||
|---|---|---|---|
| Quadrant | BADHDUFLAG | Total packets | Discarded packets |
| A | 0 | 10485 | 2 |
| B | 0 | 8804 | 1 |
| C | 0 | 7635 | 1 |
| D | 0 | 10592 | 1 |
| Mode SS | |||
|---|---|---|---|
| Quadrant | BADHDUFLAG | Total packets | Discarded packets |
| A | 0 | 76 | 0 |
| B | 0 | 76 | 0 |
| C | 0 | 76 | 0 |
| D | 0 | 76 | 0 |
| Quadrant | Total seconds | Saturated seconds | Saturation percentage |
|---|---|---|---|
| A | 3611 | 189 | 5.234007% |
| B | 3611 | 105 | 2.907782% |
| C | 3611 | 37 | 1.024647% |
| D | 3611 | 270 | 7.477153% |
Noise dominated data is calculated using 1-second bins in cleaned event files. If a bin has >2000 counts, and if more than 50% of those come from <1% of pixels, then it is considered to be noise-dominated and hence unusable.
| Quadrant | # 1 sec bins | Bins with >0 counts | Bins with >2000 counts | High rate bins dominated by noise | Noise dominated (total time) | Noise dominated (detector-on time) | Marked lightcurve |
|---|---|---|---|---|---|---|---|
| A | 4566 | 3612 | 87 | 87 | 1.91% | 2.41% | 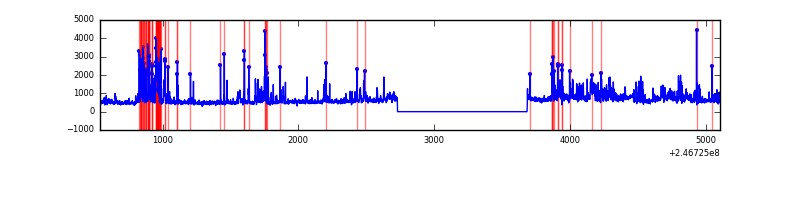 |
| B | 4566 | 3612 | 16 | 16 | 0.35% | 0.44% | 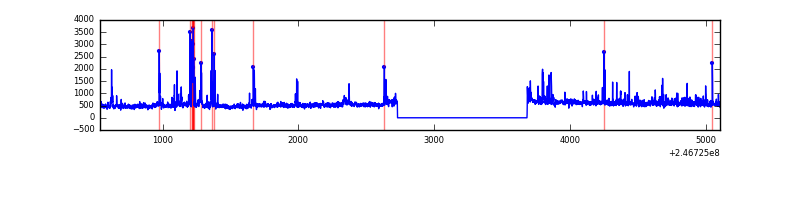 |
| C | 4566 | 3612 | 0 | 0 | 0.00% | 0.00% | 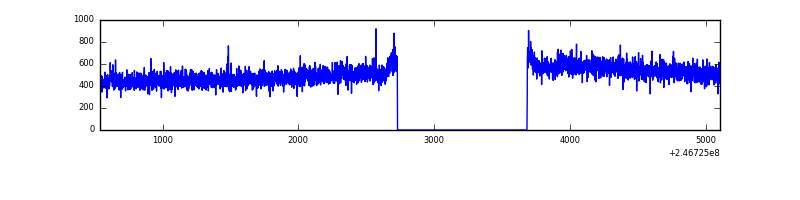 |
| D | 4566 | 3612 | 157 | 157 | 3.44% | 4.35% | 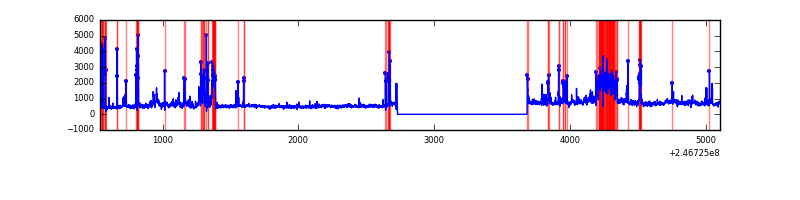 |
Top three noisy pixels from each quadrant. If the there are fewer than three noisy pixels in the level2.evt file, extra rows are filled as -1
| Pixel properties | Quadrant properties | ||||||
|---|---|---|---|---|---|---|---|
| Quadrant | DetID | PixID | Counts | Sigma | Mean | Median | Sigma |
| A | 8 | 5 | 534009 | 5048.97 | 471 | 462 | 105.7 |
| A | 14 | 238 | 279457 | 2640.14 | 471 | 462 | 105.7 |
| A | 1 | 162 | 22652 | 209.98 | 471 | 462 | 105.7 |
| B | 4 | 239 | 166293 | 1703.08 | 475 | 465 | 97.4 |
| B | 11 | 51 | 61417 | 625.98 | 475 | 465 | 97.4 |
| B | 15 | 204 | 38117 | 386.69 | 475 | 465 | 97.4 |
| C | 13 | 61 | 3499 | 26.81 | 466 | 472 | 112.9 |
| C | 4 | 254 | 2344 | 16.58 | 466 | 472 | 112.9 |
| C | 12 | 4 | 2050 | 13.97 | 466 | 472 | 112.9 |
| D | 13 | 104 | 430653 | 3685.37 | 448 | 437 | 116.7 |
| D | 10 | 253 | 196877 | 1682.77 | 448 | 437 | 116.7 |
| D | 8 | 195 | 188708 | 1612.79 | 448 | 437 | 116.7 |
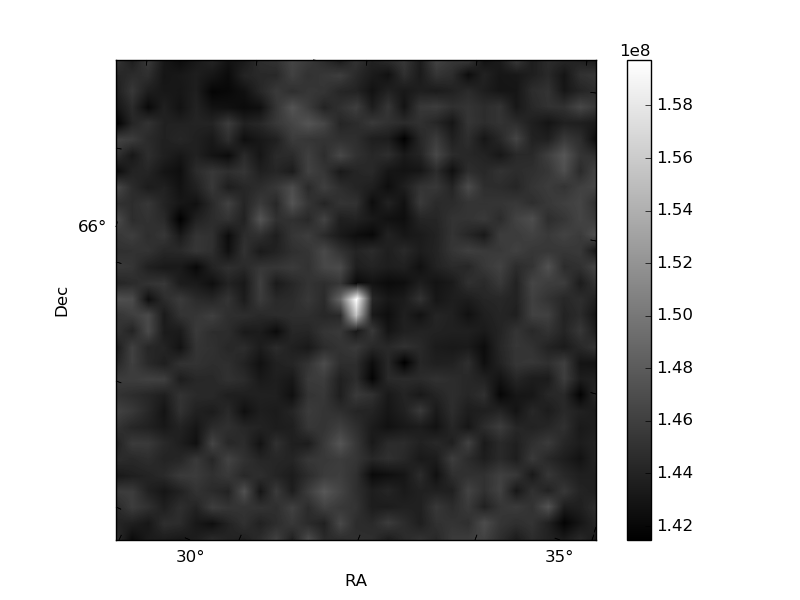
Histogram calculated using DETX and DETY for each event in the final _common_clean file
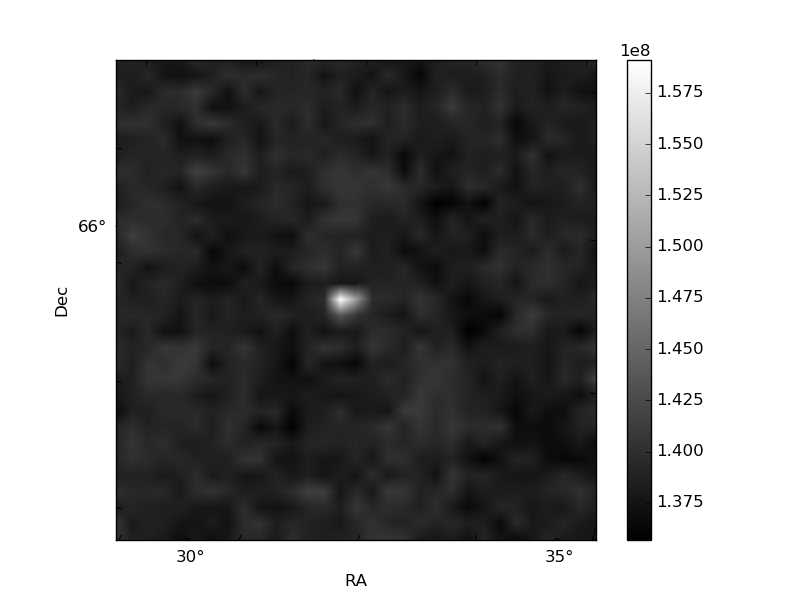
| Quadrant A | 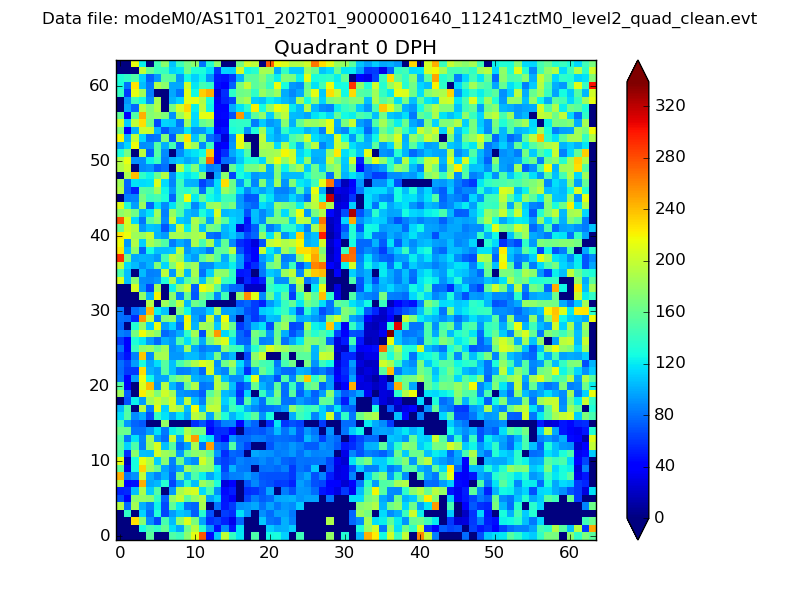 |
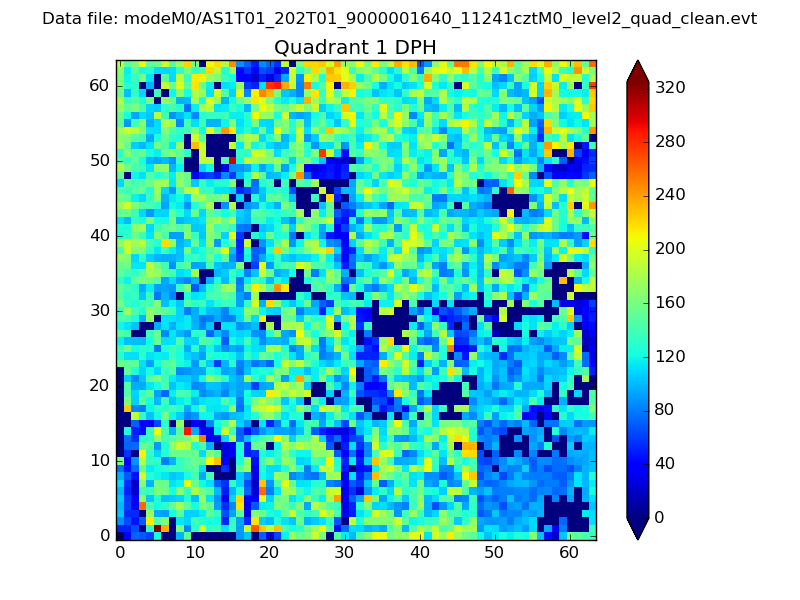 |
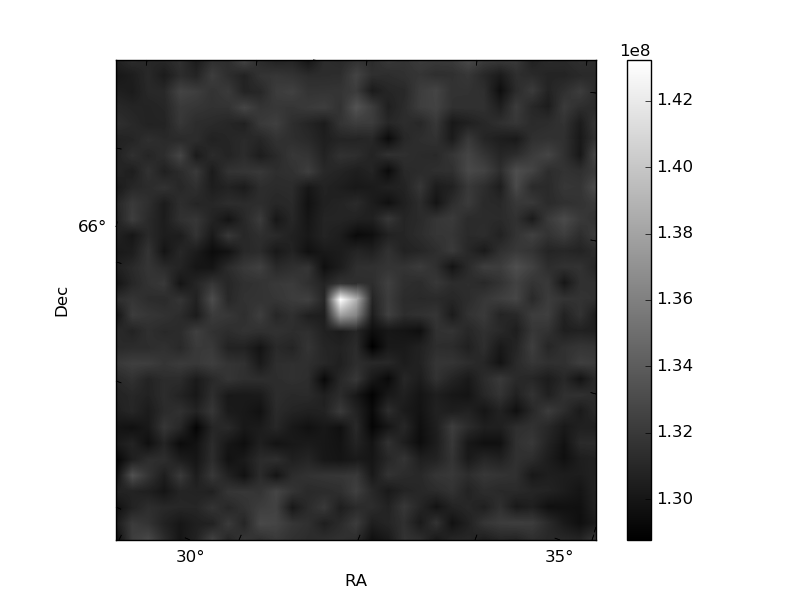
Quadrant B |
|---|---|---|---|
| Quadrant D | 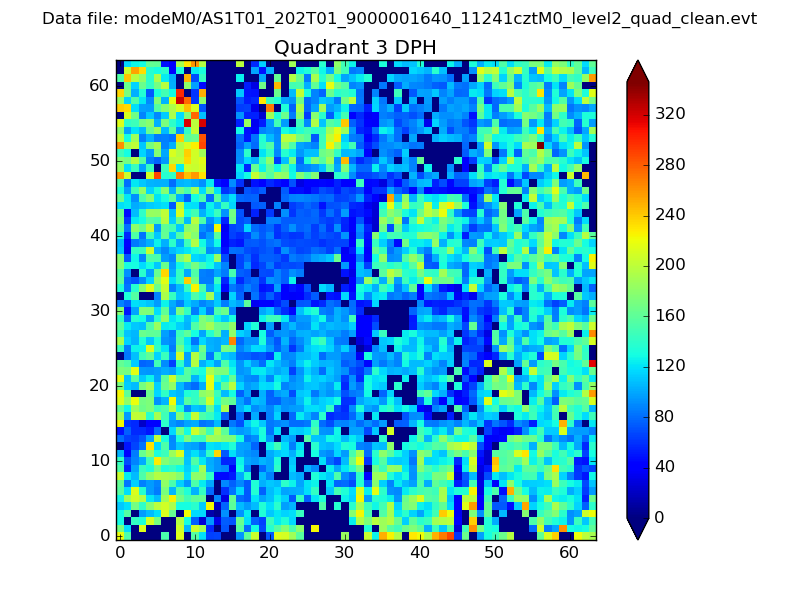 |
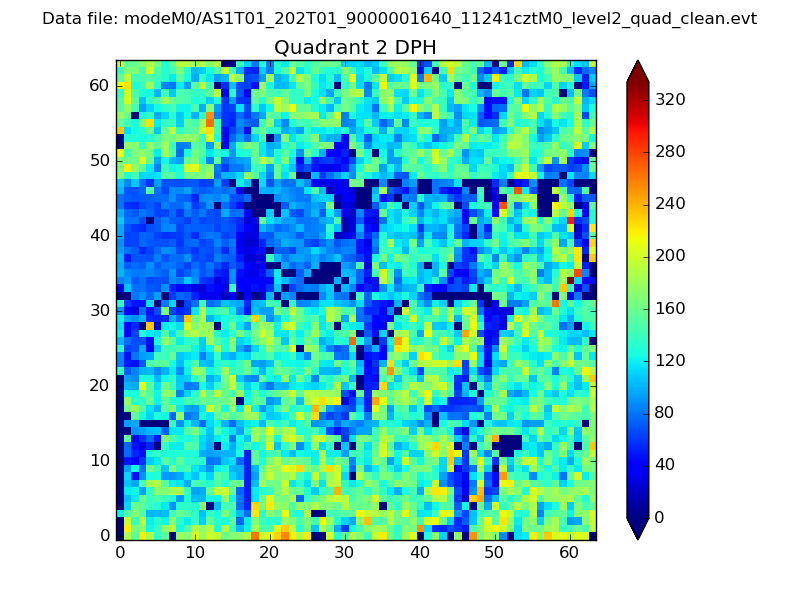 |
Quadrant C |
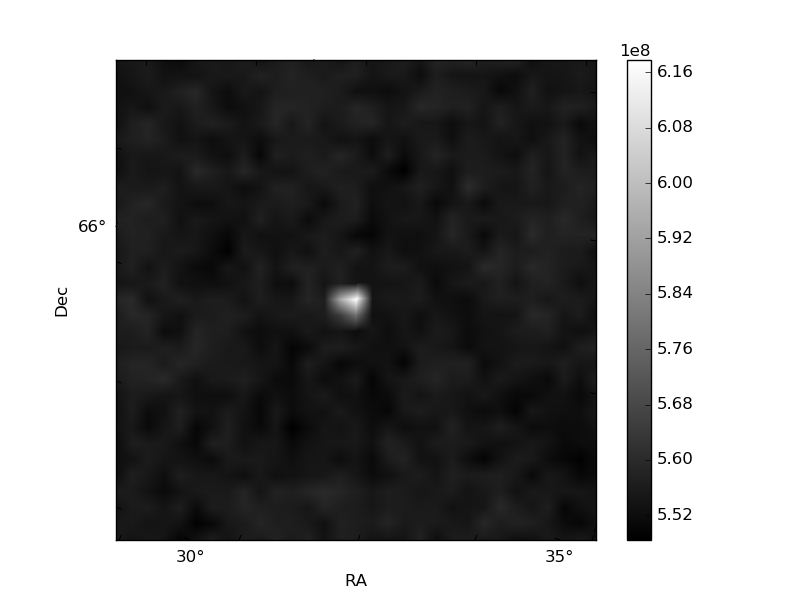
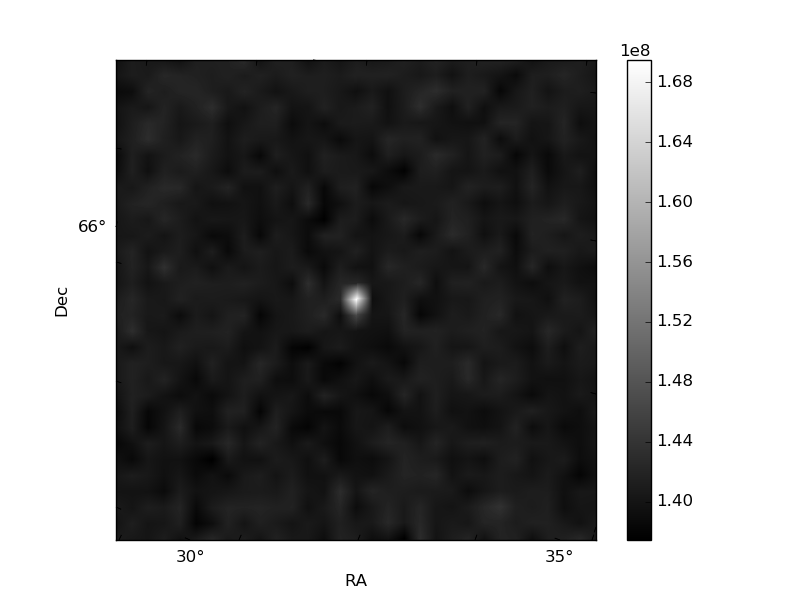
| Plot type | Count rate plots | Images |
|---|---|---|
| Comparison with Poisson distribution Blue bars denote a histogram of data divided into 1 sec bins. Red curve is a Poisson curve with rate = median count rate of data. |
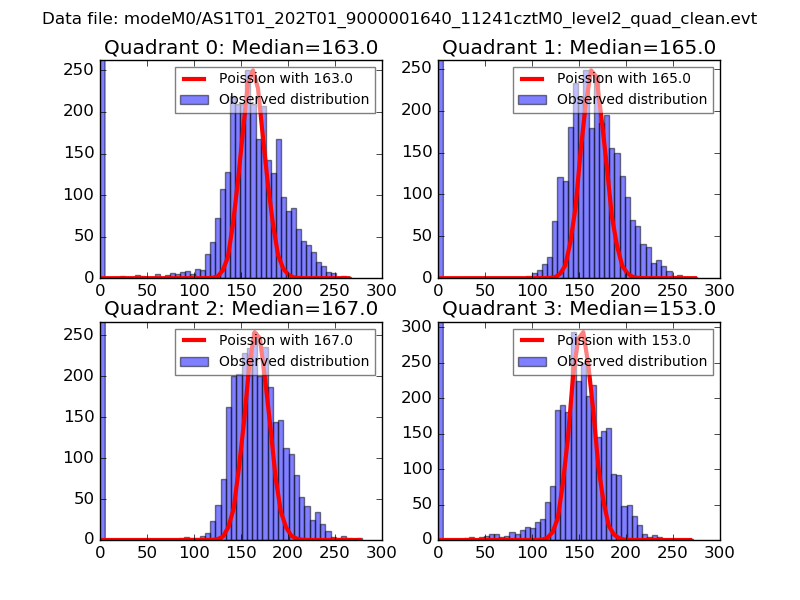 |
 |
| Quadrant-wise count rates Data is divided into 100 sec bins |
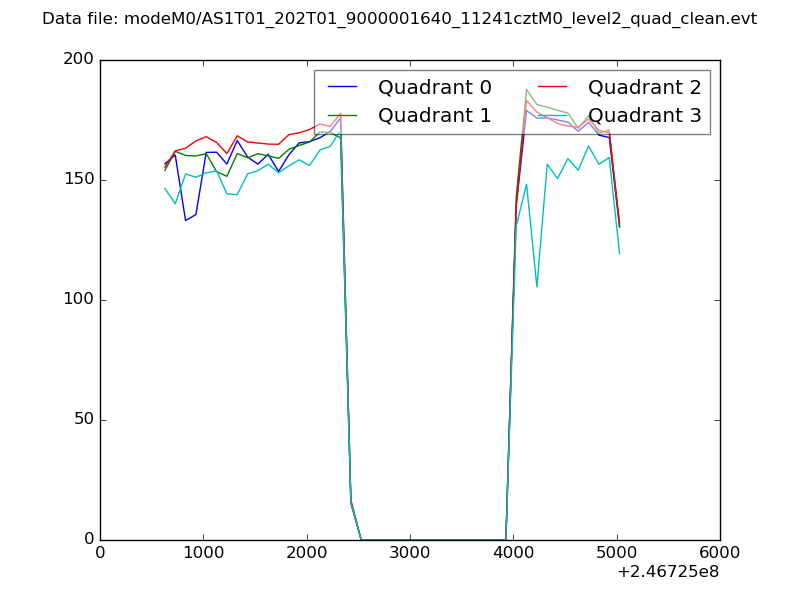 |
|
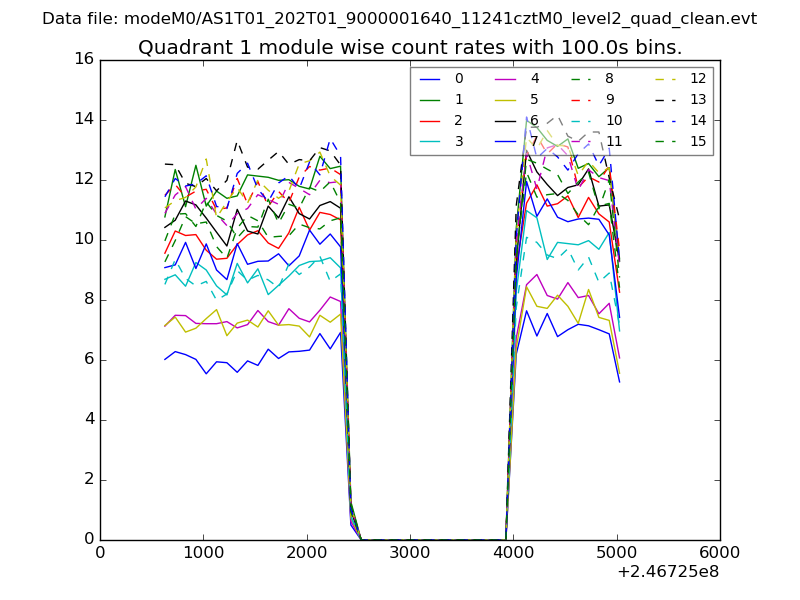
| Module-wise count rates for Quadrant A Data is divided into 100 sec bins |
 |
 |
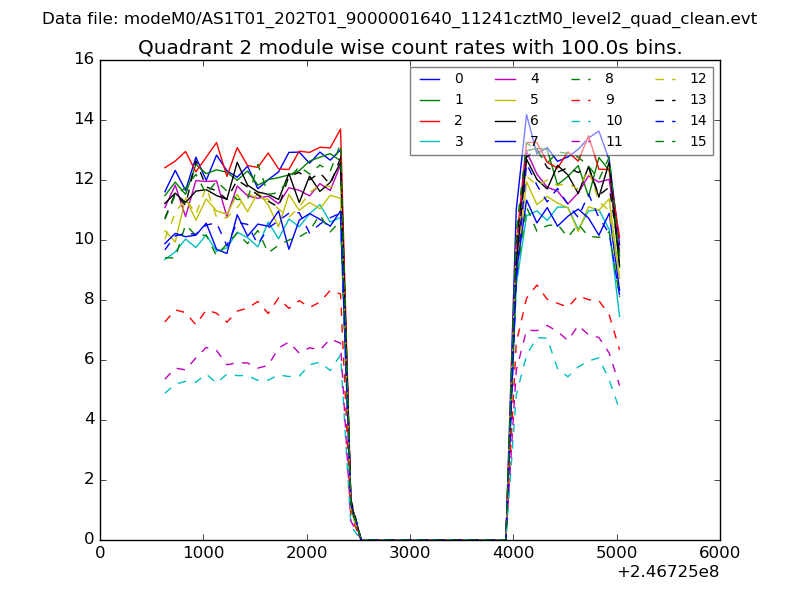
| Module-wise count rates for Quadrant B Data is divided into 100 sec bins |
 |
 |
| Module-wise count rates for Quadrant C Data is divided into 100 sec bins |
 |
 |
| Module-wise count rates for Quadrant D Data is divided into 100 sec bins |
 |
 |
| Parameter | Plot |
|---|---|
| CZT HV Monitor | 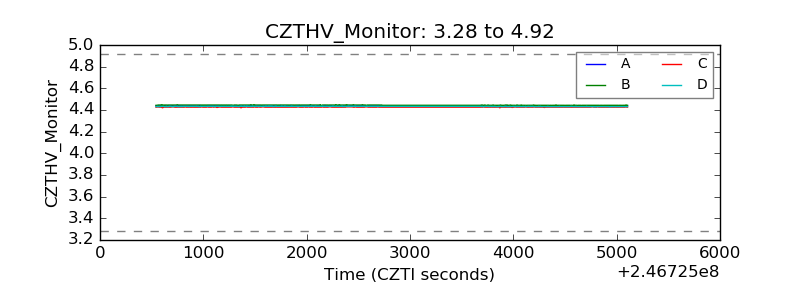 |
| D_VDD |  |
| Temperature 1 | 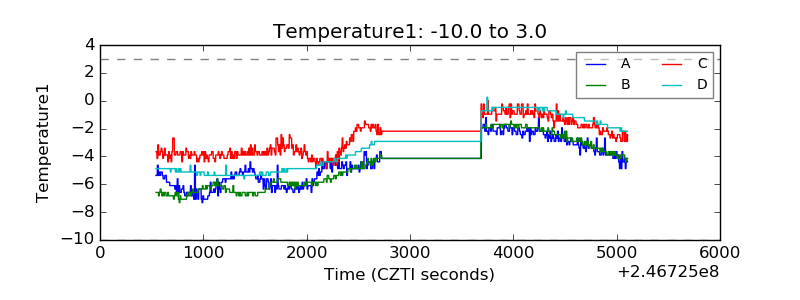 |
| Veto HV Monitor | 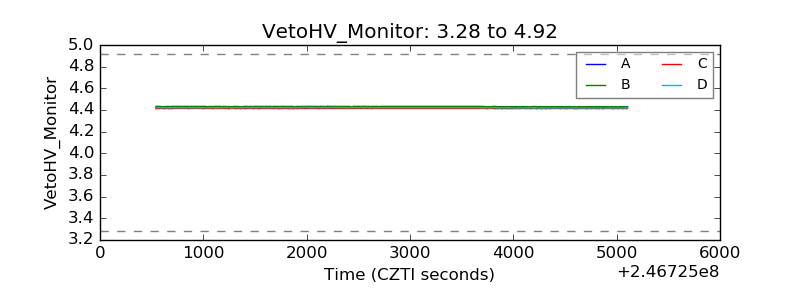 |
| Veto LLD | 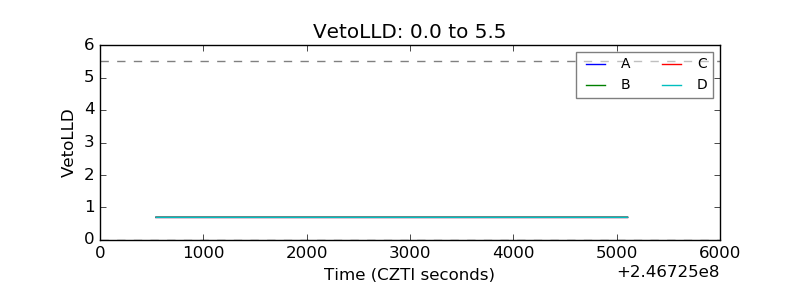 |
| Alpha Counter | 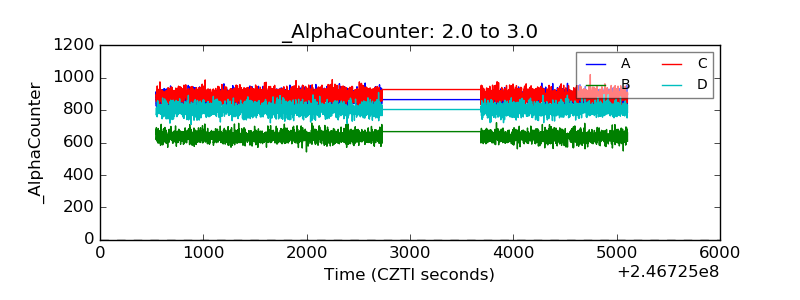 |
| _CPM_Rate | 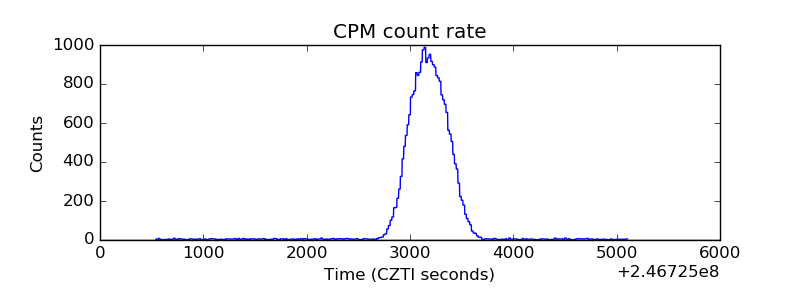 |
| CZT Counter | 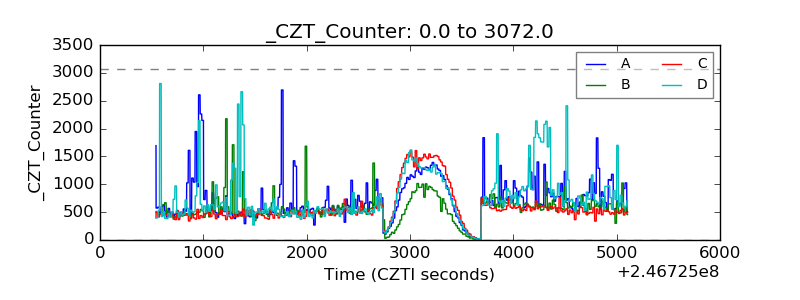 |
| +2.5 Volts monitor |  |
| +5 Volts monitor |  |
| _ROLL_ROT | 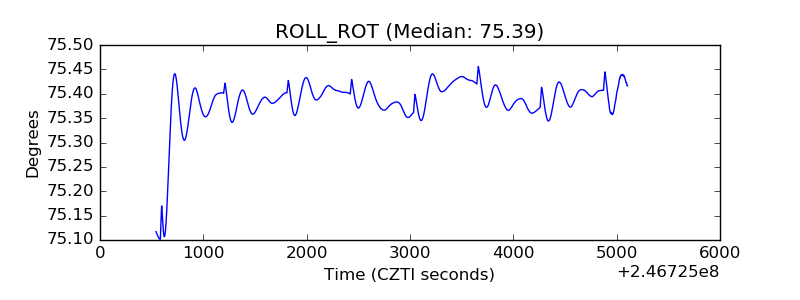 |
| _Roll_DEC | 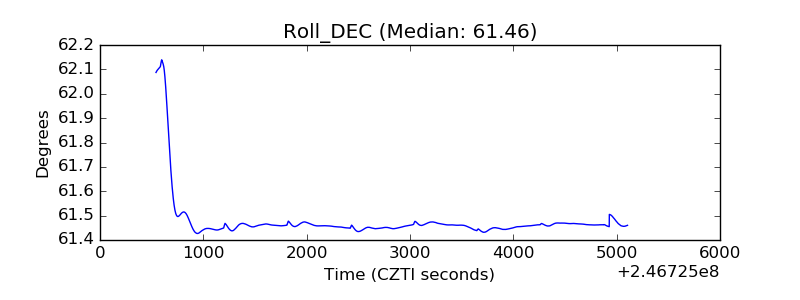 |
| _Roll_RA | 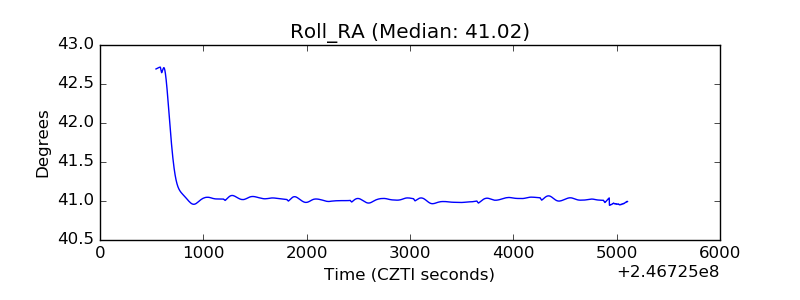 |
| Veto Counter | 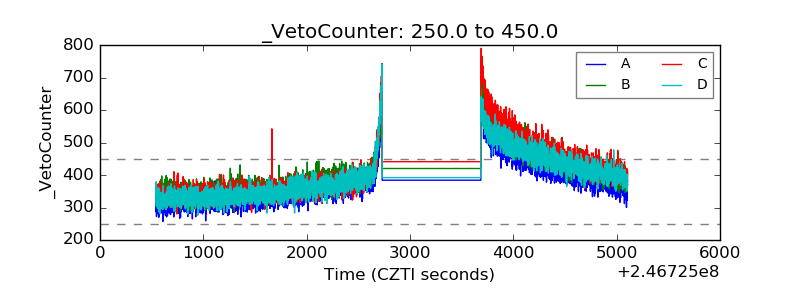 |