| Param | Original file | Final file |
|---|---|---|
| Filename | modeM0/AS1T01_202T01_9000001640_11243cztM0_level2.evt | modeM0/AS1T01_202T01_9000001640_11243cztM0_level2_quad_clean.evt |
| Size (bytes) | 548,925,120 | 127,946,880 |
| Size | 523.5 MB | 122.0 MB |
| Events in quadrant A | 5,595,997 | 837,650 |
| Events in quadrant B | 3,602,241 | 888,857 |
| Events in quadrant C | 2,892,697 | 910,040 |
| Events in quadrant D | 4,139,492 | 831,933 |
| Mode M9 | |||
|---|---|---|---|
| Quadrant | BADHDUFLAG | Total packets | Discarded packets |
| A | 0 | 11 | 0 |
| B | 0 | 11 | 0 |
| C | 0 | 11 | 0 |
| D | 0 | 11 | 0 |
| Mode M0 | |||
|---|---|---|---|
| Quadrant | BADHDUFLAG | Total packets | Discarded packets |
| A | 0 | 20771 | 2 |
| B | 0 | 14438 | 1 |
| C | 0 | 12324 | 1 |
| D | 0 | 16290 | 1 |
| Mode SS | |||
|---|---|---|---|
| Quadrant | BADHDUFLAG | Total packets | Discarded packets |
| A | 0 | 120 | 0 |
| B | 0 | 120 | 0 |
| C | 0 | 120 | 0 |
| D | 0 | 120 | 0 |
| Quadrant | Total seconds | Saturated seconds | Saturation percentage |
|---|---|---|---|
| A | 5812 | 666 | 11.459050% |
| B | 5812 | 187 | 3.217481% |
| C | 5812 | 15 | 0.258087% |
| D | 5812 | 103 | 1.772195% |
Noise dominated data is calculated using 1-second bins in cleaned event files. If a bin has >2000 counts, and if more than 50% of those come from <1% of pixels, then it is considered to be noise-dominated and hence unusable.
| Quadrant | # 1 sec bins | Bins with >0 counts | Bins with >2000 counts | High rate bins dominated by noise | Noise dominated (total time) | Noise dominated (detector-on time) | Marked lightcurve |
|---|---|---|---|---|---|---|---|
| A | 6927 | 5813 | 435 | 435 | 6.28% | 7.48% | 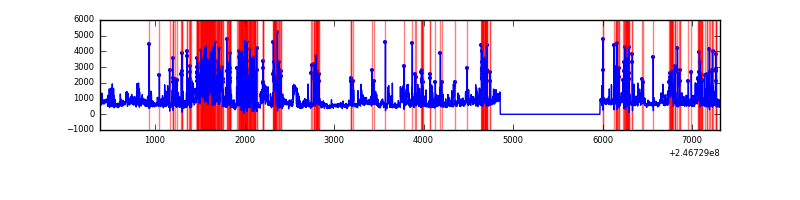 |
| B | 6927 | 5813 | 87 | 87 | 1.26% | 1.50% | 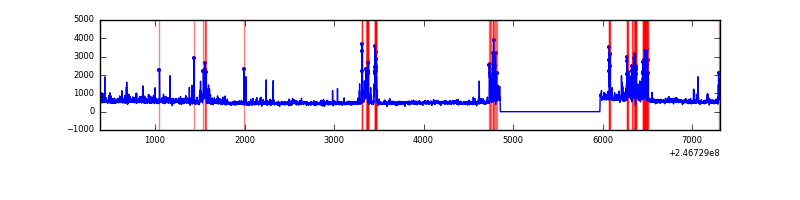 |
| C | 6927 | 5813 | 2 | 2 | 0.03% | 0.03% | 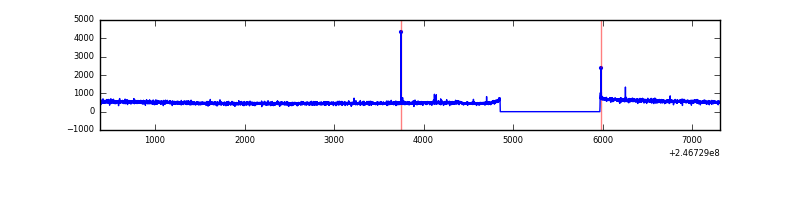 |
| D | 6927 | 5813 | 78 | 78 | 1.13% | 1.34% | 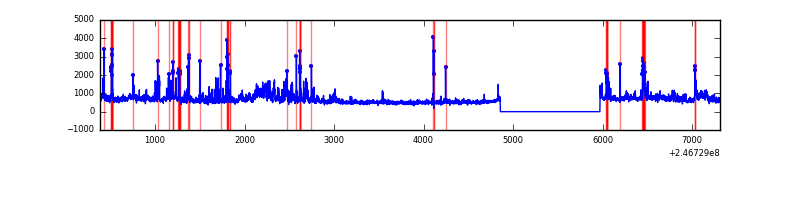 |
Top three noisy pixels from each quadrant. If the there are fewer than three noisy pixels in the level2.evt file, extra rows are filled as -1
| Pixel properties | Quadrant properties | ||||||
|---|---|---|---|---|---|---|---|
| Quadrant | DetID | PixID | Counts | Sigma | Mean | Median | Sigma |
| A | 8 | 5 | 2001788 | 12337.17 | 704 | 688 | 162.2 |
| A | 14 | 238 | 764900 | 4711.52 | 704 | 688 | 162.2 |
| A | 1 | 162 | 25418 | 152.47 | 704 | 688 | 162.2 |
| B | 4 | 239 | 513708 | 3366.37 | 739 | 725 | 152.4 |
| B | 11 | 51 | 99818 | 650.28 | 739 | 725 | 152.4 |
| B | 15 | 204 | 57791 | 374.49 | 739 | 725 | 152.4 |
| C | 14 | 234 | 6660 | 32.96 | 738 | 750 | 179.3 |
| C | 13 | 61 | 5267 | 25.19 | 738 | 750 | 179.3 |
| C | 0 | 10 | 4819 | 22.69 | 738 | 750 | 179.3 |
| D | 8 | 195 | 481085 | 2521.68 | 719 | 698 | 190.5 |
| D | 5 | 222 | 324397 | 1699.18 | 719 | 698 | 190.5 |
| D | 12 | 157 | 202921 | 1061.52 | 719 | 698 | 190.5 |
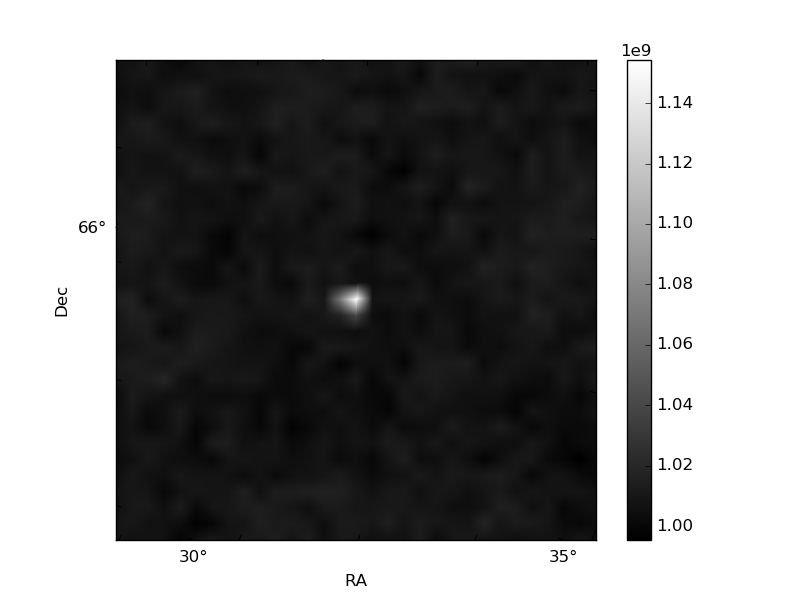
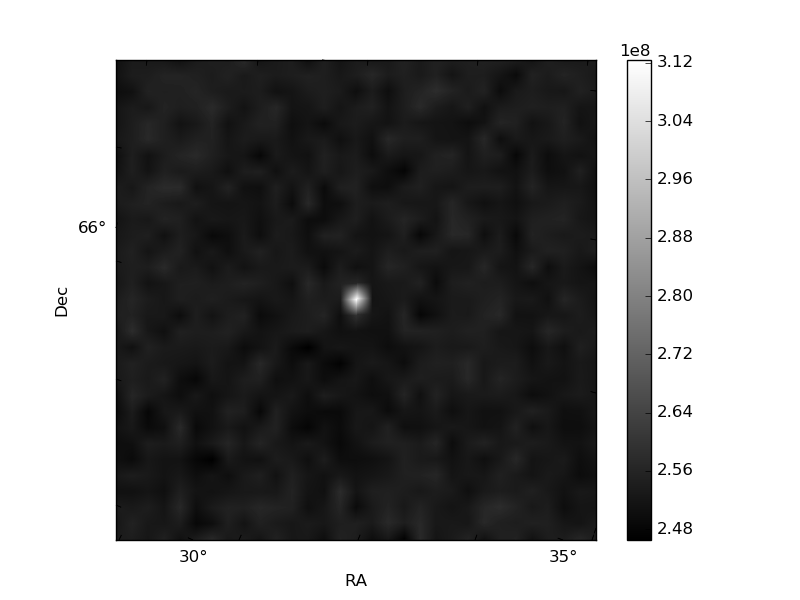
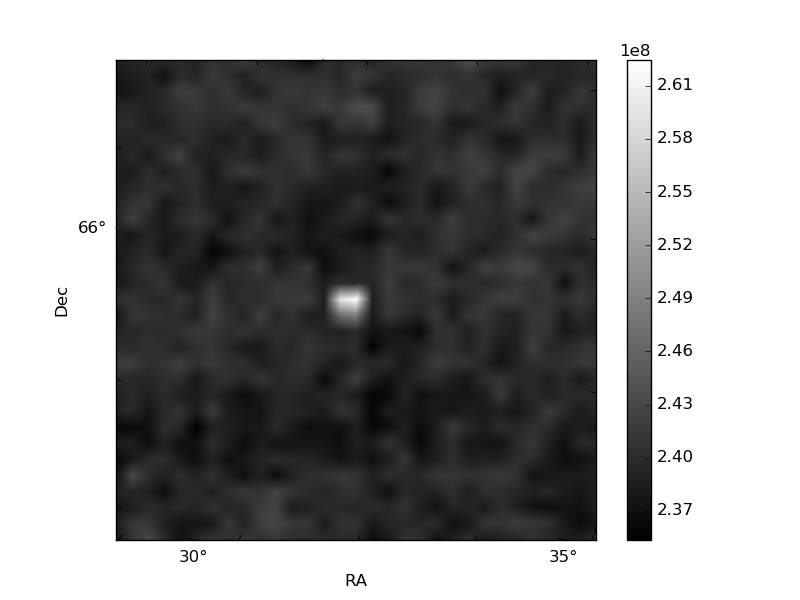
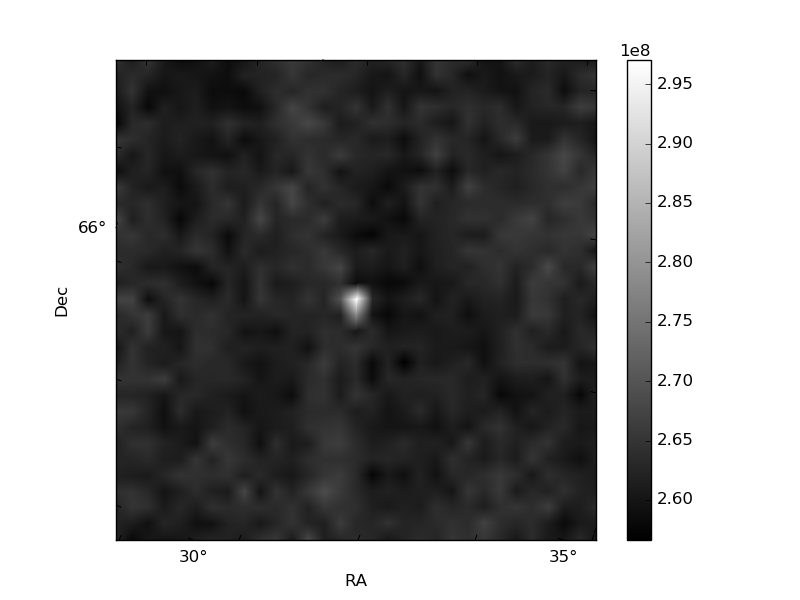
Histogram calculated using DETX and DETY for each event in the final _common_clean file
| Quadrant A | 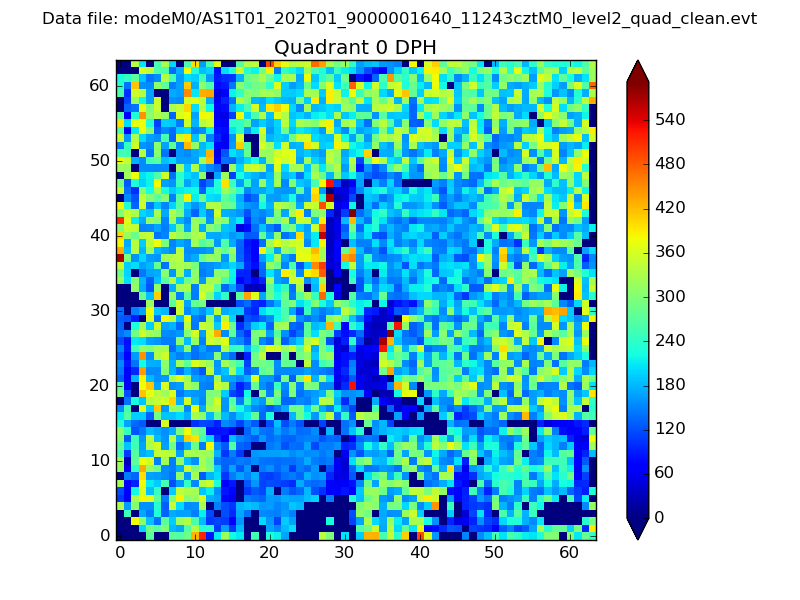 |
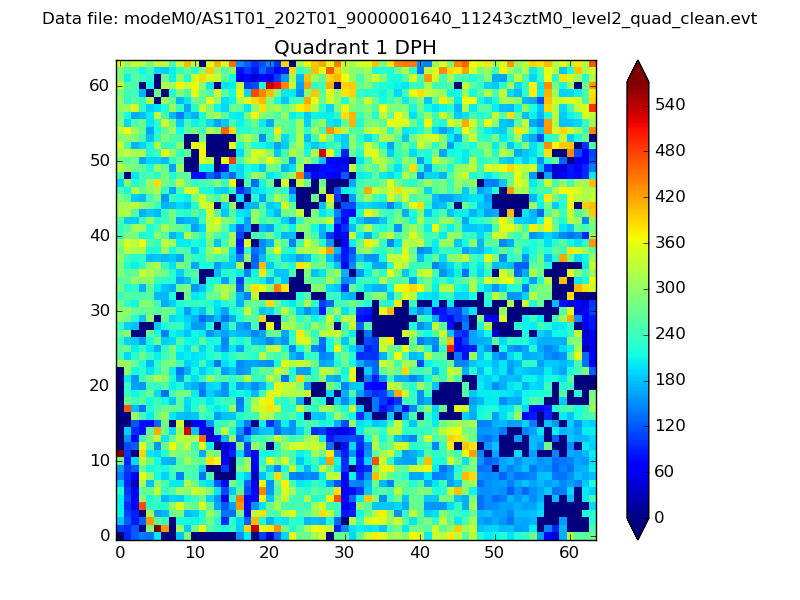 |
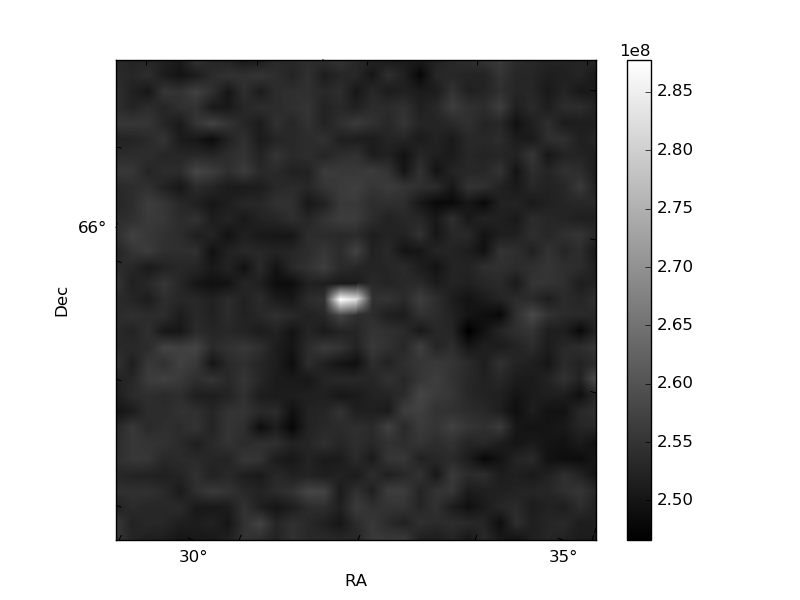
Quadrant B |
|---|---|---|---|
| Quadrant D | 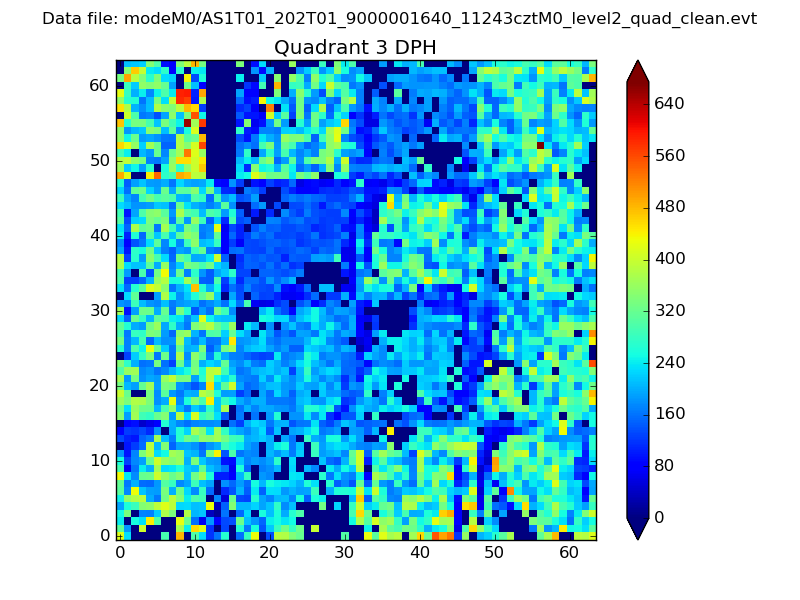 |
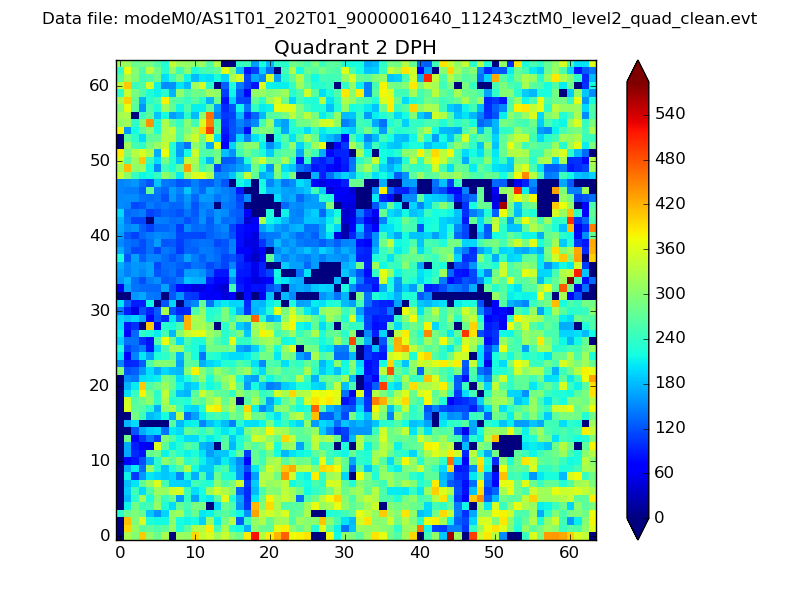 |
Quadrant C |
| Plot type | Count rate plots | Images |
|---|---|---|
| Comparison with Poisson distribution Blue bars denote a histogram of data divided into 1 sec bins. Red curve is a Poisson curve with rate = median count rate of data. |
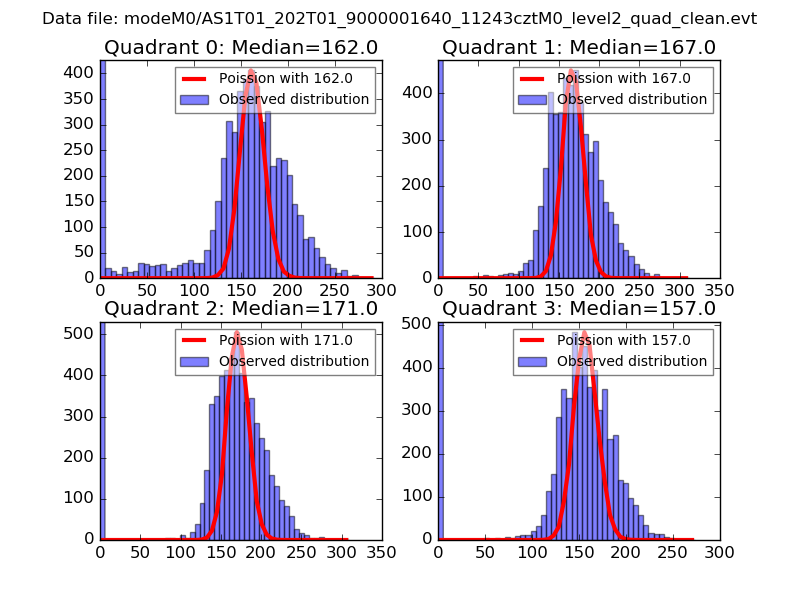 |
 |
| Quadrant-wise count rates Data is divided into 100 sec bins |
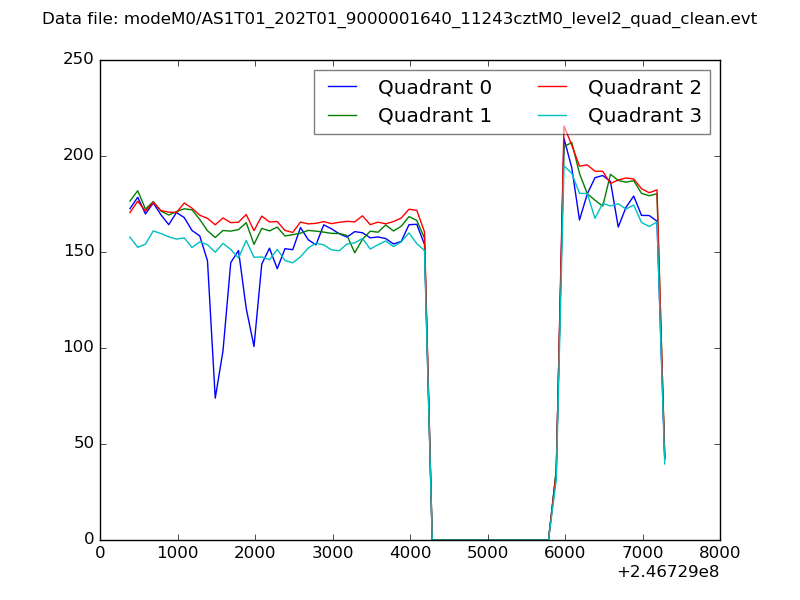 |
|
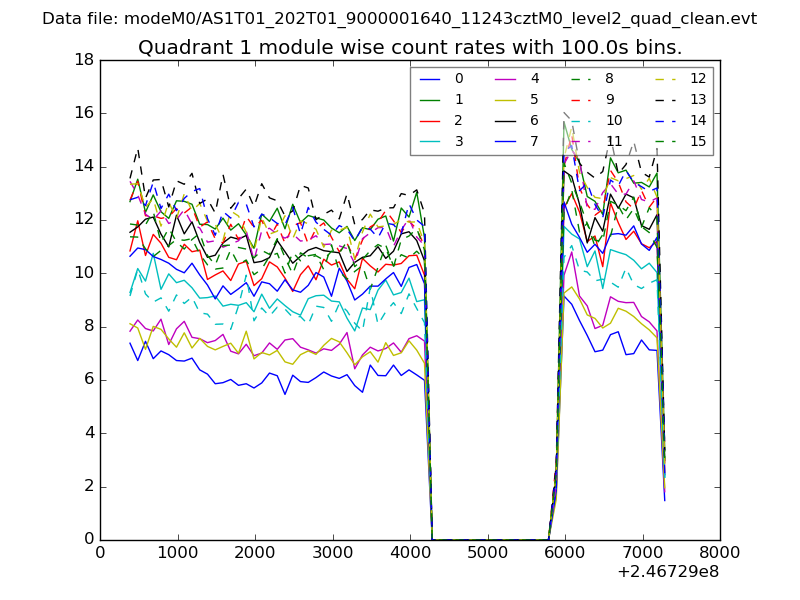
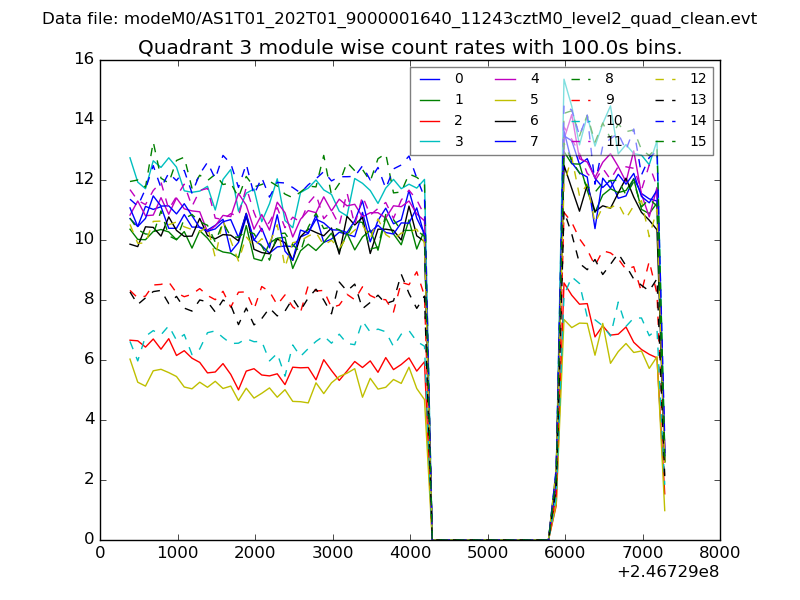
| Module-wise count rates for Quadrant A Data is divided into 100 sec bins |
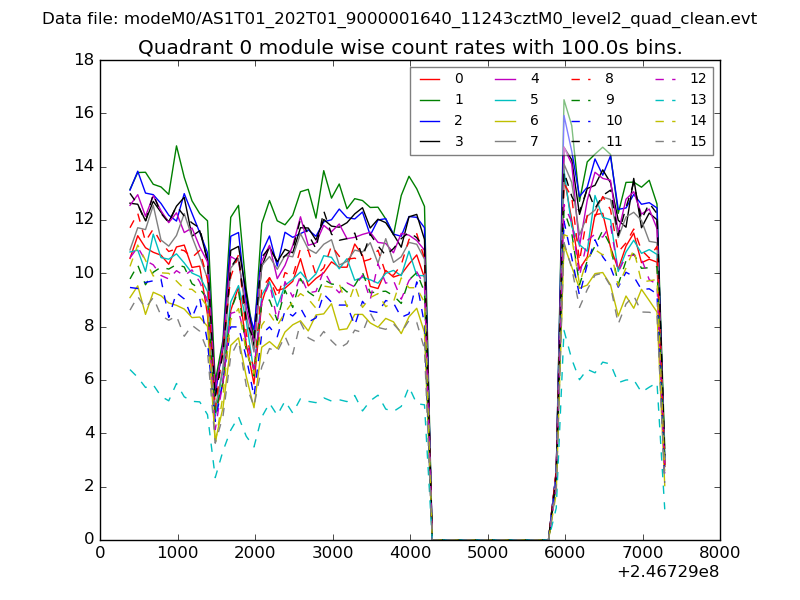 |
 |
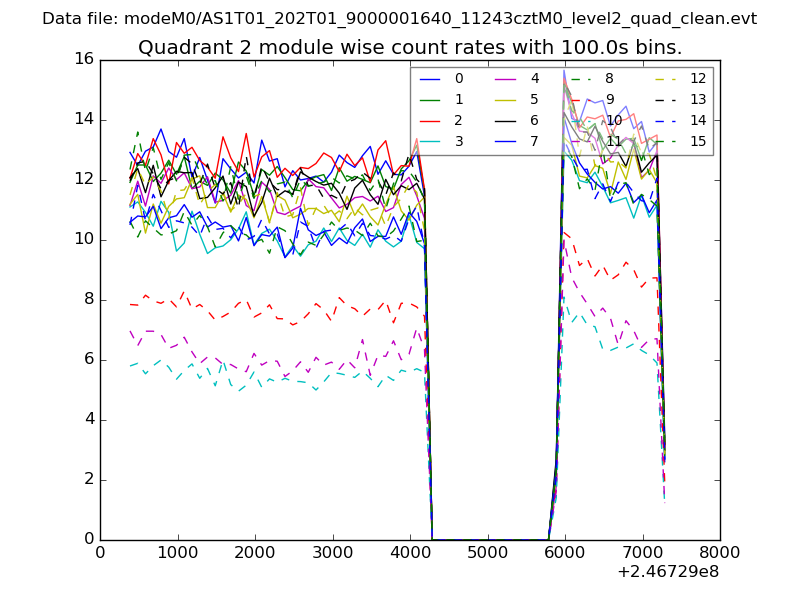
| Module-wise count rates for Quadrant B Data is divided into 100 sec bins |
 |
 |
| Module-wise count rates for Quadrant C Data is divided into 100 sec bins |
 |
 |
| Module-wise count rates for Quadrant D Data is divided into 100 sec bins |
 |
 |
| Parameter | Plot |
|---|---|
| CZT HV Monitor | 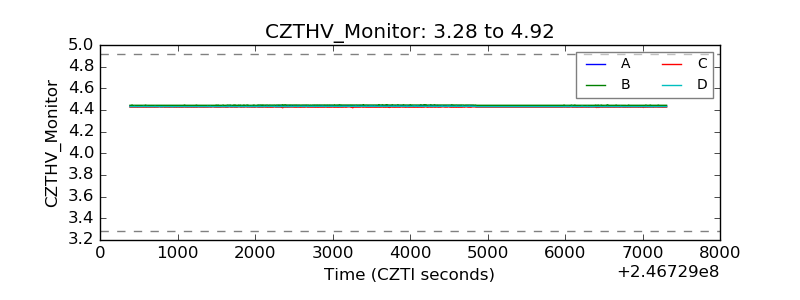 |
| D_VDD | 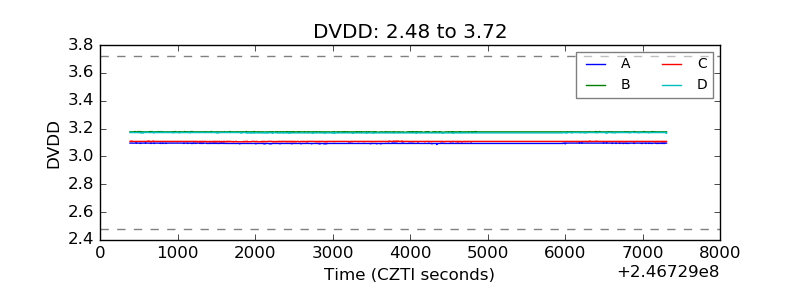 |
| Temperature 1 | 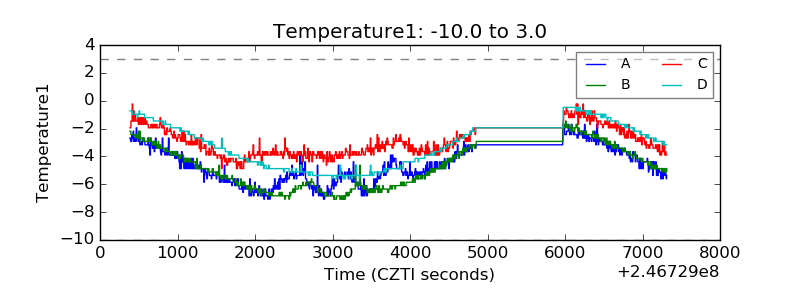 |
| Veto HV Monitor | 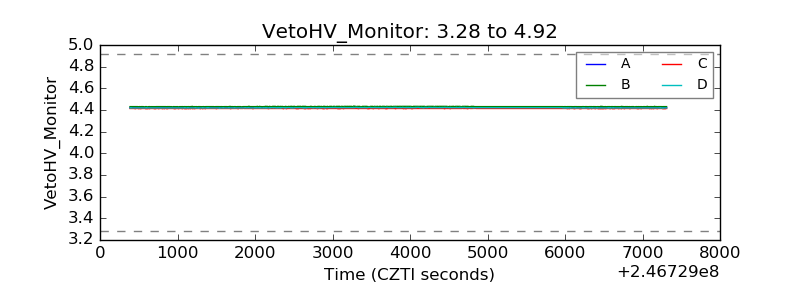 |
| Veto LLD | 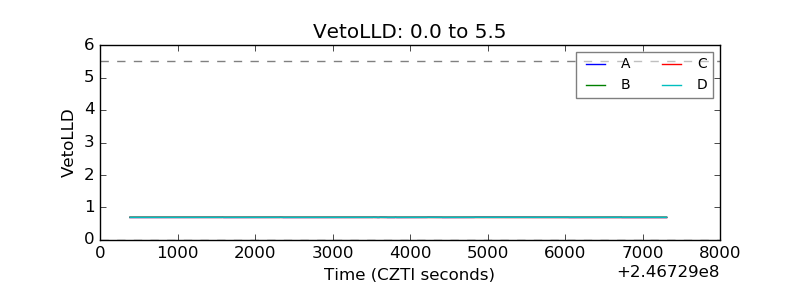 |
| Alpha Counter | 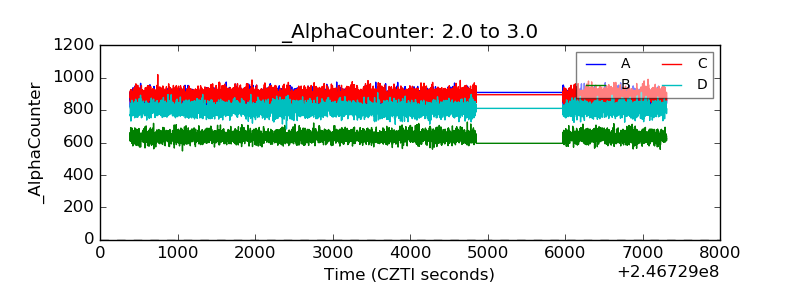 |
| _CPM_Rate | 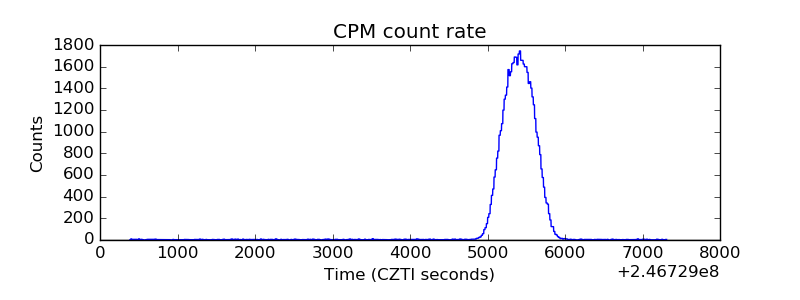 |
| CZT Counter | 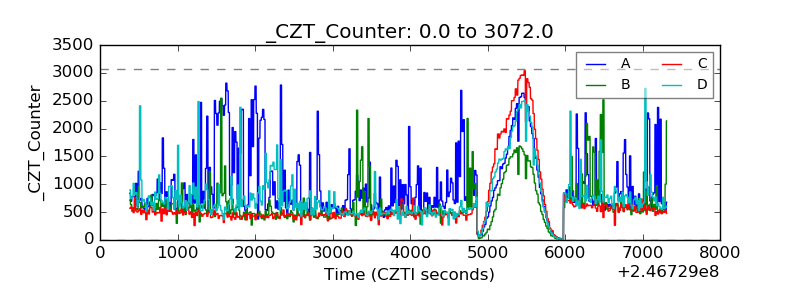 |
| +2.5 Volts monitor |  |
| +5 Volts monitor | 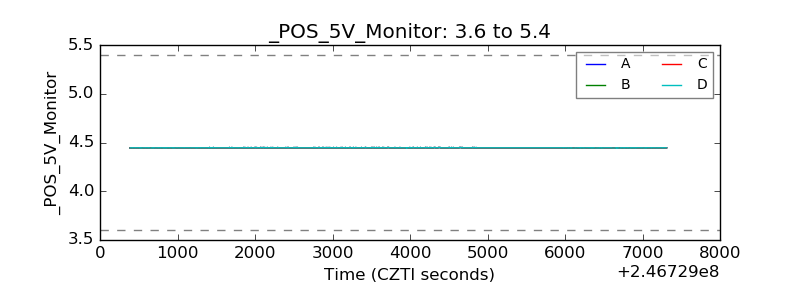 |
| _ROLL_ROT | 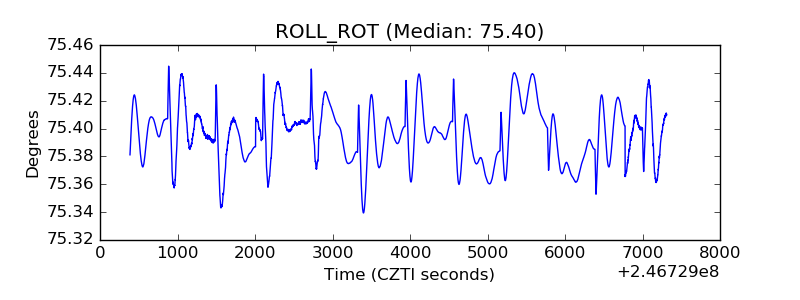 |
| _Roll_DEC | 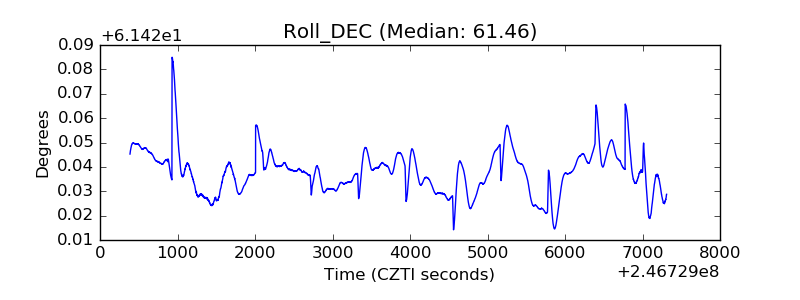 |
| _Roll_RA | 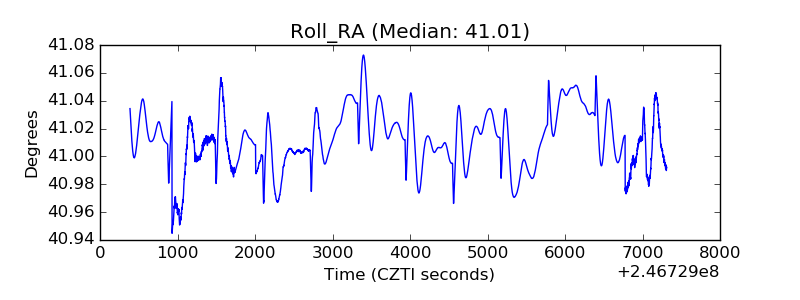 |
| Veto Counter | 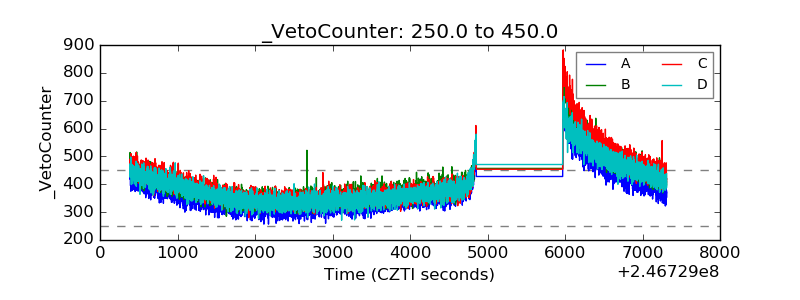 |