| Param | Original file | Final file |
|---|---|---|
| Filename | modeM0/AS1T01_202T01_9000001640_11244cztM0_level2.evt | modeM0/AS1T01_202T01_9000001640_11244cztM0_level2_quad_clean.evt |
| Size (bytes) | 512,582,400 | 115,678,080 |
| Size | 488.8 MB | 110.3 MB |
| Events in quadrant A | 5,127,273 | 753,739 |
| Events in quadrant B | 3,189,063 | 805,555 |
| Events in quadrant C | 2,719,464 | 821,456 |
| Events in quadrant D | 4,118,422 | 741,144 |
| Mode M9 | |||
|---|---|---|---|
| Quadrant | BADHDUFLAG | Total packets | Discarded packets |
| A | 0 | 12 | 0 |
| B | 0 | 12 | 0 |
| C | 0 | 12 | 0 |
| D | 0 | 12 | 0 |
| Mode M0 | |||
|---|---|---|---|
| Quadrant | BADHDUFLAG | Total packets | Discarded packets |
| A | 0 | 18973 | 2 |
| B | 0 | 12966 | 1 |
| C | 0 | 11628 | 1 |
| D | 0 | 16040 | 1 |
| Mode SS | |||
|---|---|---|---|
| Quadrant | BADHDUFLAG | Total packets | Discarded packets |
| A | 0 | 110 | 0 |
| B | 0 | 110 | 0 |
| C | 0 | 110 | 0 |
| D | 0 | 110 | 0 |
| Quadrant | Total seconds | Saturated seconds | Saturation percentage |
|---|---|---|---|
| A | 5453 | 588 | 10.783055% |
| B | 5453 | 143 | 2.622410% |
| C | 5453 | 33 | 0.605171% |
| D | 5453 | 177 | 3.245920% |
Noise dominated data is calculated using 1-second bins in cleaned event files. If a bin has >2000 counts, and if more than 50% of those come from <1% of pixels, then it is considered to be noise-dominated and hence unusable.
| Quadrant | # 1 sec bins | Bins with >0 counts | Bins with >2000 counts | High rate bins dominated by noise | Noise dominated (total time) | Noise dominated (detector-on time) | Marked lightcurve |
|---|---|---|---|---|---|---|---|
| A | 6623 | 5454 | 419 | 419 | 6.33% | 7.68% | 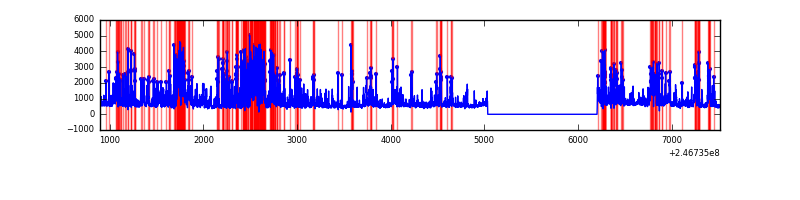 |
| B | 6623 | 5454 | 58 | 58 | 0.88% | 1.06% | 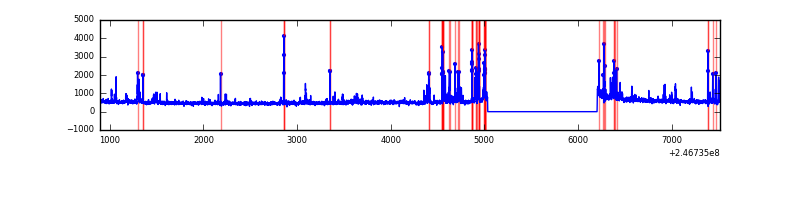 |
| C | 6623 | 5454 | 2 | 2 | 0.03% | 0.04% | 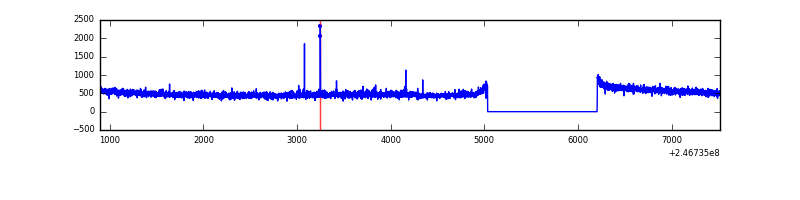 |
| D | 6623 | 5454 | 118 | 118 | 1.78% | 2.16% | 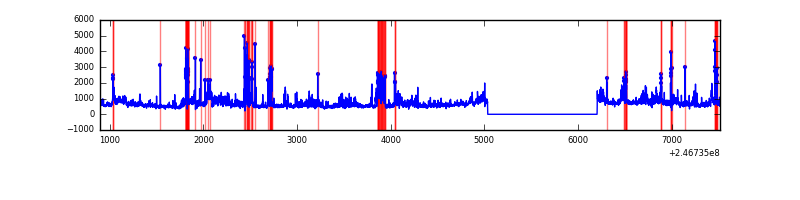 |
Top three noisy pixels from each quadrant. If the there are fewer than three noisy pixels in the level2.evt file, extra rows are filled as -1
| Pixel properties | Quadrant properties | ||||||
|---|---|---|---|---|---|---|---|
| Quadrant | DetID | PixID | Counts | Sigma | Mean | Median | Sigma |
| A | 8 | 5 | 1901220 | 12341.89 | 671 | 654 | 154.0 |
| A | 14 | 238 | 400323 | 2595.37 | 671 | 654 | 154.0 |
| A | 12 | 146 | 139994 | 904.85 | 671 | 654 | 154.0 |
| B | 4 | 239 | 354843 | 2518.56 | 697 | 684 | 140.6 |
| B | 15 | 204 | 38622 | 269.79 | 697 | 684 | 140.6 |
| B | 11 | 51 | 23932 | 165.33 | 697 | 684 | 140.6 |
| C | 4 | 254 | 12966 | 73.59 | 694 | 704 | 166.6 |
| C | 13 | 61 | 5169 | 26.79 | 694 | 704 | 166.6 |
| C | 12 | 4 | 2300 | 9.58 | 694 | 704 | 166.6 |
| D | 12 | 157 | 645709 | 3691.6 | 672 | 653 | 174.7 |
| D | 8 | 195 | 348021 | 1987.95 | 672 | 653 | 174.7 |
| D | 10 | 253 | 228037 | 1301.3 | 672 | 653 | 174.7 |
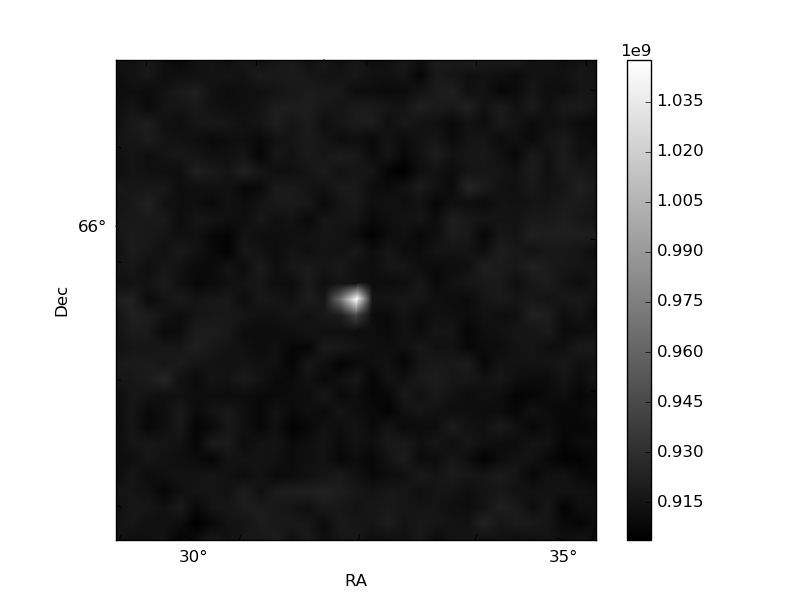
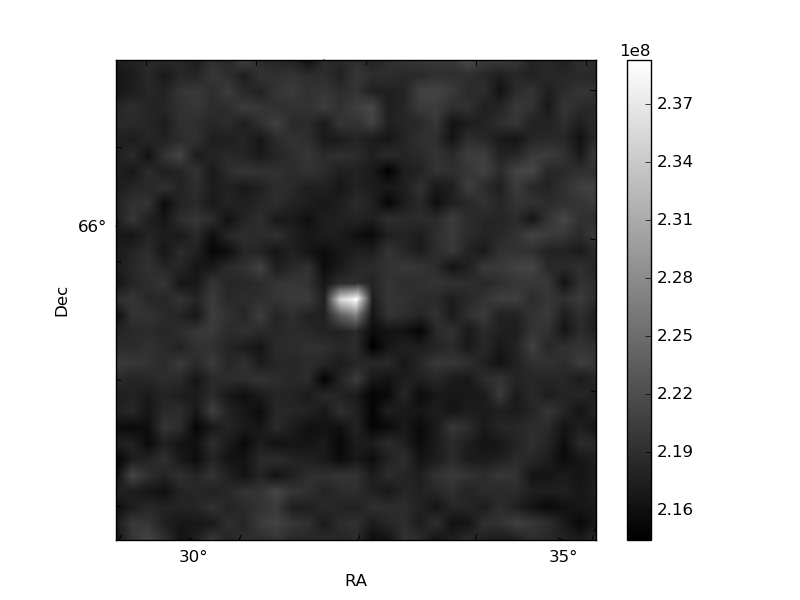
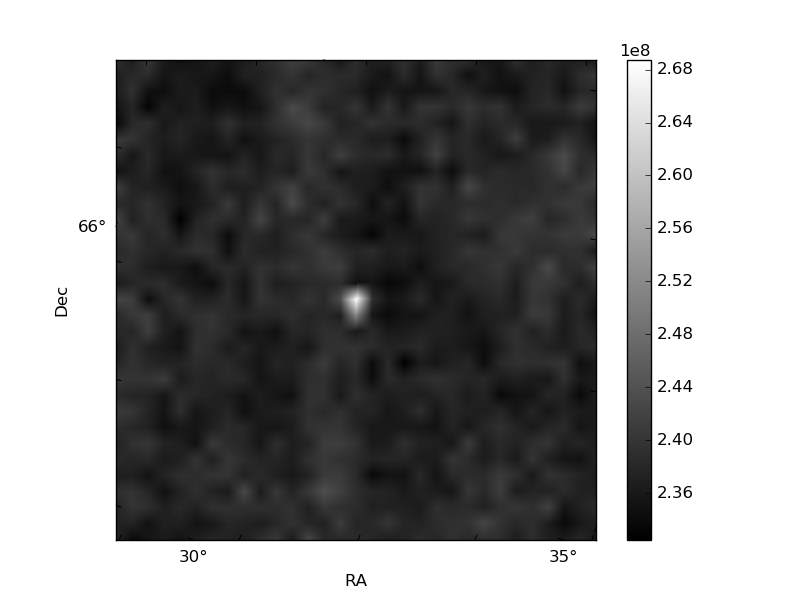
Histogram calculated using DETX and DETY for each event in the final _common_clean file
| Quadrant A | 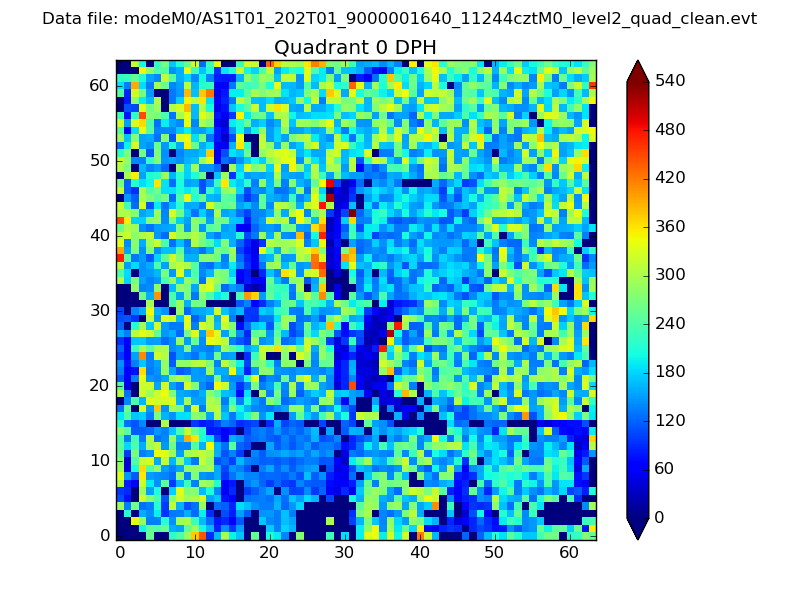 |
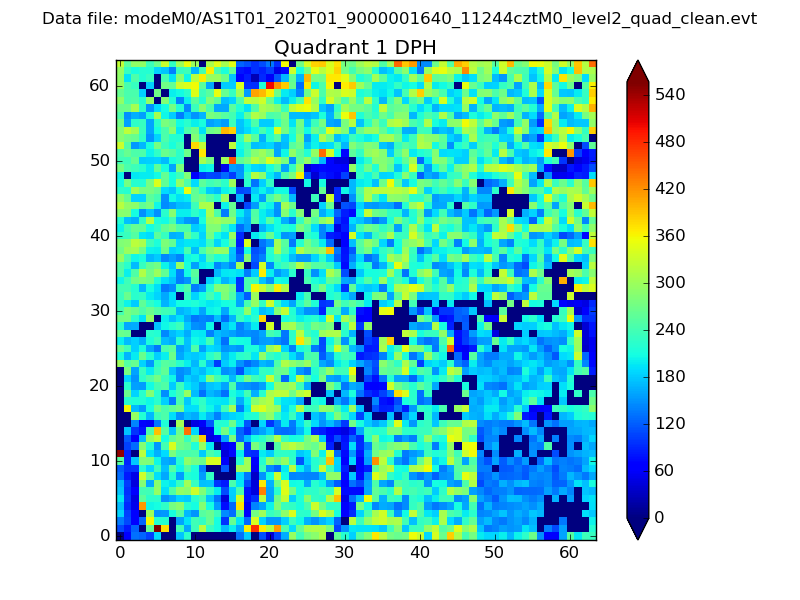 |
Quadrant B |
|---|---|---|---|
| Quadrant D | 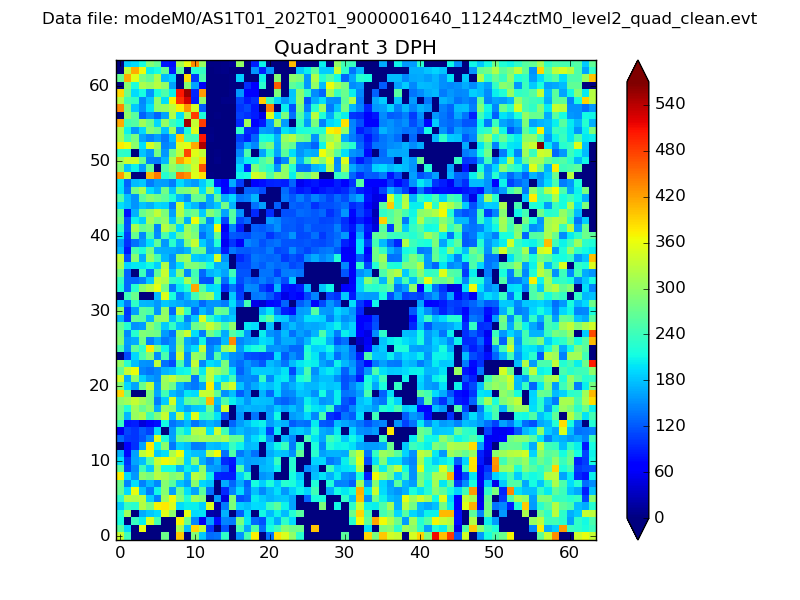 |
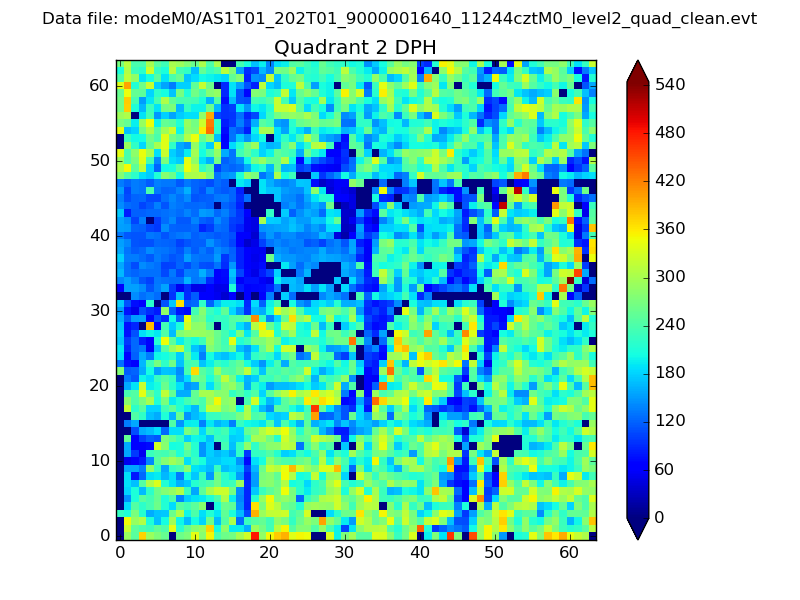 |
Quadrant C |
| Plot type | Count rate plots | Images |
|---|---|---|
| Comparison with Poisson distribution Blue bars denote a histogram of data divided into 1 sec bins. Red curve is a Poisson curve with rate = median count rate of data. |
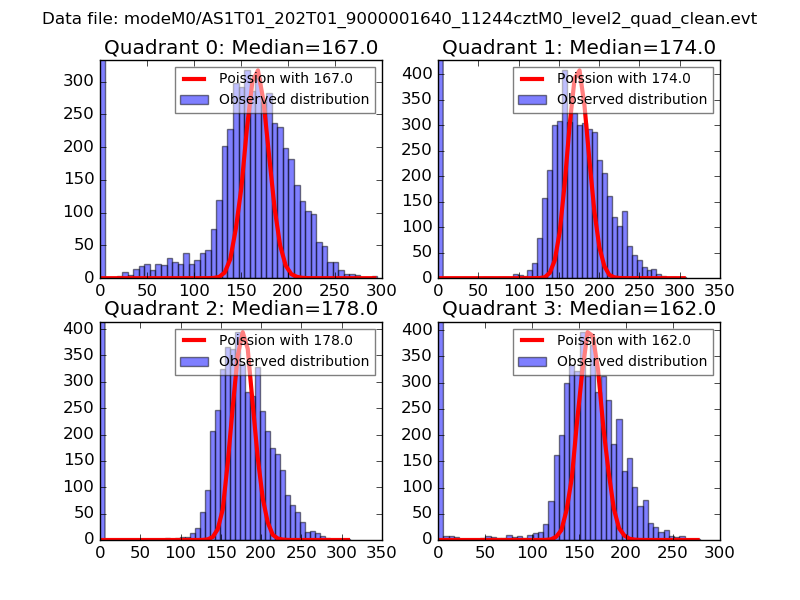 |
 |
| Quadrant-wise count rates Data is divided into 100 sec bins |
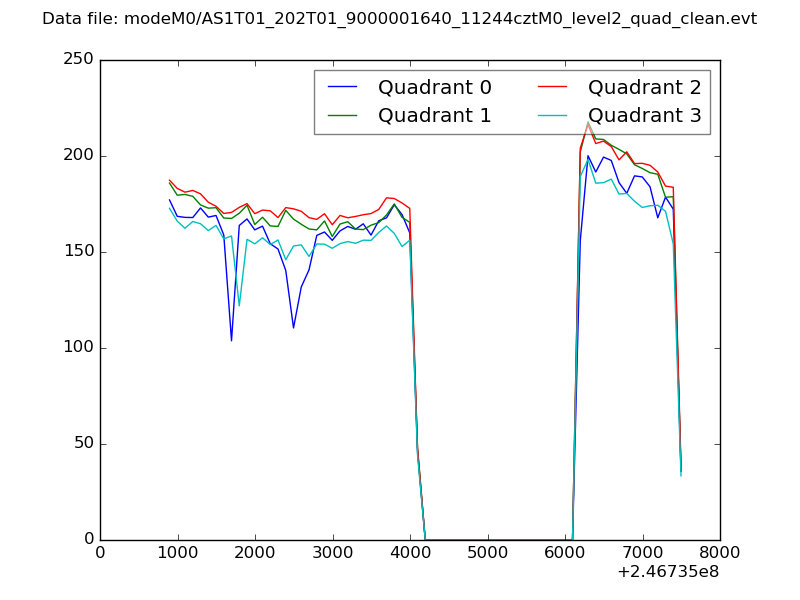 |
|
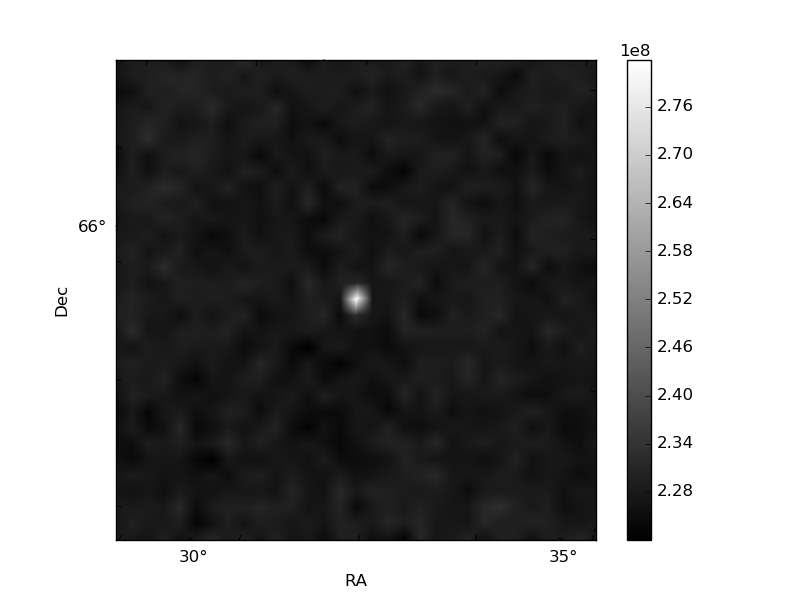
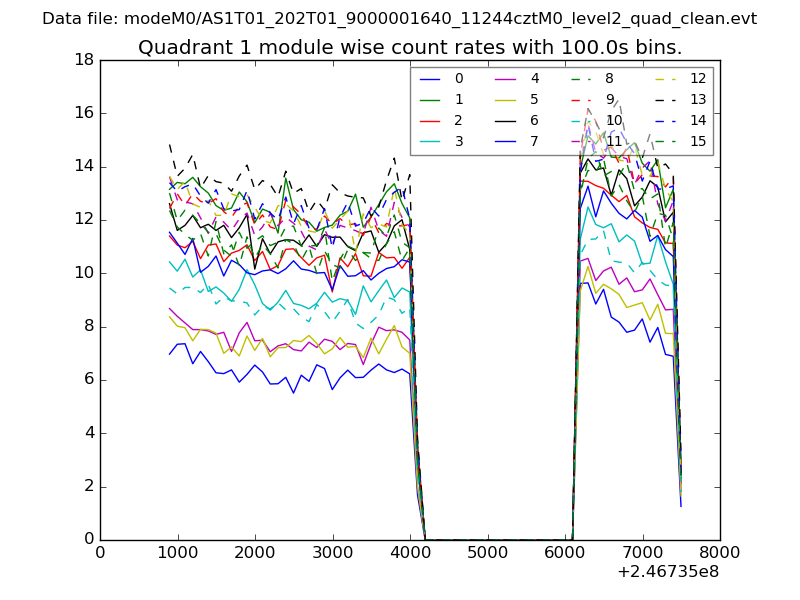
| Module-wise count rates for Quadrant A Data is divided into 100 sec bins |
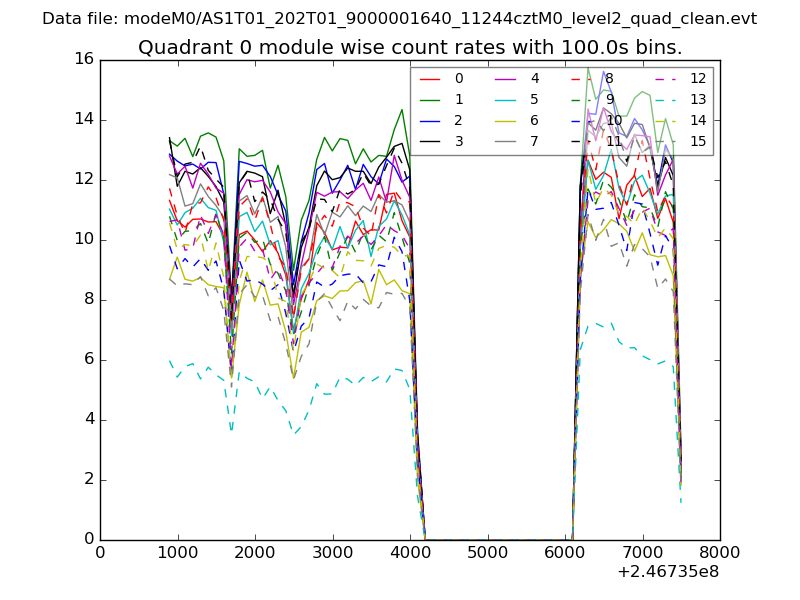 |
 |
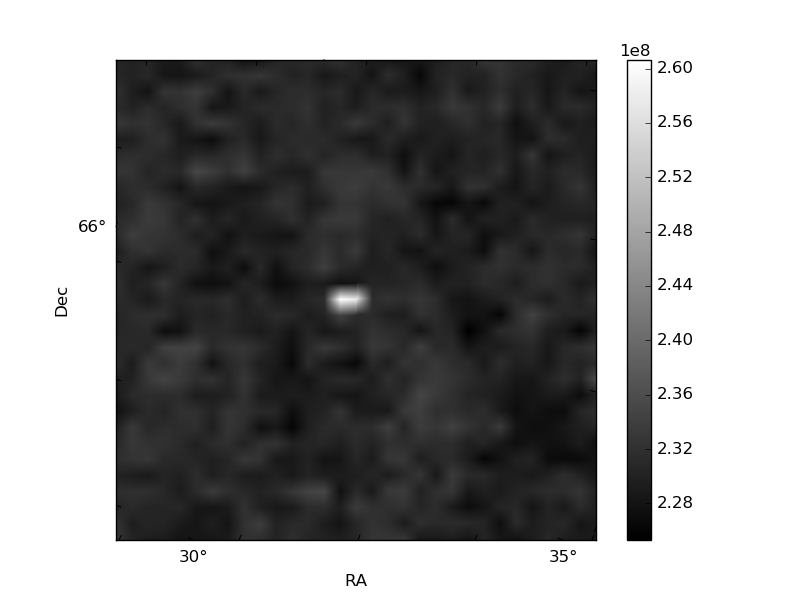
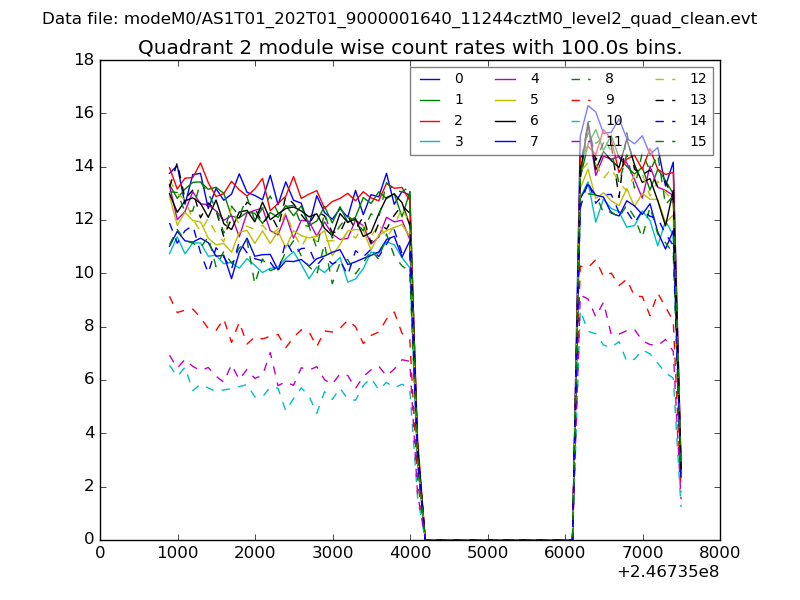
| Module-wise count rates for Quadrant B Data is divided into 100 sec bins |
 |
 |
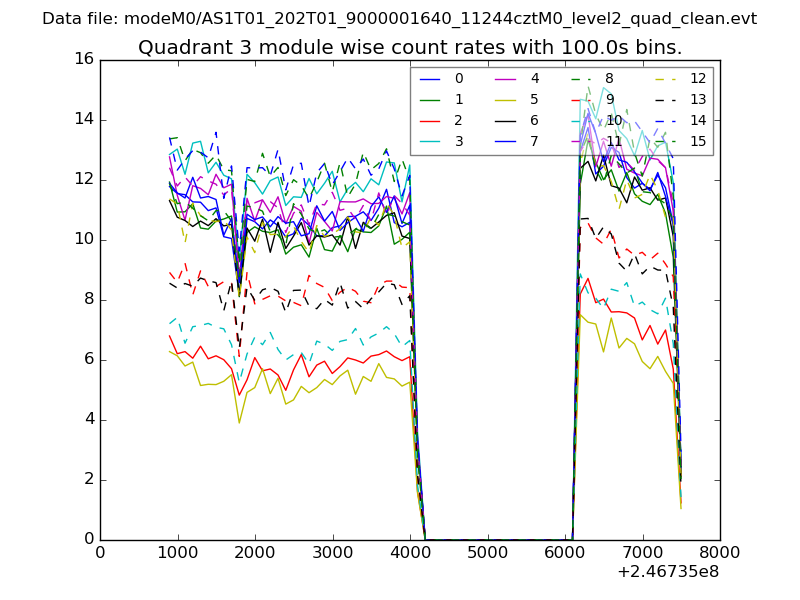
| Module-wise count rates for Quadrant C Data is divided into 100 sec bins |
 |
 |
| Module-wise count rates for Quadrant D Data is divided into 100 sec bins |
 |
 |
| Parameter | Plot |
|---|---|
| CZT HV Monitor | 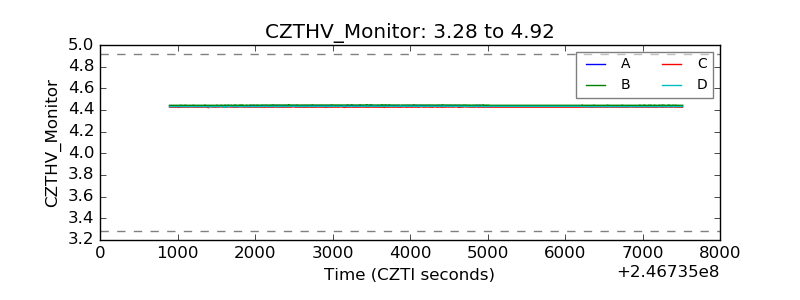 |
| D_VDD | 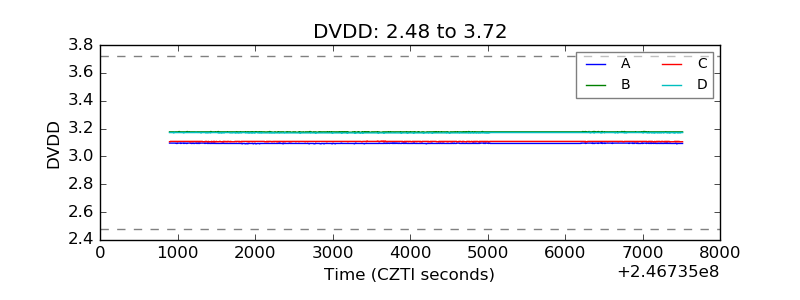 |
| Temperature 1 | 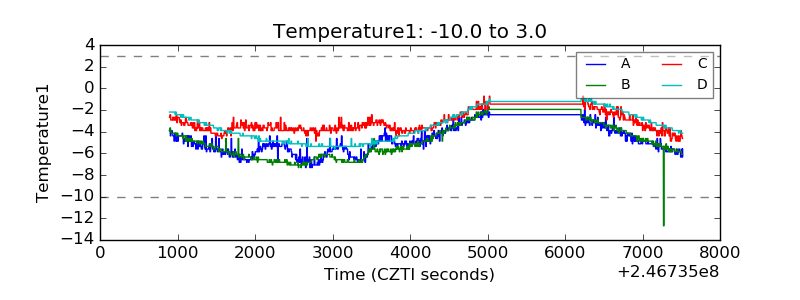 |
| Veto HV Monitor | 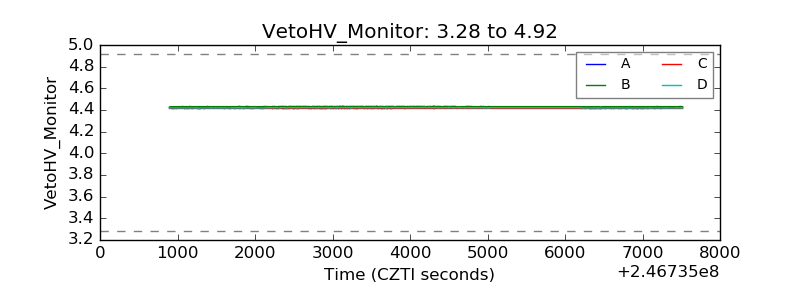 |
| Veto LLD | 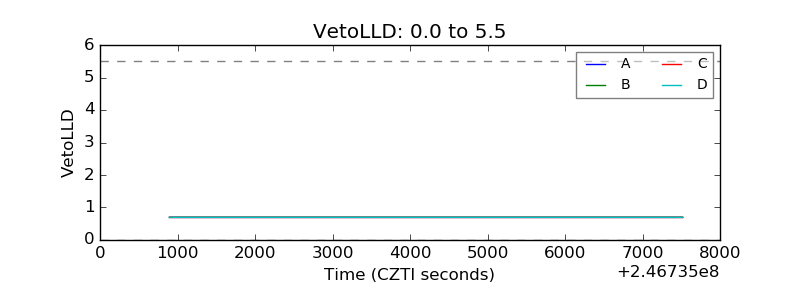 |
| Alpha Counter | 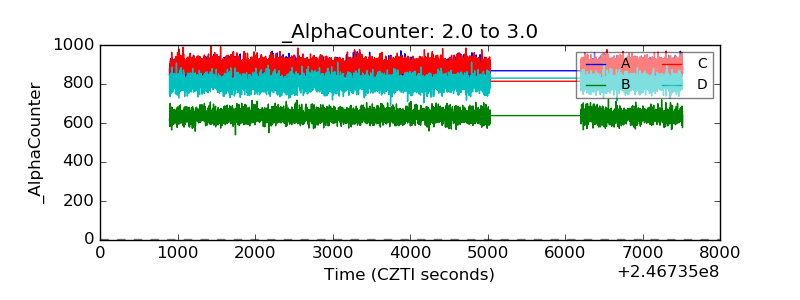 |
| _CPM_Rate | 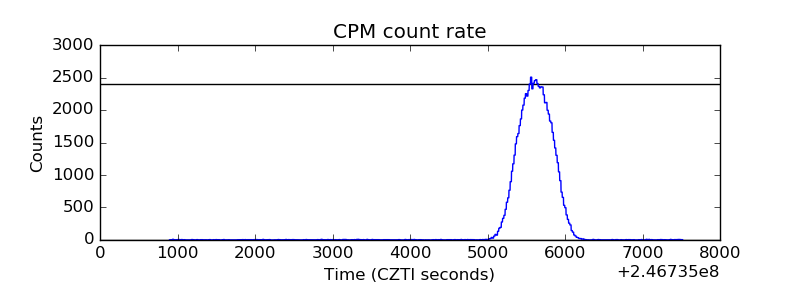 |
| CZT Counter | 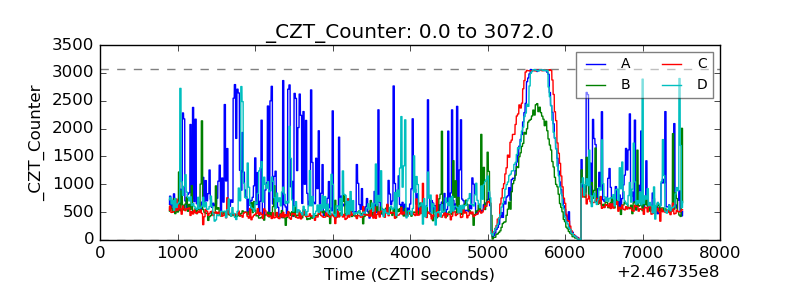 |
| +2.5 Volts monitor |  |
| +5 Volts monitor | 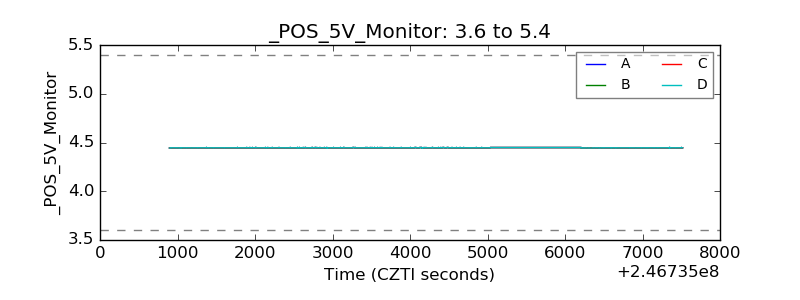 |
| _ROLL_ROT | 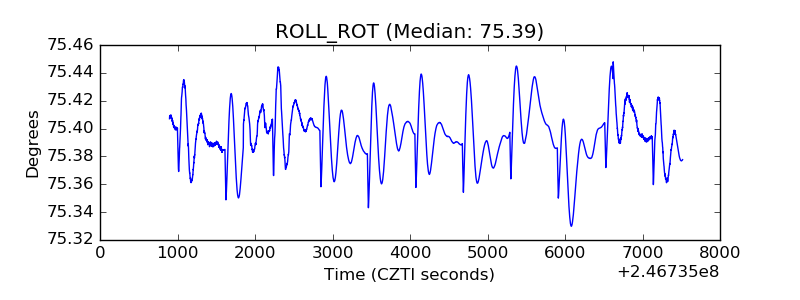 |
| _Roll_DEC | 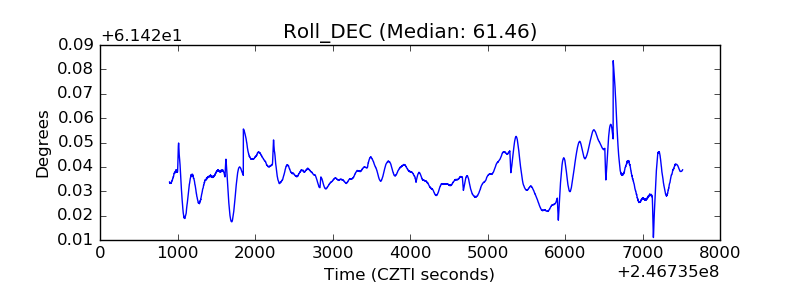 |
| _Roll_RA | 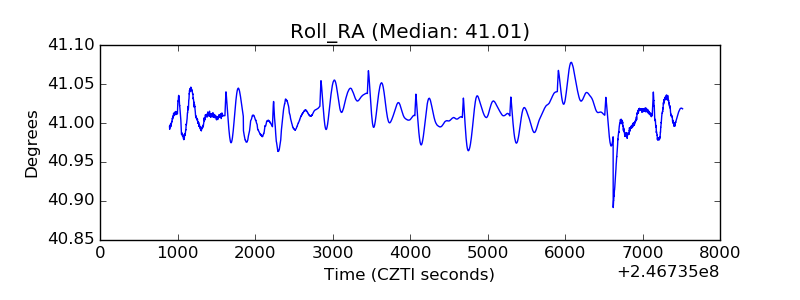 |
| Veto Counter | 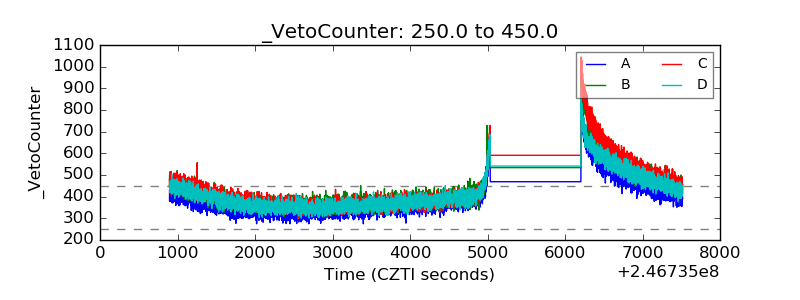 |