| Param | Original file | Final file |
|---|---|---|
| Filename | modeM0/AS1T01_202T01_9000001640_11245cztM0_level2.evt | modeM0/AS1T01_202T01_9000001640_11245cztM0_level2_quad_clean.evt |
| Size (bytes) | 486,034,560 | 119,335,680 |
| Size | 463.5 MB | 113.8 MB |
| Events in quadrant A | 3,641,219 | 804,839 |
| Events in quadrant B | 3,798,275 | 809,594 |
| Events in quadrant C | 2,890,000 | 839,569 |
| Events in quadrant D | 4,000,089 | 758,305 |
| Mode M9 | |||
|---|---|---|---|
| Quadrant | BADHDUFLAG | Total packets | Discarded packets |
| A | 0 | 12 | 0 |
| B | 0 | 12 | 0 |
| C | 0 | 12 | 0 |
| D | 0 | 12 | 0 |
| Mode M0 | |||
|---|---|---|---|
| Quadrant | BADHDUFLAG | Total packets | Discarded packets |
| A | 0 | 14575 | 2 |
| B | 0 | 14931 | 1 |
| C | 0 | 12228 | 1 |
| D | 0 | 15683 | 1 |
| Mode SS | |||
|---|---|---|---|
| Quadrant | BADHDUFLAG | Total packets | Discarded packets |
| A | 0 | 118 | 0 |
| B | 0 | 118 | 0 |
| C | 0 | 118 | 0 |
| D | 0 | 118 | 0 |
| Quadrant | Total seconds | Saturated seconds | Saturation percentage |
|---|---|---|---|
| A | 5749 | 127 | 2.209080% |
| B | 5749 | 235 | 4.087667% |
| C | 5749 | 22 | 0.382675% |
| D | 5749 | 123 | 2.139503% |
Noise dominated data is calculated using 1-second bins in cleaned event files. If a bin has >2000 counts, and if more than 50% of those come from <1% of pixels, then it is considered to be noise-dominated and hence unusable.
| Quadrant | # 1 sec bins | Bins with >0 counts | Bins with >2000 counts | High rate bins dominated by noise | Noise dominated (total time) | Noise dominated (detector-on time) | Marked lightcurve |
|---|---|---|---|---|---|---|---|
| A | 7024 | 5750 | 75 | 75 | 1.07% | 1.30% | 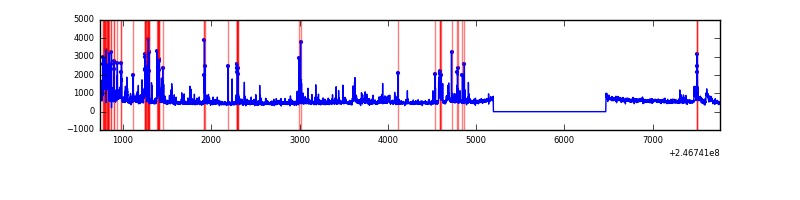 |
| B | 7024 | 5750 | 129 | 129 | 1.84% | 2.24% | 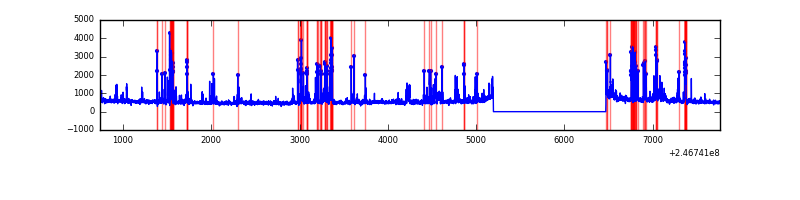 |
| C | 7024 | 5750 | 1 | 1 | 0.01% | 0.02% | 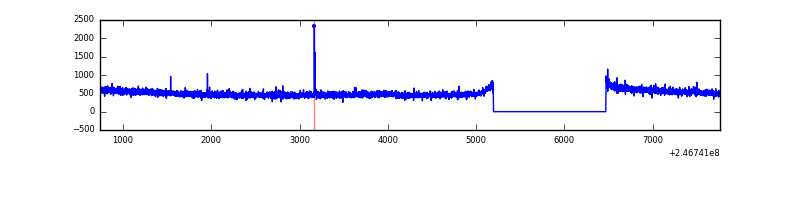 |
| D | 7024 | 5750 | 78 | 78 | 1.11% | 1.36% | 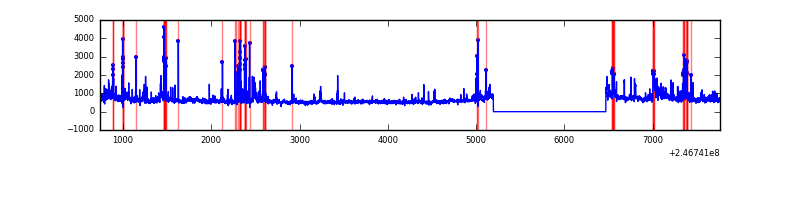 |
Top three noisy pixels from each quadrant. If the there are fewer than three noisy pixels in the level2.evt file, extra rows are filled as -1
| Pixel properties | Quadrant properties | ||||||
|---|---|---|---|---|---|---|---|
| Quadrant | DetID | PixID | Counts | Sigma | Mean | Median | Sigma |
| A | 8 | 5 | 496820 | 3001.81 | 731 | 716 | 165.3 |
| A | 14 | 238 | 171607 | 1034.02 | 731 | 716 | 165.3 |
| A | 15 | 174 | 67058 | 401.42 | 731 | 716 | 165.3 |
| B | 4 | 239 | 642436 | 4411.51 | 737 | 726 | 145.5 |
| B | 10 | 114 | 145654 | 996.32 | 737 | 726 | 145.5 |
| B | 11 | 51 | 37785 | 254.77 | 737 | 726 | 145.5 |
| C | 5 | 128 | 7455 | 38.19 | 738 | 750 | 175.5 |
| C | 4 | 254 | 6465 | 32.55 | 738 | 750 | 175.5 |
| C | 13 | 61 | 5347 | 26.18 | 738 | 750 | 175.5 |
| D | 8 | 195 | 564674 | 3079.85 | 713 | 693 | 183.1 |
| D | 12 | 157 | 228921 | 1246.33 | 713 | 693 | 183.1 |
| D | 10 | 253 | 146326 | 795.29 | 713 | 693 | 183.1 |
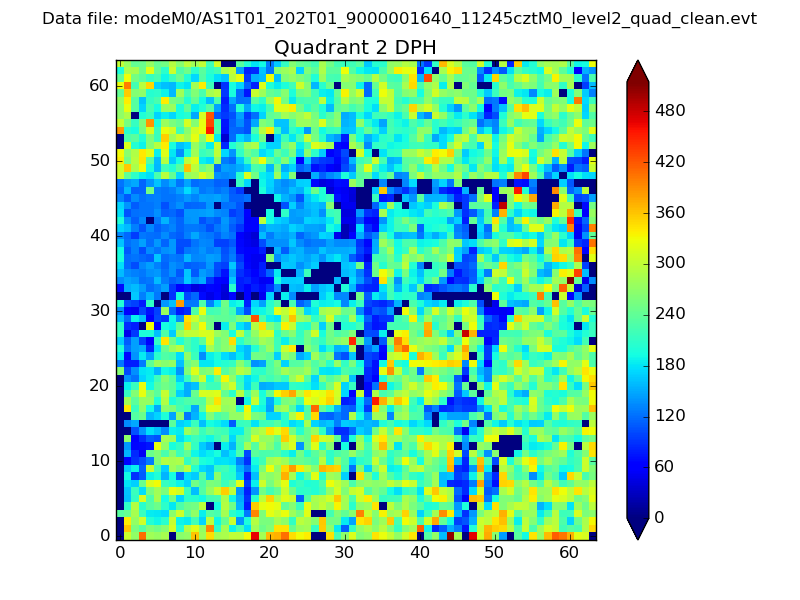
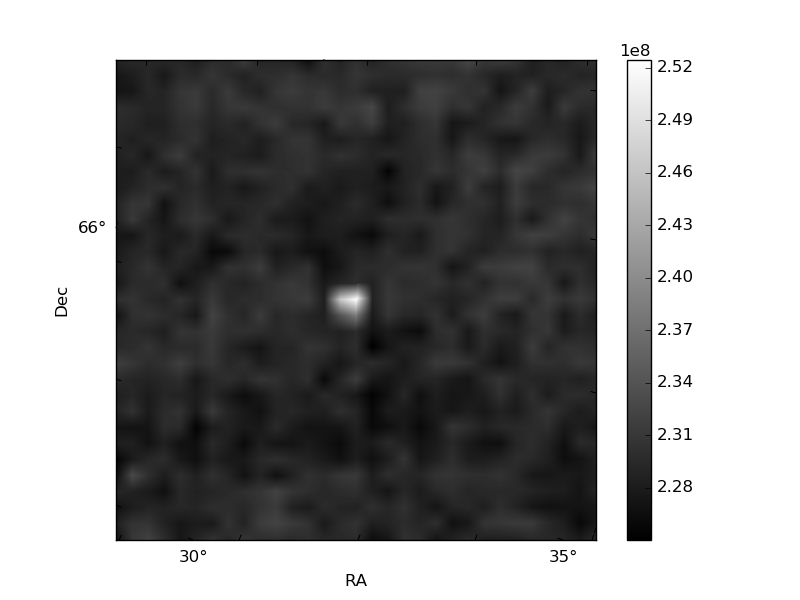
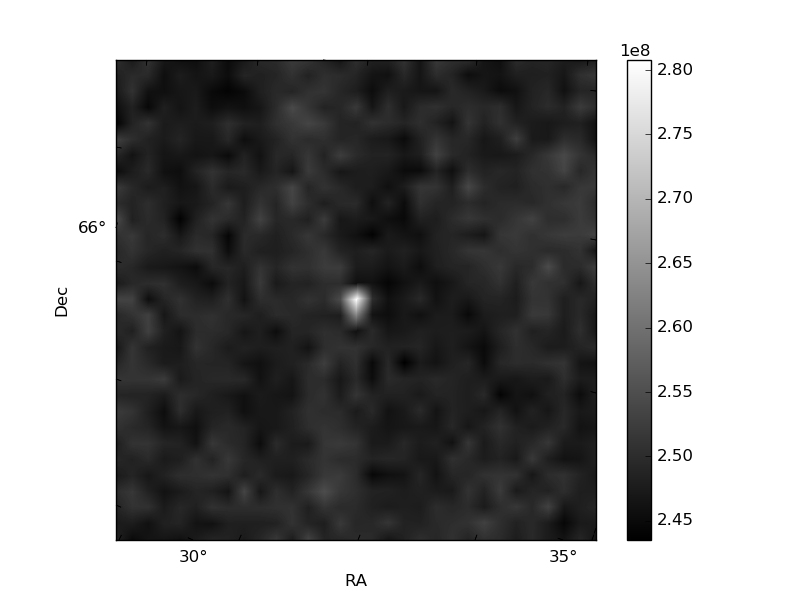
Histogram calculated using DETX and DETY for each event in the final _common_clean file
| Quadrant A | 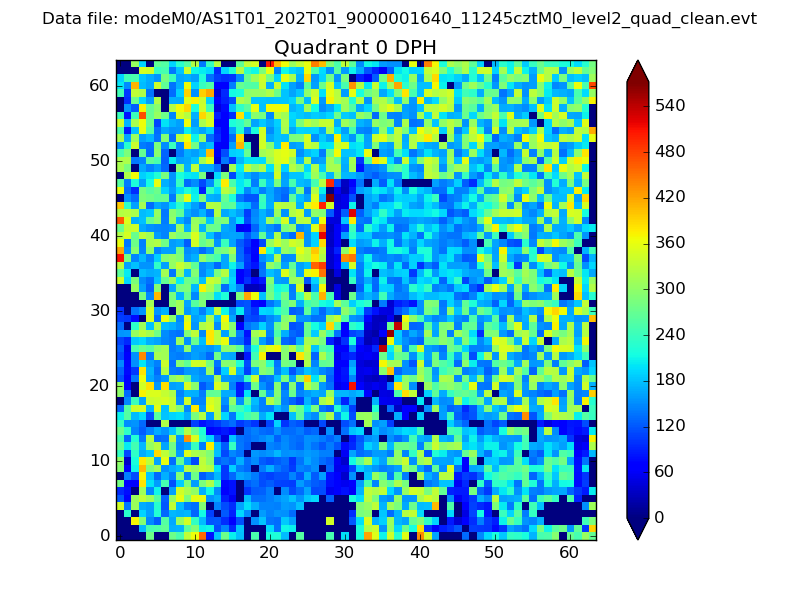 |
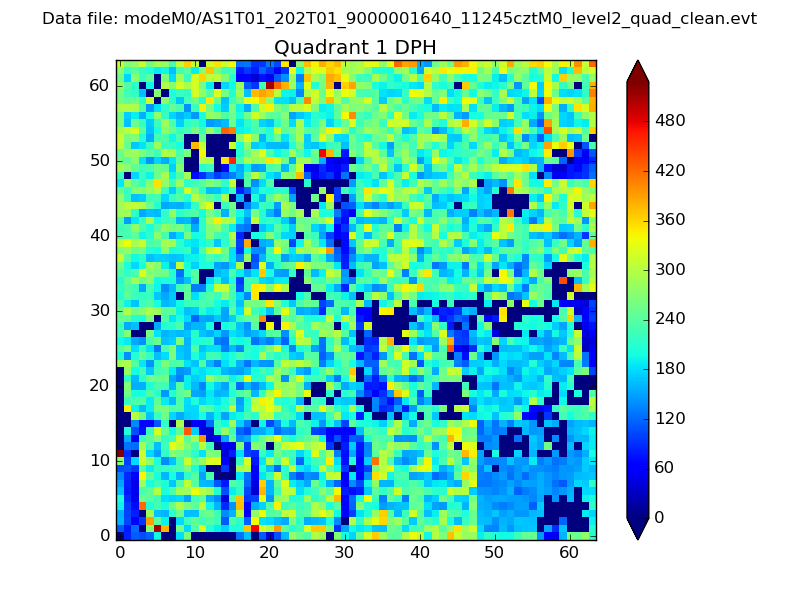 |
Quadrant B |
|---|---|---|---|
| Quadrant D | 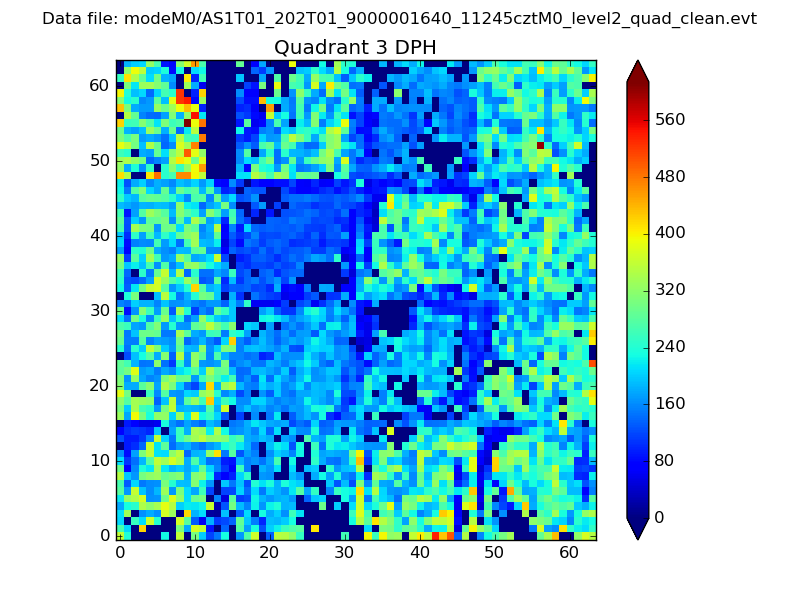 |
 |
Quadrant C |
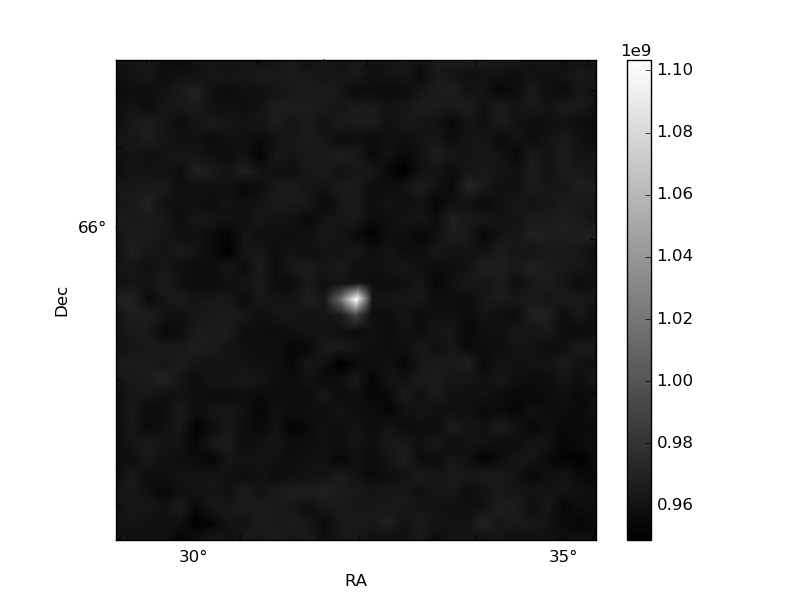
| Plot type | Count rate plots | Images |
|---|---|---|
| Comparison with Poisson distribution Blue bars denote a histogram of data divided into 1 sec bins. Red curve is a Poisson curve with rate = median count rate of data. |
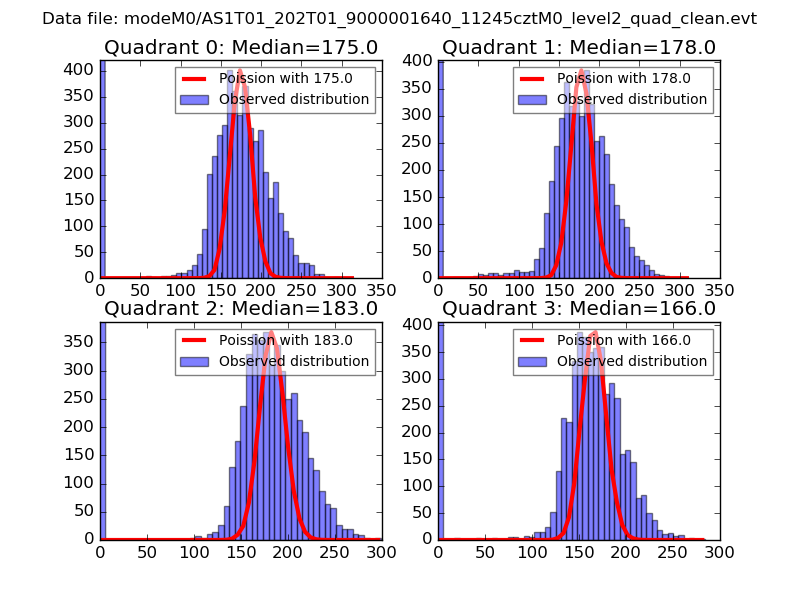 |
 |
| Quadrant-wise count rates Data is divided into 100 sec bins |
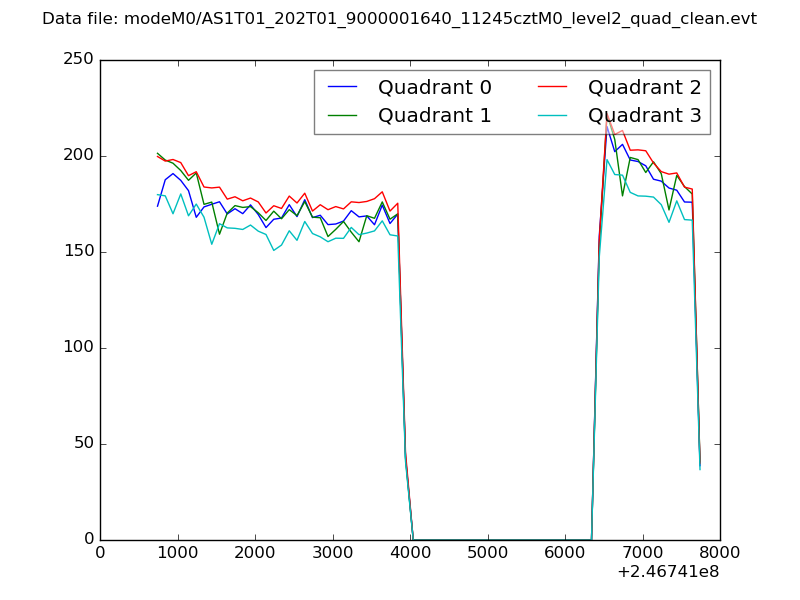 |
|
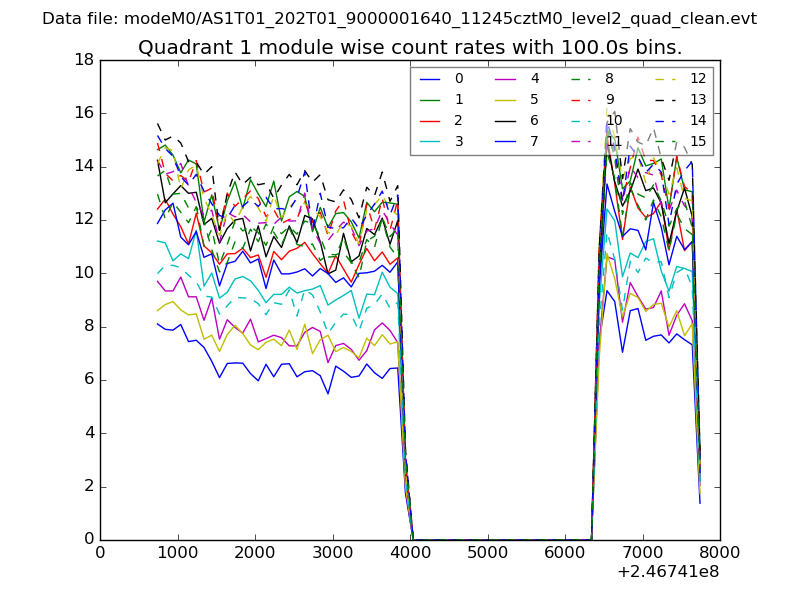
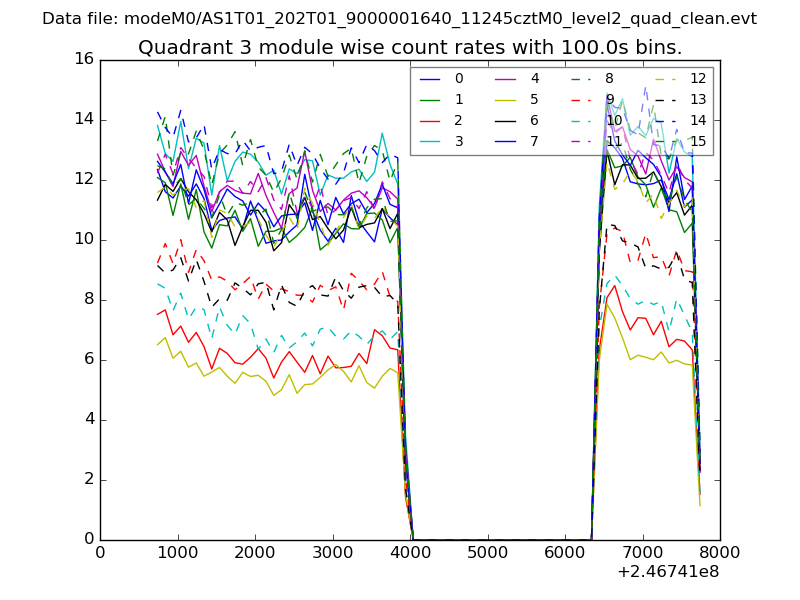
| Module-wise count rates for Quadrant A Data is divided into 100 sec bins |
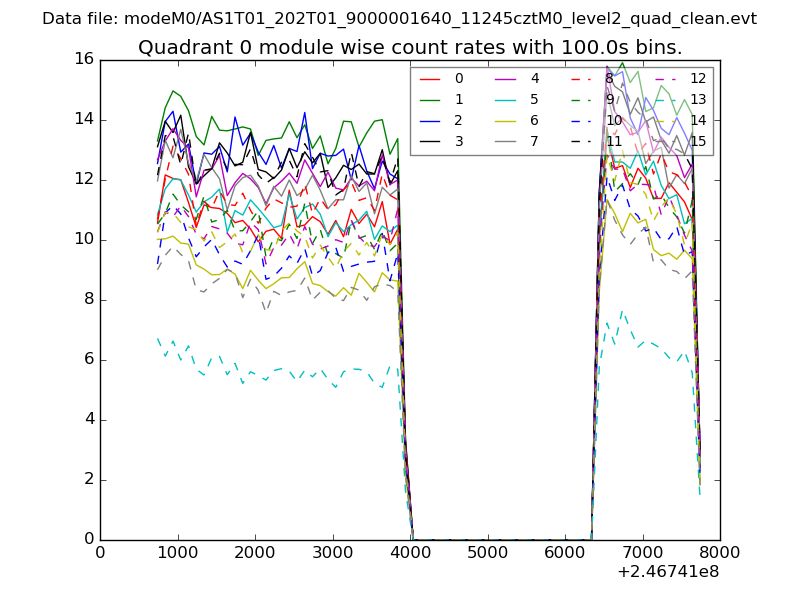 |
 |
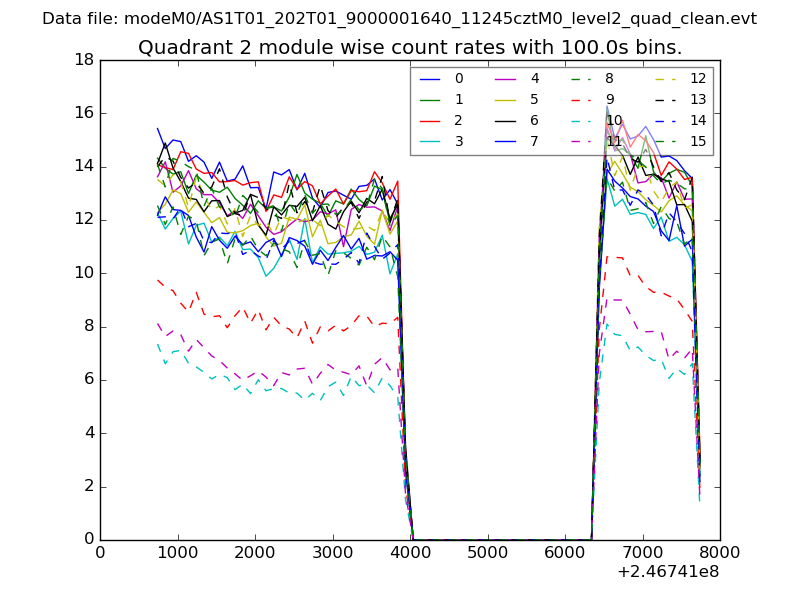
| Module-wise count rates for Quadrant B Data is divided into 100 sec bins |
 |
 |
| Module-wise count rates for Quadrant C Data is divided into 100 sec bins |
 |
 |
| Module-wise count rates for Quadrant D Data is divided into 100 sec bins |
 |
 |
| Parameter | Plot |
|---|---|
| CZT HV Monitor | 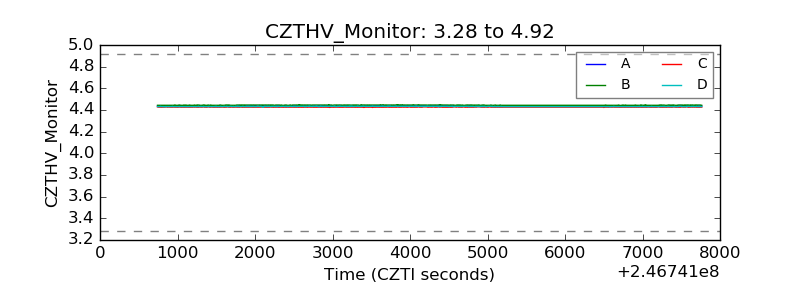 |
| D_VDD | 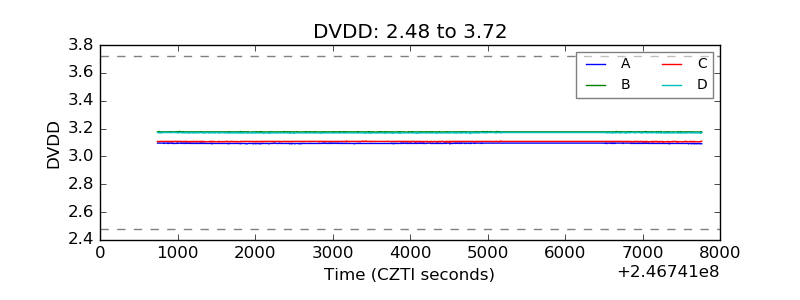 |
| Temperature 1 | 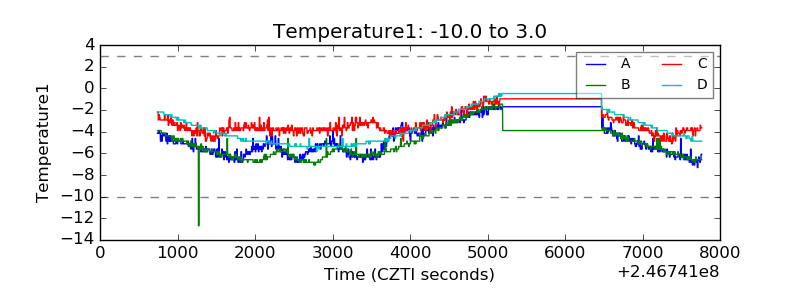 |
| Veto HV Monitor | 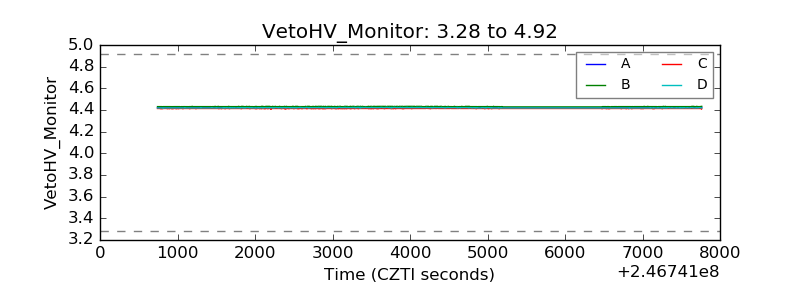 |
| Veto LLD | 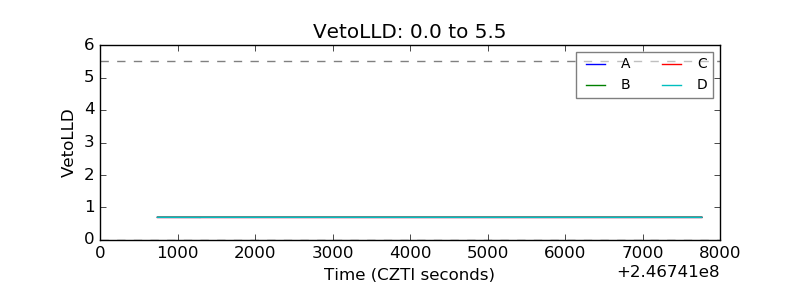 |
| Alpha Counter | 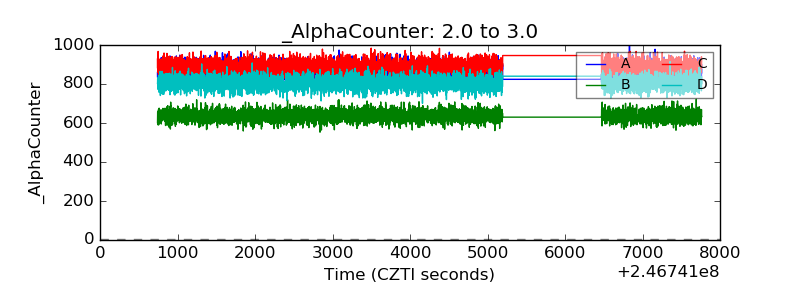 |
| _CPM_Rate | 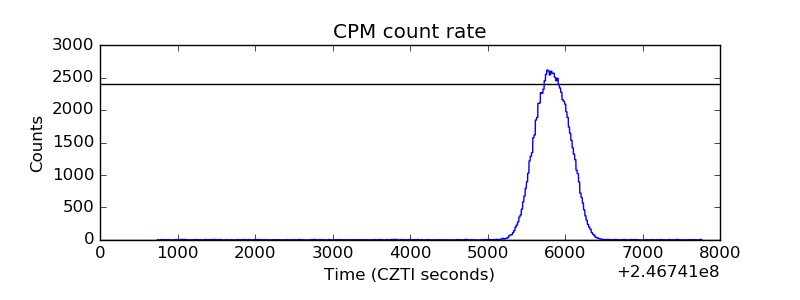 |
| CZT Counter | 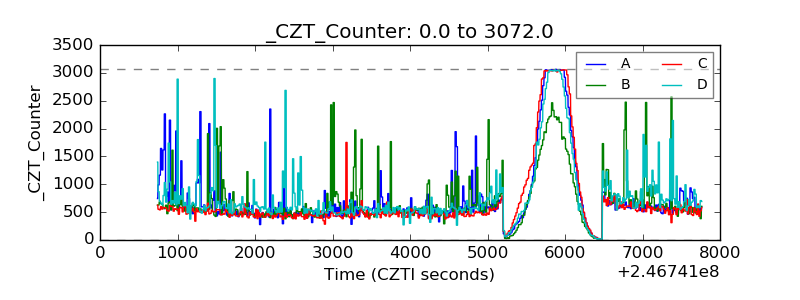 |
| +2.5 Volts monitor |  |
| +5 Volts monitor |  |
| _ROLL_ROT | 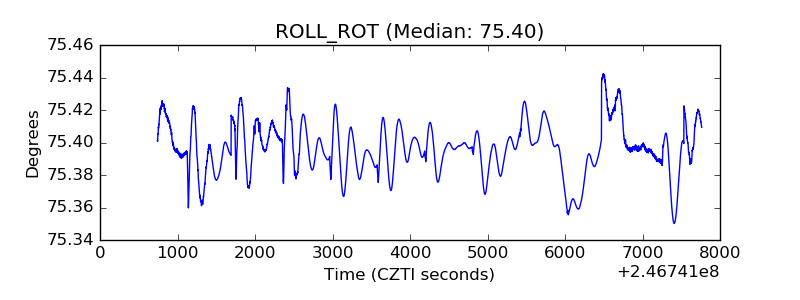 |
| _Roll_DEC | 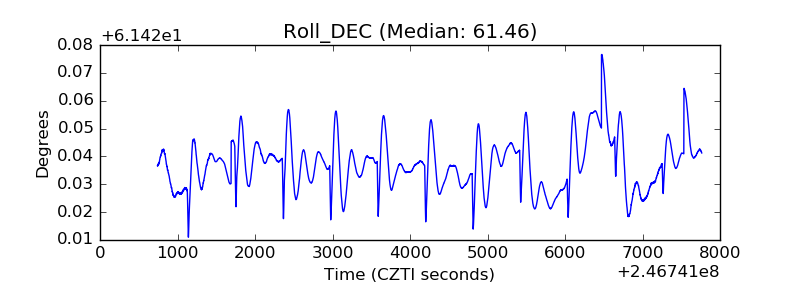 |
| _Roll_RA | 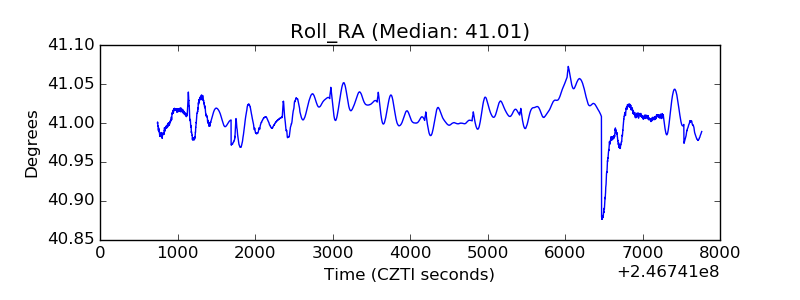 |
| Veto Counter | 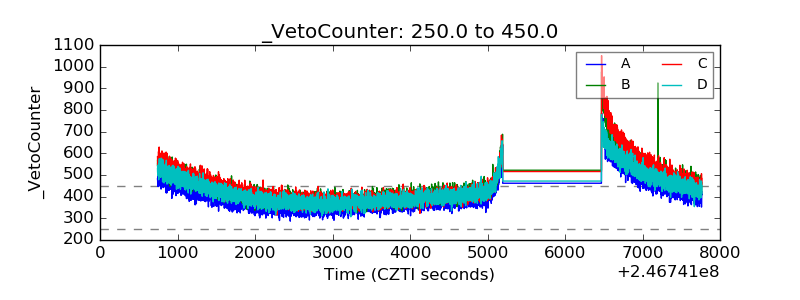 |