| Param | Original file | Final file |
|---|---|---|
| Filename | modeM0/AS1T01_202T01_9000001640_11246cztM0_level2.evt | modeM0/AS1T01_202T01_9000001640_11246cztM0_level2_quad_clean.evt |
| Size (bytes) | 467,377,920 | 101,433,600 |
| Size | 445.7 MB | 96.7 MB |
| Events in quadrant A | 3,716,487 | 674,508 |
| Events in quadrant B | 3,151,052 | 690,224 |
| Events in quadrant C | 2,664,955 | 703,283 |
| Events in quadrant D | 4,254,431 | 624,687 |
| Mode M9 | |||
|---|---|---|---|
| Quadrant | BADHDUFLAG | Total packets | Discarded packets |
| A | 0 | 13 | 0 |
| B | 0 | 13 | 0 |
| C | 0 | 13 | 0 |
| D | 0 | 13 | 0 |
| Mode M0 | |||
|---|---|---|---|
| Quadrant | BADHDUFLAG | Total packets | Discarded packets |
| A | 0 | 14565 | 2 |
| B | 0 | 12773 | 1 |
| C | 0 | 11300 | 1 |
| D | 0 | 16319 | 1 |
| Mode SS | |||
|---|---|---|---|
| Quadrant | BADHDUFLAG | Total packets | Discarded packets |
| A | 0 | 110 | 0 |
| B | 0 | 110 | 0 |
| C | 0 | 110 | 0 |
| D | 0 | 110 | 0 |
| Quadrant | Total seconds | Saturated seconds | Saturation percentage |
|---|---|---|---|
| A | 5420 | 166 | 3.062731% |
| B | 5420 | 154 | 2.841328% |
| C | 5420 | 12 | 0.221402% |
| D | 5420 | 220 | 4.059041% |
Noise dominated data is calculated using 1-second bins in cleaned event files. If a bin has >2000 counts, and if more than 50% of those come from <1% of pixels, then it is considered to be noise-dominated and hence unusable.
| Quadrant | # 1 sec bins | Bins with >0 counts | Bins with >2000 counts | High rate bins dominated by noise | Noise dominated (total time) | Noise dominated (detector-on time) | Marked lightcurve |
|---|---|---|---|---|---|---|---|
| A | 6715 | 5421 | 62 | 62 | 0.92% | 1.14% | 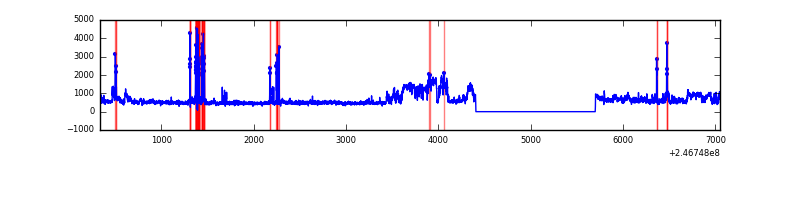 |
| B | 6715 | 5421 | 53 | 53 | 0.79% | 0.98% | 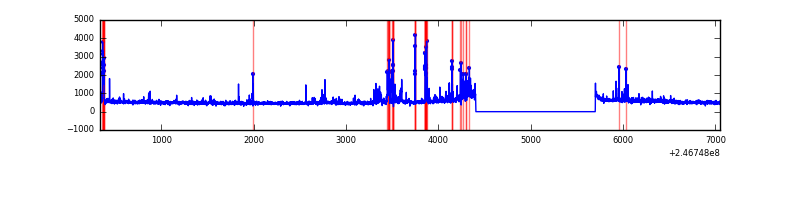 |
| C | 6715 | 5421 | 0 | 0 | 0.00% | 0.00% | 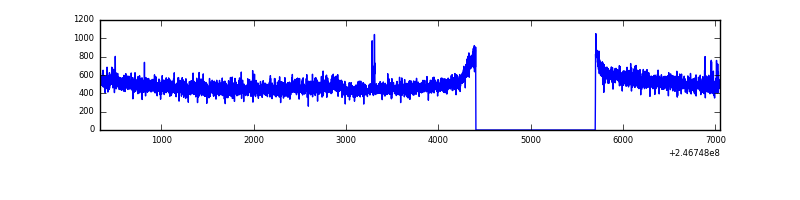 |
| D | 6715 | 5421 | 193 | 193 | 2.87% | 3.56% | 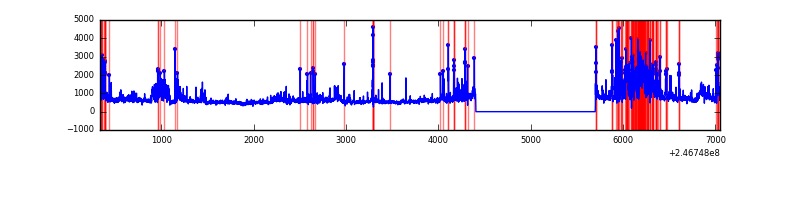 |
Top three noisy pixels from each quadrant. If the there are fewer than three noisy pixels in the level2.evt file, extra rows are filled as -1
| Pixel properties | Quadrant properties | ||||||
|---|---|---|---|---|---|---|---|
| Quadrant | DetID | PixID | Counts | Sigma | Mean | Median | Sigma |
| A | 15 | 174 | 755741 | 4958.07 | 680 | 665 | 152.3 |
| A | 14 | 238 | 255317 | 1672.13 | 680 | 665 | 152.3 |
| A | 8 | 15 | 49824 | 322.79 | 680 | 665 | 152.3 |
| B | 4 | 239 | 275102 | 2020.84 | 688 | 675 | 135.8 |
| B | 11 | 51 | 52435 | 381.15 | 688 | 675 | 135.8 |
| B | 10 | 114 | 45094 | 327.09 | 688 | 675 | 135.8 |
| C | 5 | 239 | 10711 | 62.07 | 680 | 690 | 161.4 |
| C | 13 | 61 | 4979 | 26.57 | 680 | 690 | 161.4 |
| C | 12 | 4 | 2790 | 13.01 | 680 | 690 | 161.4 |
| D | 8 | 195 | 509585 | 3067.34 | 648 | 630 | 165.9 |
| D | 13 | 104 | 383136 | 2305.26 | 648 | 630 | 165.9 |
| D | 12 | 157 | 283900 | 1707.19 | 648 | 630 | 165.9 |
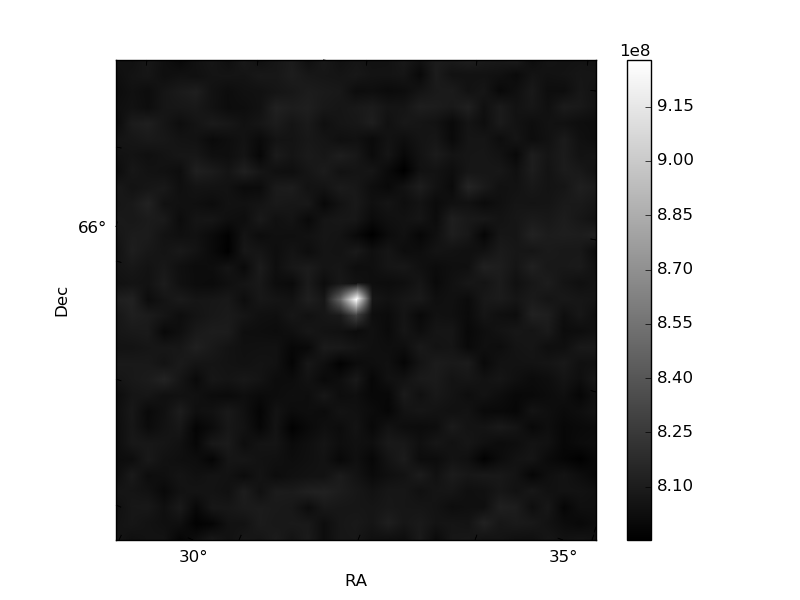
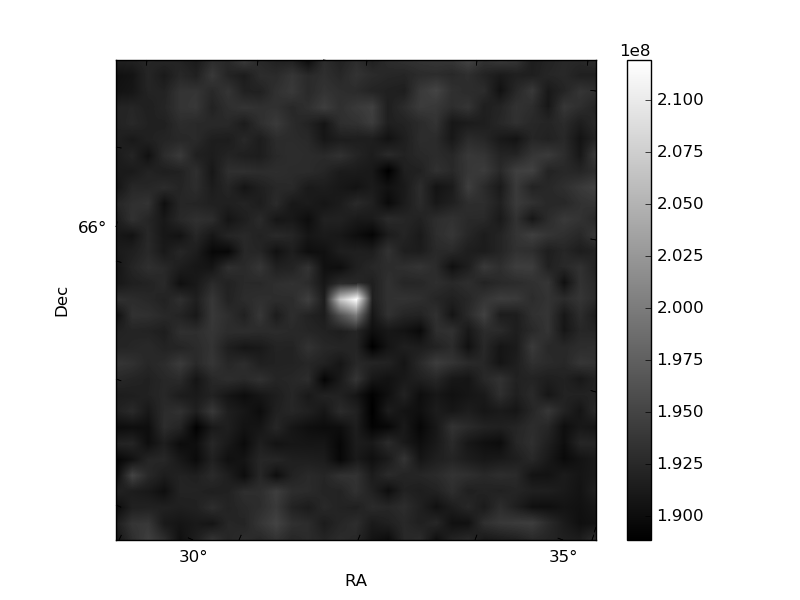
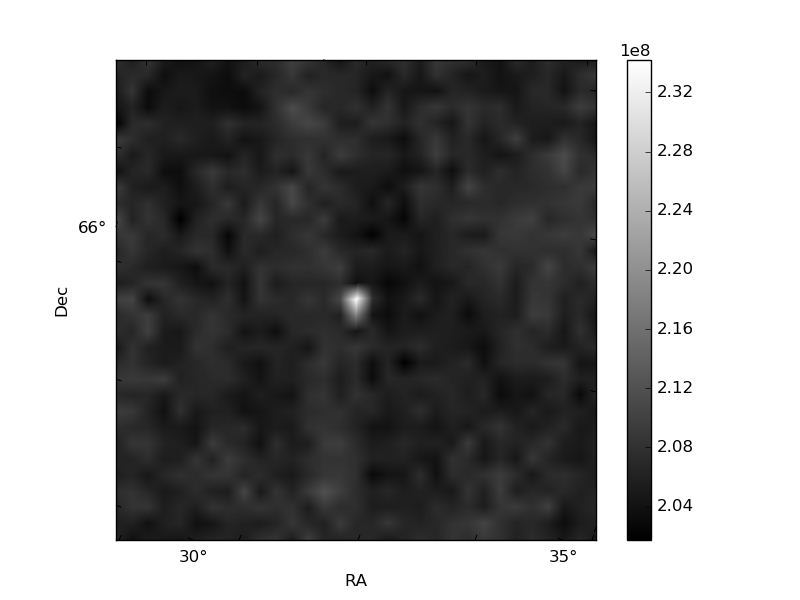
Histogram calculated using DETX and DETY for each event in the final _common_clean file
| Quadrant A | 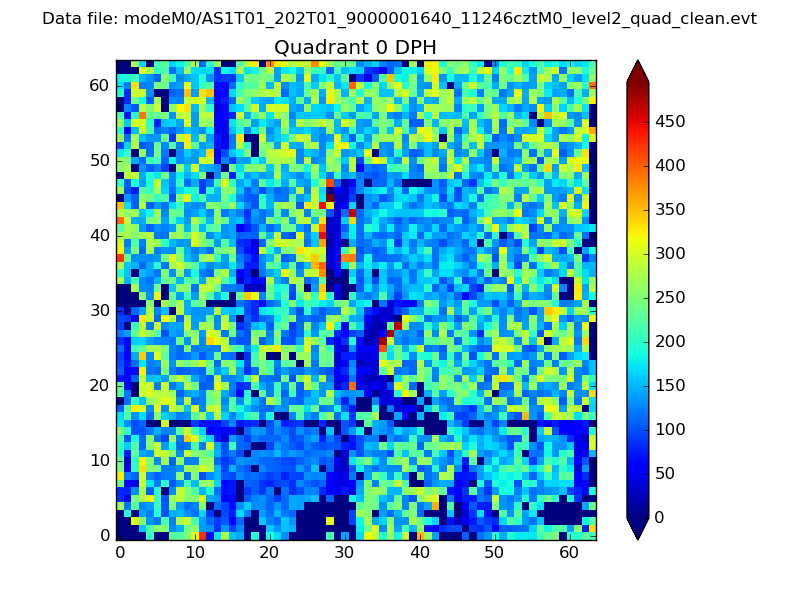 |
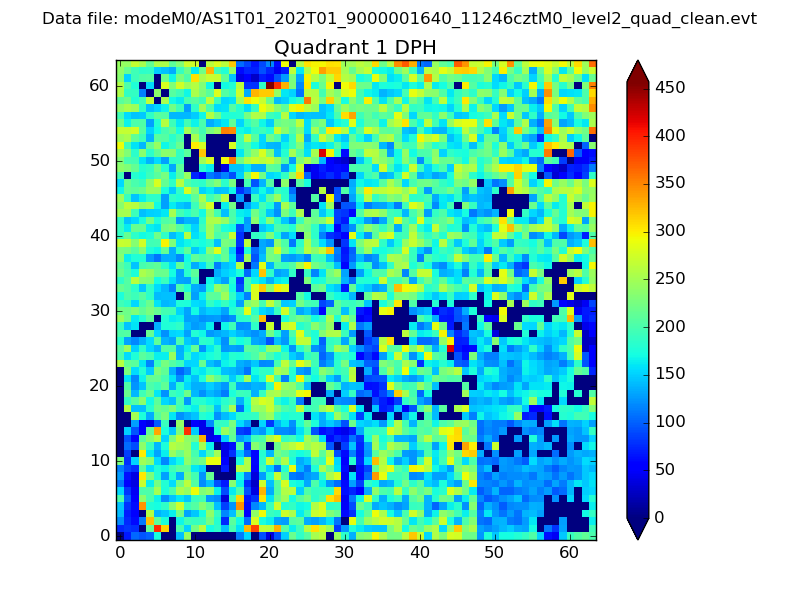 |
Quadrant B |
|---|---|---|---|
| Quadrant D | 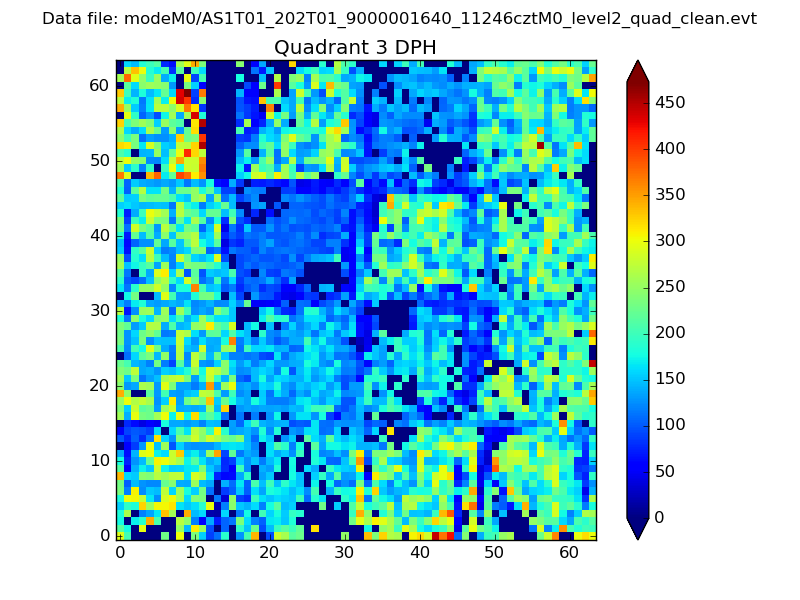 |
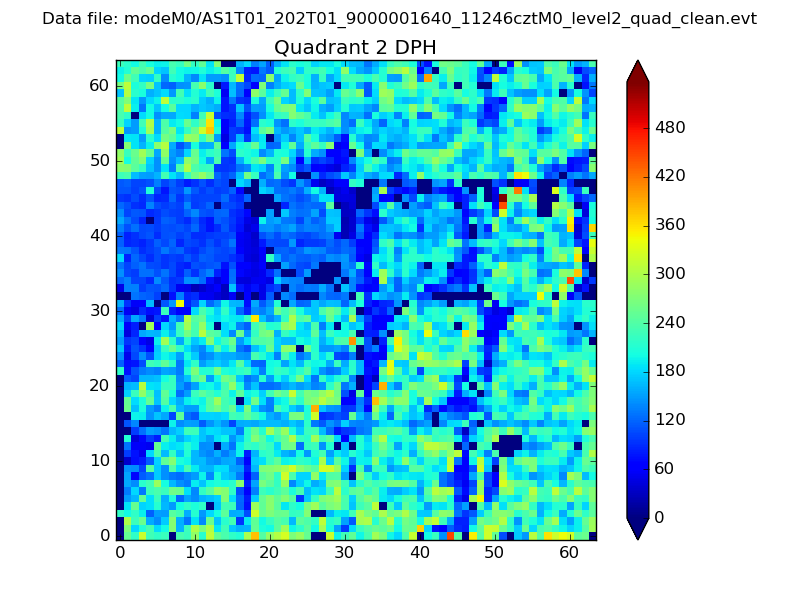 |
Quadrant C |
| Plot type | Count rate plots | Images |
|---|---|---|
| Comparison with Poisson distribution Blue bars denote a histogram of data divided into 1 sec bins. Red curve is a Poisson curve with rate = median count rate of data. |
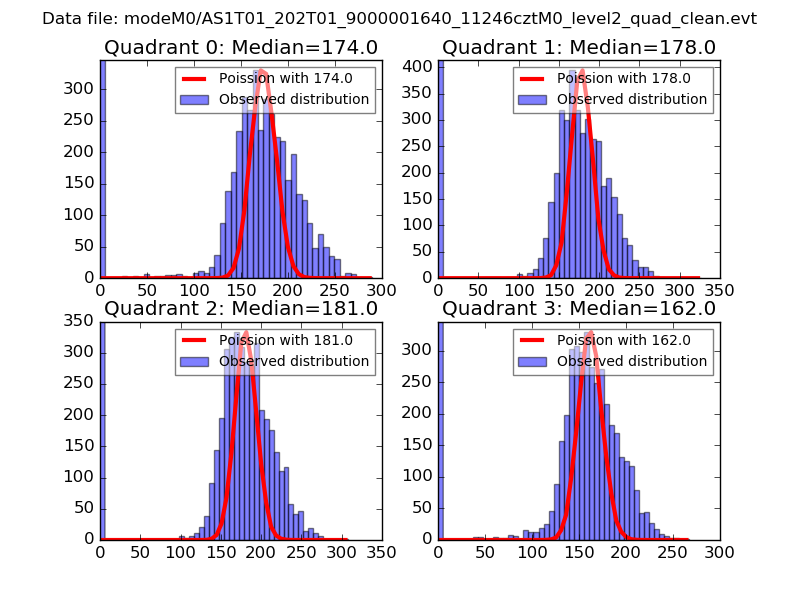 |
 |
| Quadrant-wise count rates Data is divided into 100 sec bins |
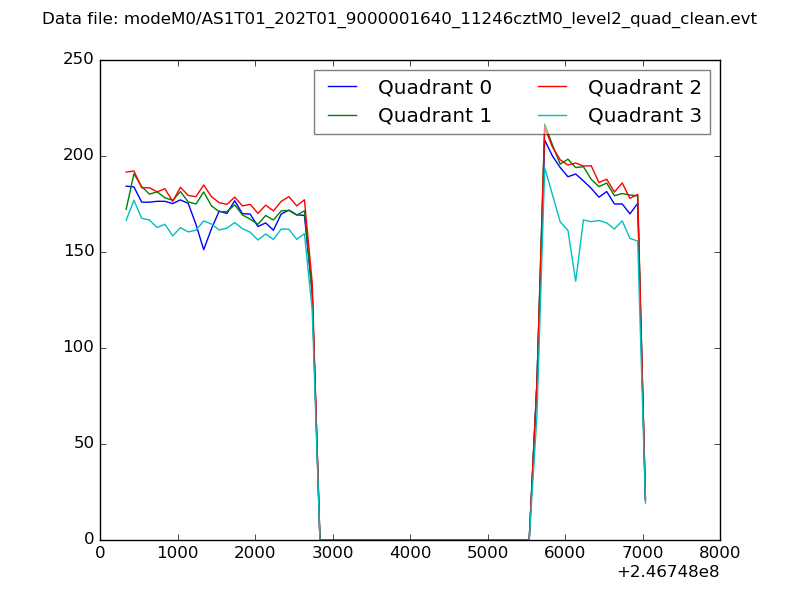 |
|
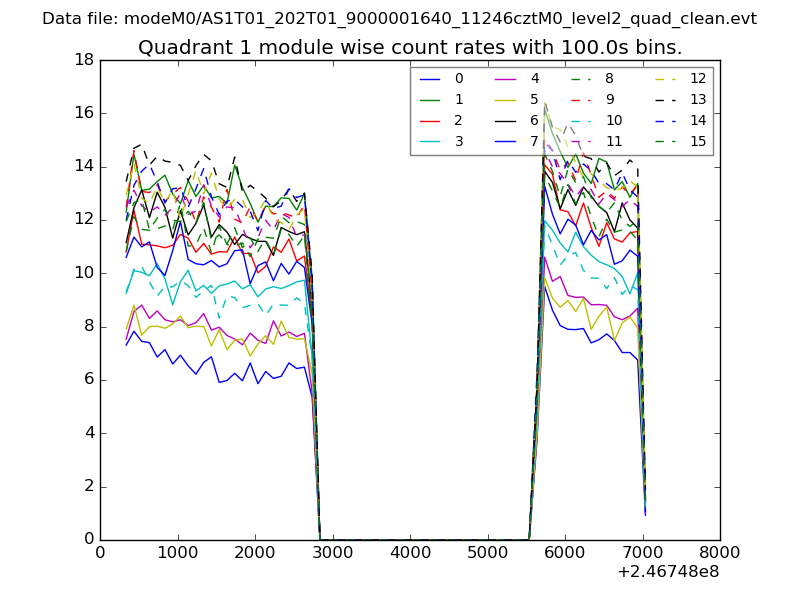
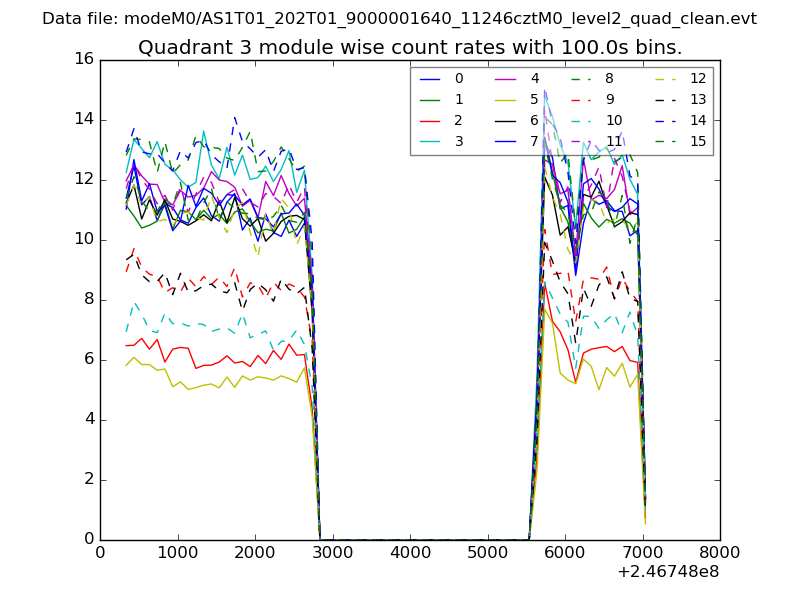
| Module-wise count rates for Quadrant A Data is divided into 100 sec bins |
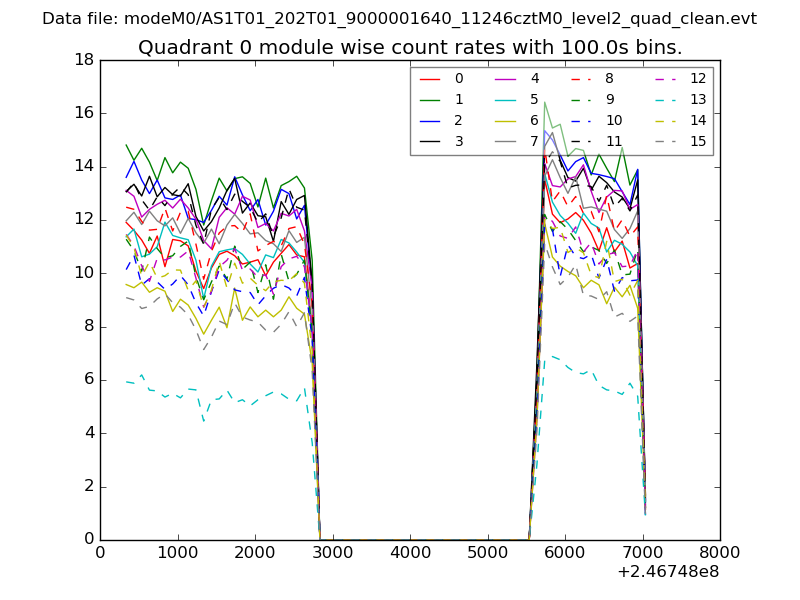 |
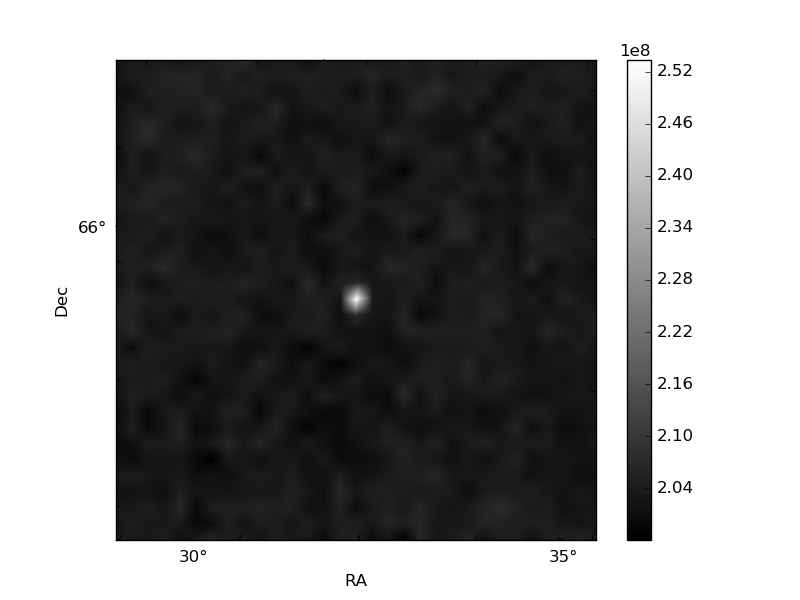 |
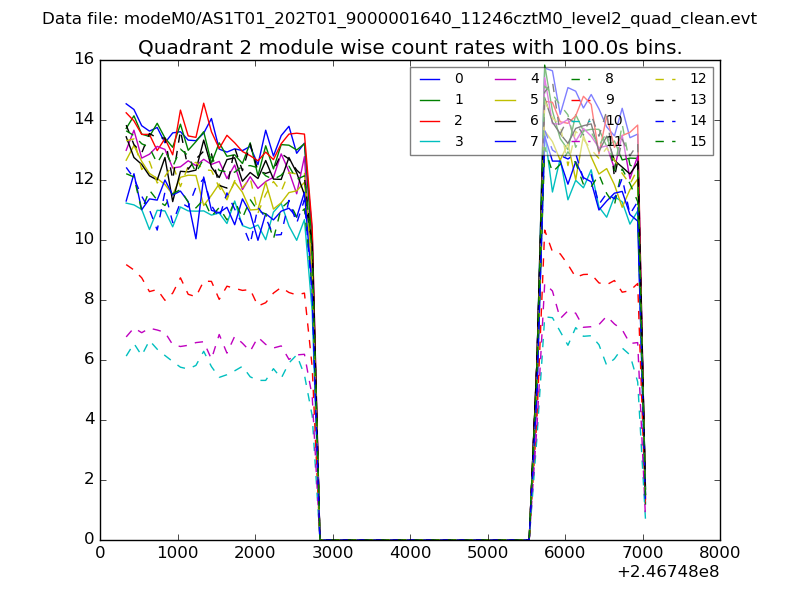
| Module-wise count rates for Quadrant B Data is divided into 100 sec bins |
 |
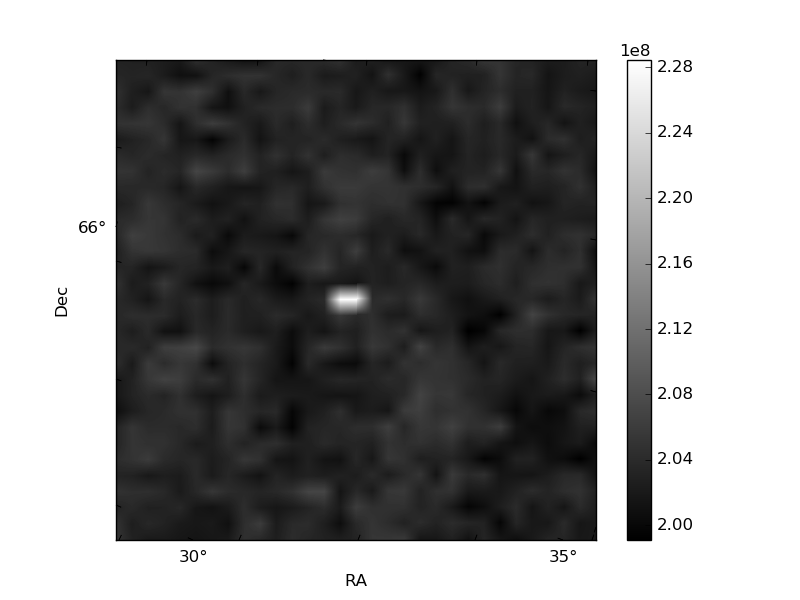 |
| Module-wise count rates for Quadrant C Data is divided into 100 sec bins |
 |
 |
| Module-wise count rates for Quadrant D Data is divided into 100 sec bins |
 |
 |
| Parameter | Plot |
|---|---|
| CZT HV Monitor | 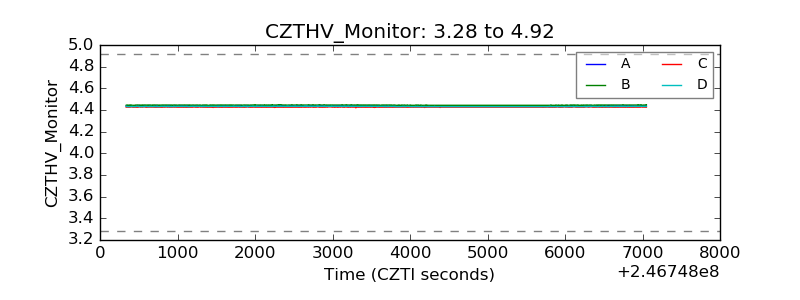 |
| D_VDD | 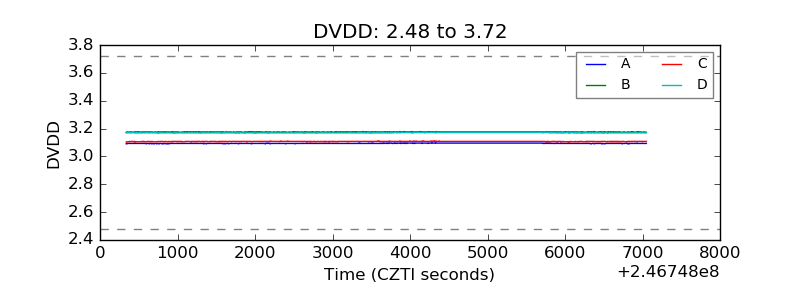 |
| Temperature 1 | 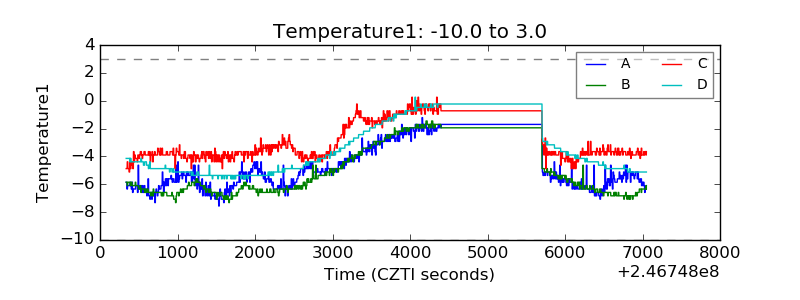 |
| Veto HV Monitor | 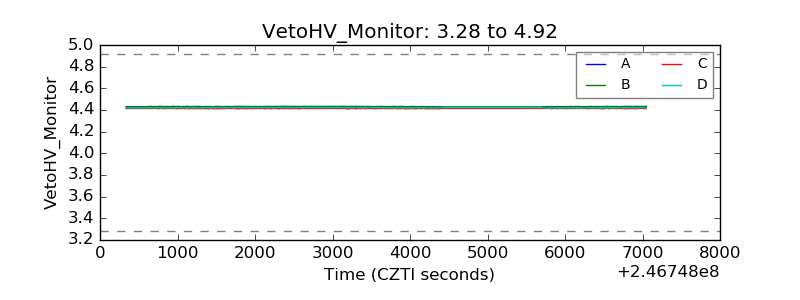 |
| Veto LLD | 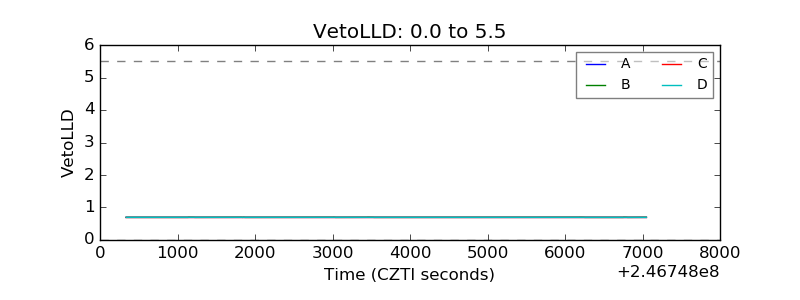 |
| Alpha Counter | 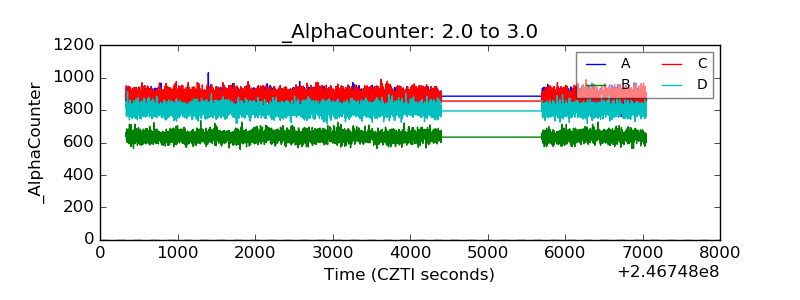 |
| _CPM_Rate | 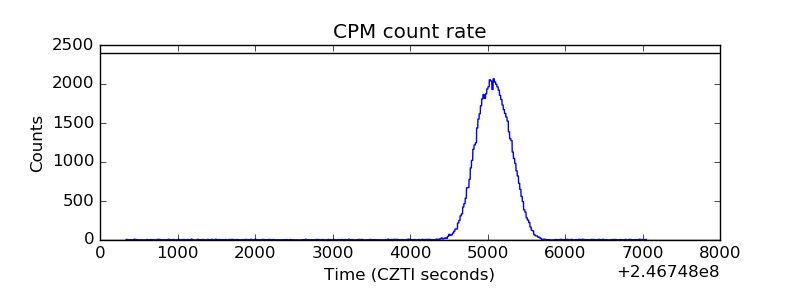 |
| CZT Counter | 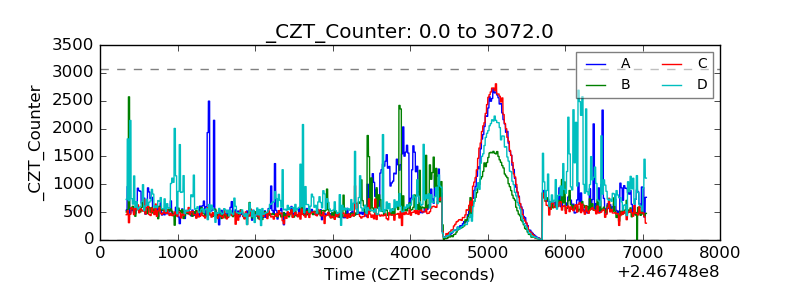 |
| +2.5 Volts monitor |  |
| +5 Volts monitor |  |
| _ROLL_ROT | 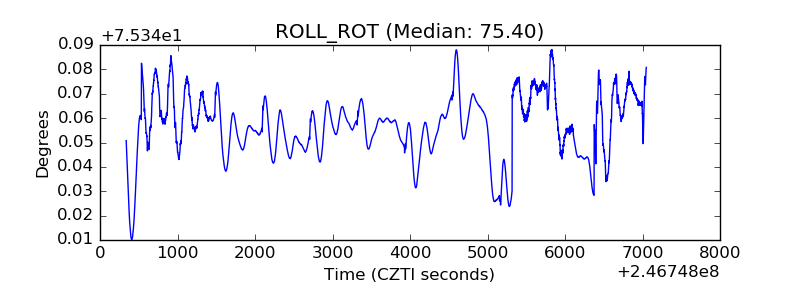 |
| _Roll_DEC | 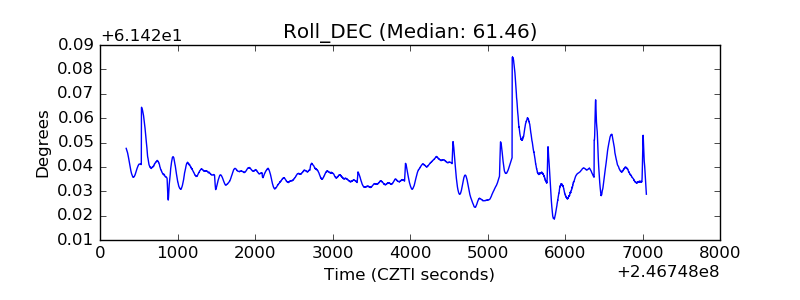 |
| _Roll_RA | 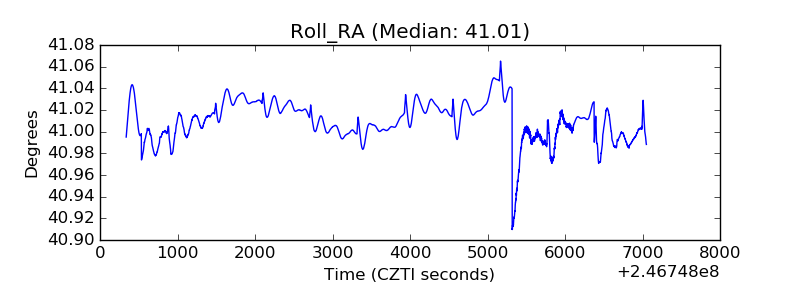 |
| Veto Counter | 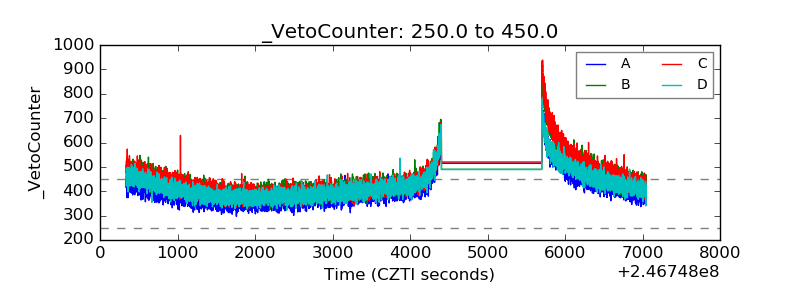 |