| Param | Original file | Final file |
|---|---|---|
| Filename | modeM0/AS1T01_202T01_9000001640_11248cztM0_level2.evt | modeM0/AS1T01_202T01_9000001640_11248cztM0_level2_quad_clean.evt |
| Size (bytes) | 473,964,480 | 111,265,920 |
| Size | 452.0 MB | 106.1 MB |
| Events in quadrant A | 3,322,339 | 748,342 |
| Events in quadrant B | 3,894,895 | 746,021 |
| Events in quadrant C | 2,859,827 | 764,851 |
| Events in quadrant D | 3,867,659 | 689,539 |
| Mode M9 | |||
|---|---|---|---|
| Quadrant | BADHDUFLAG | Total packets | Discarded packets |
| A | 0 | 10 | 0 |
| B | 0 | 10 | 0 |
| C | 0 | 10 | 0 |
| D | 0 | 10 | 0 |
| Mode M0 | |||
|---|---|---|---|
| Quadrant | BADHDUFLAG | Total packets | Discarded packets |
| A | 0 | 13700 | 2 |
| B | 0 | 15509 | 1 |
| C | 0 | 12528 | 1 |
| D | 0 | 15498 | 1 |
| Mode SS | |||
|---|---|---|---|
| Quadrant | BADHDUFLAG | Total packets | Discarded packets |
| A | 0 | 122 | 0 |
| B | 0 | 122 | 0 |
| C | 0 | 122 | 0 |
| D | 0 | 122 | 0 |
| Quadrant | Total seconds | Saturated seconds | Saturation percentage |
|---|---|---|---|
| A | 6031 | 98 | 1.624938% |
| B | 6031 | 262 | 4.344222% |
| C | 6031 | 30 | 0.497430% |
| D | 6031 | 228 | 3.780468% |
Noise dominated data is calculated using 1-second bins in cleaned event files. If a bin has >2000 counts, and if more than 50% of those come from <1% of pixels, then it is considered to be noise-dominated and hence unusable.
| Quadrant | # 1 sec bins | Bins with >0 counts | Bins with >2000 counts | High rate bins dominated by noise | Noise dominated (total time) | Noise dominated (detector-on time) | Marked lightcurve |
|---|---|---|---|---|---|---|---|
| A | 7046 | 6032 | 48 | 48 | 0.68% | 0.80% | 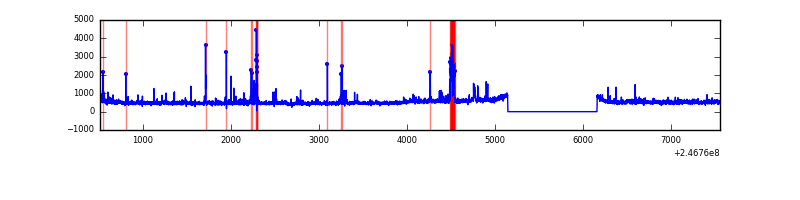 |
| B | 7046 | 6032 | 116 | 116 | 1.65% | 1.92% | 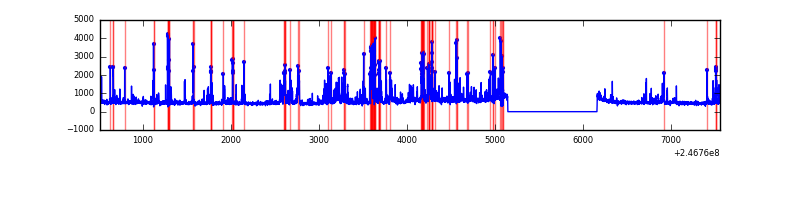 |
| C | 7046 | 6032 | 0 | 0 | 0.00% | 0.00% | 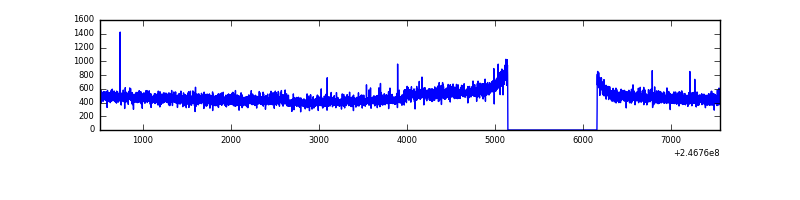 |
| D | 7046 | 6032 | 98 | 98 | 1.39% | 1.62% | 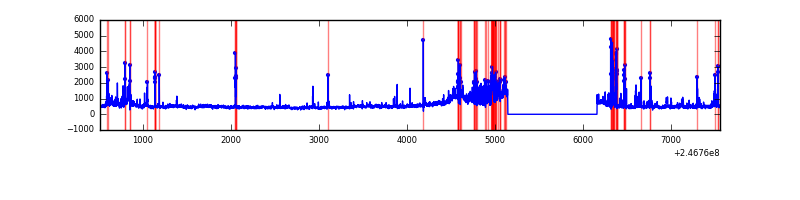 |
Top three noisy pixels from each quadrant. If the there are fewer than three noisy pixels in the level2.evt file, extra rows are filled as -1
| Pixel properties | Quadrant properties | ||||||
|---|---|---|---|---|---|---|---|
| Quadrant | DetID | PixID | Counts | Sigma | Mean | Median | Sigma |
| A | 8 | 5 | 183586 | 1096.08 | 745 | 729 | 166.8 |
| A | 15 | 174 | 109688 | 653.12 | 745 | 729 | 166.8 |
| A | 1 | 162 | 37498 | 220.4 | 745 | 729 | 166.8 |
| B | 4 | 239 | 652743 | 4416.02 | 742 | 728 | 147.6 |
| B | 10 | 114 | 170354 | 1148.85 | 742 | 728 | 147.6 |
| B | 11 | 51 | 51981 | 347.13 | 742 | 728 | 147.6 |
| C | 13 | 61 | 5334 | 26.09 | 732 | 743 | 175.9 |
| C | 12 | 4 | 2764 | 11.49 | 732 | 743 | 175.9 |
| C | 4 | 254 | 2668 | 10.94 | 732 | 743 | 175.9 |
| D | 12 | 157 | 369896 | 2018.99 | 706 | 688 | 182.9 |
| D | 8 | 195 | 241396 | 1316.3 | 706 | 688 | 182.9 |
| D | 13 | 104 | 219727 | 1197.8 | 706 | 688 | 182.9 |
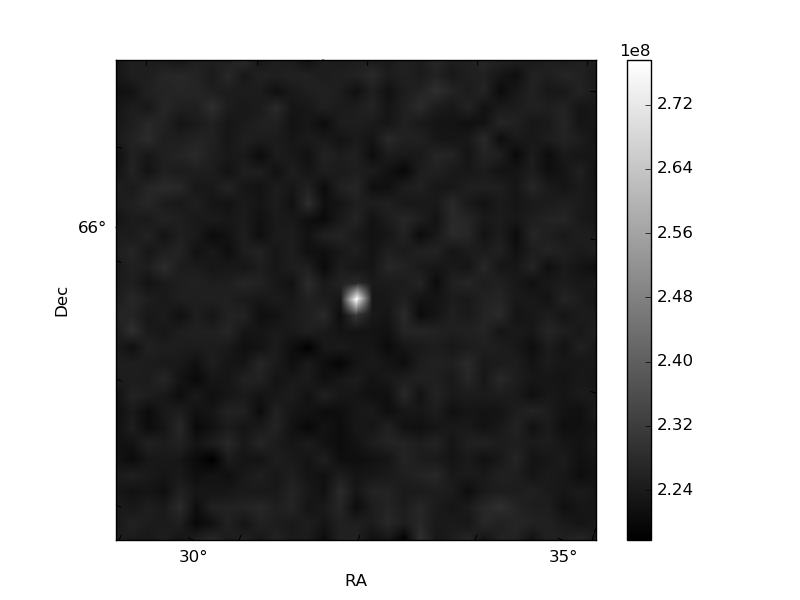
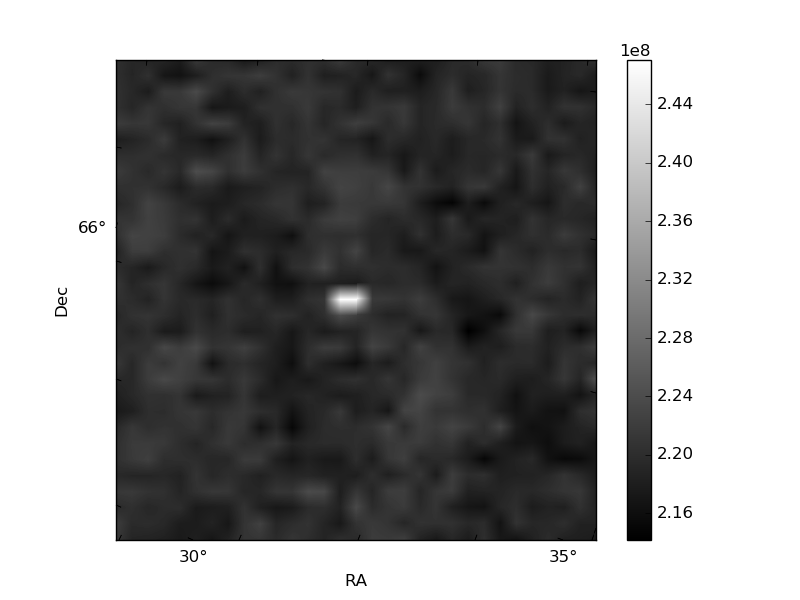
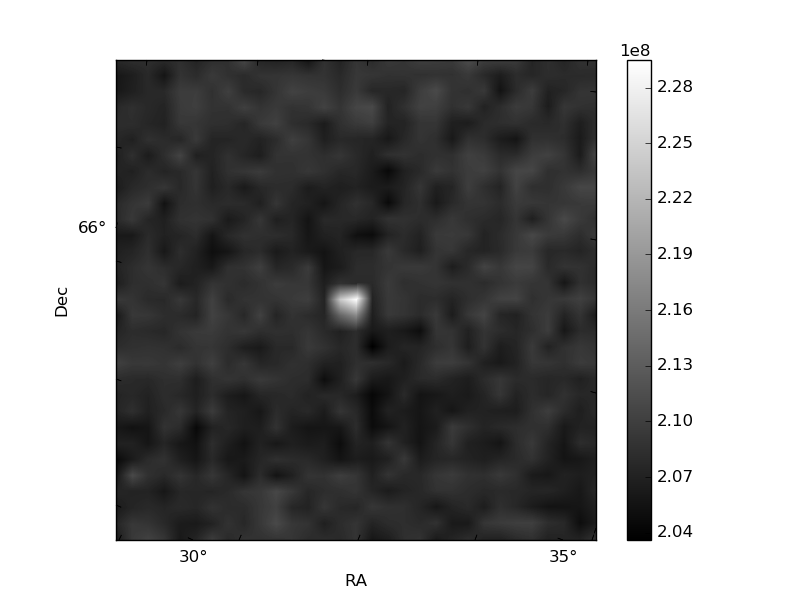
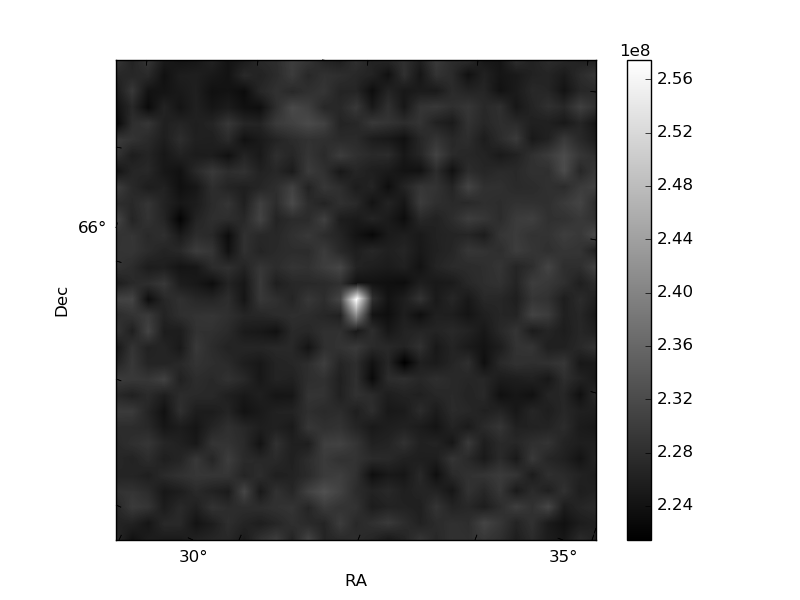
Histogram calculated using DETX and DETY for each event in the final _common_clean file
| Quadrant A | 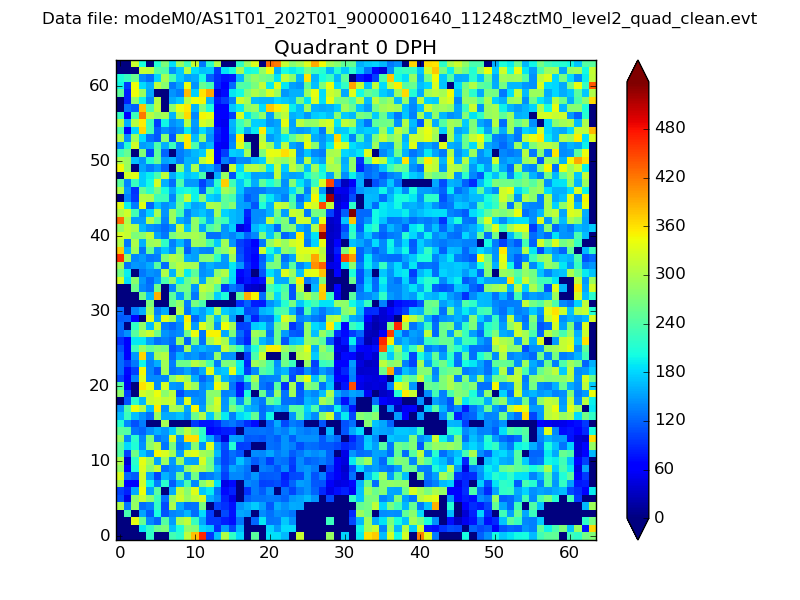 |
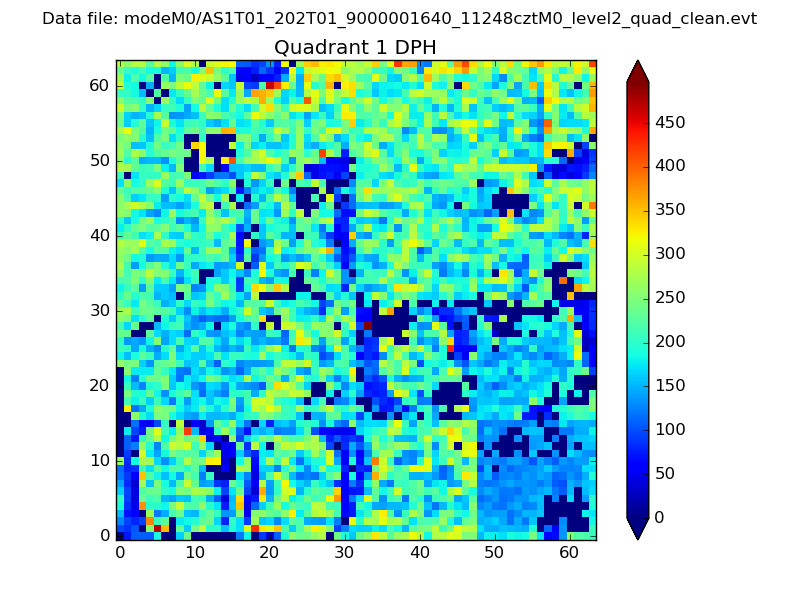 |
Quadrant B |
|---|---|---|---|
| Quadrant D | 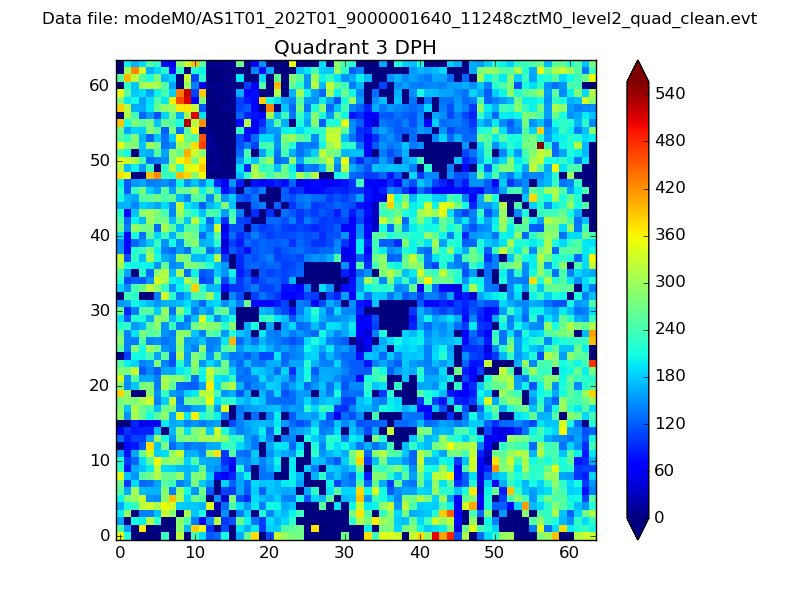 |
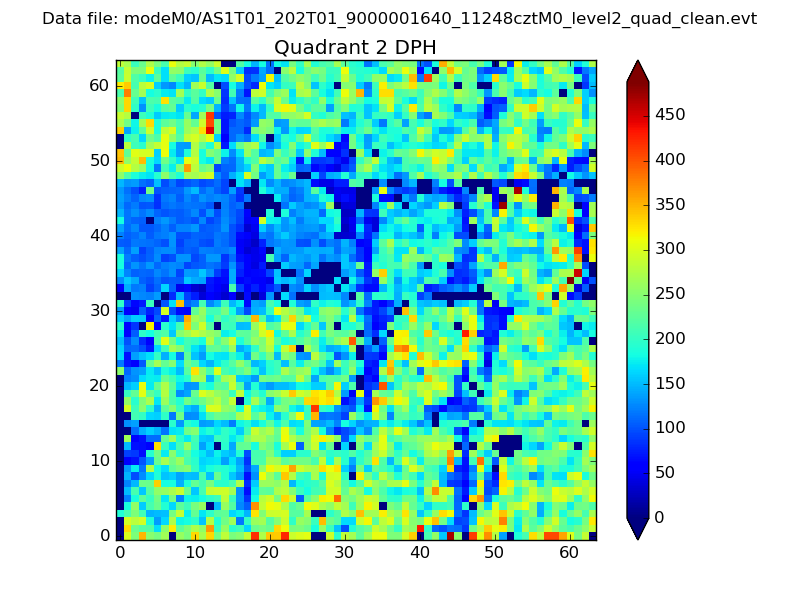 |
Quadrant C |
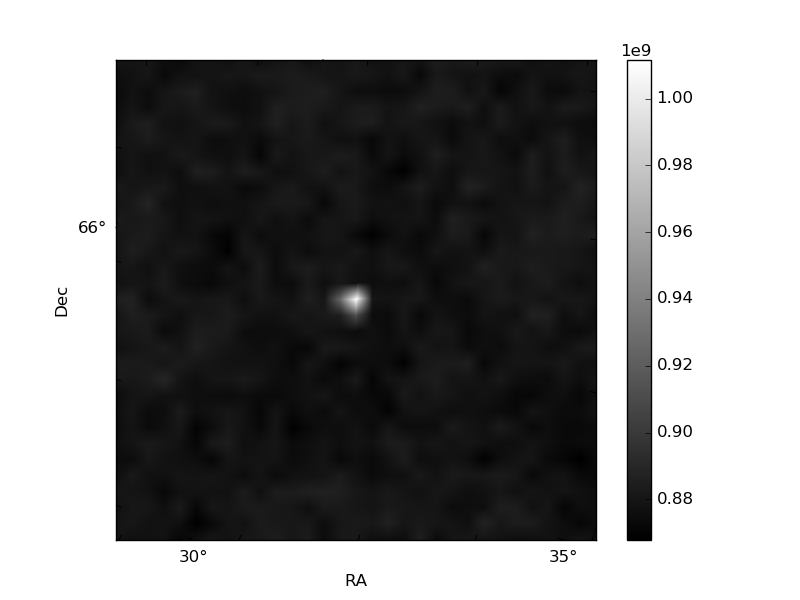
| Plot type | Count rate plots | Images |
|---|---|---|
| Comparison with Poisson distribution Blue bars denote a histogram of data divided into 1 sec bins. Red curve is a Poisson curve with rate = median count rate of data. |
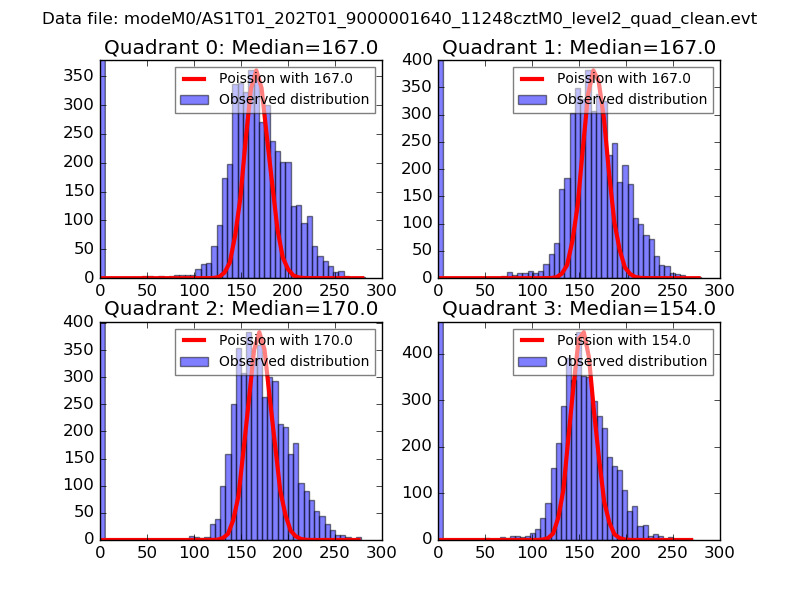 |
 |
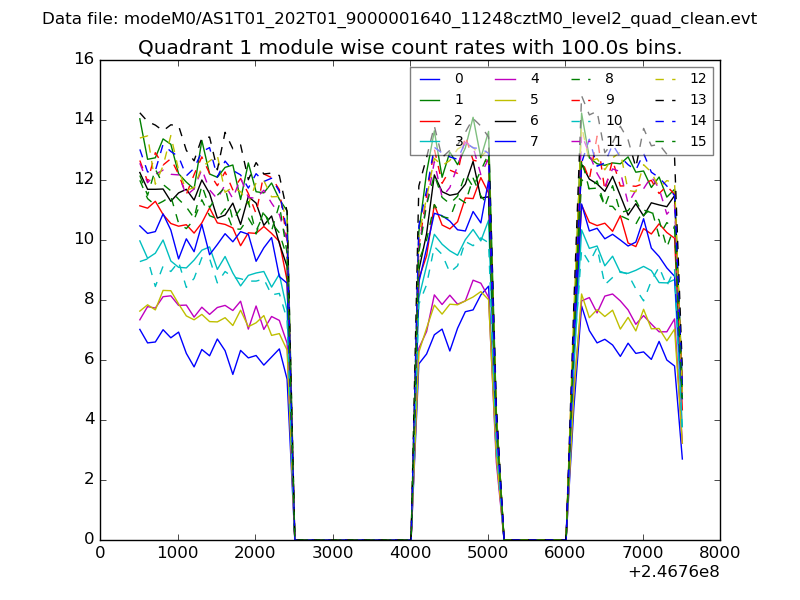
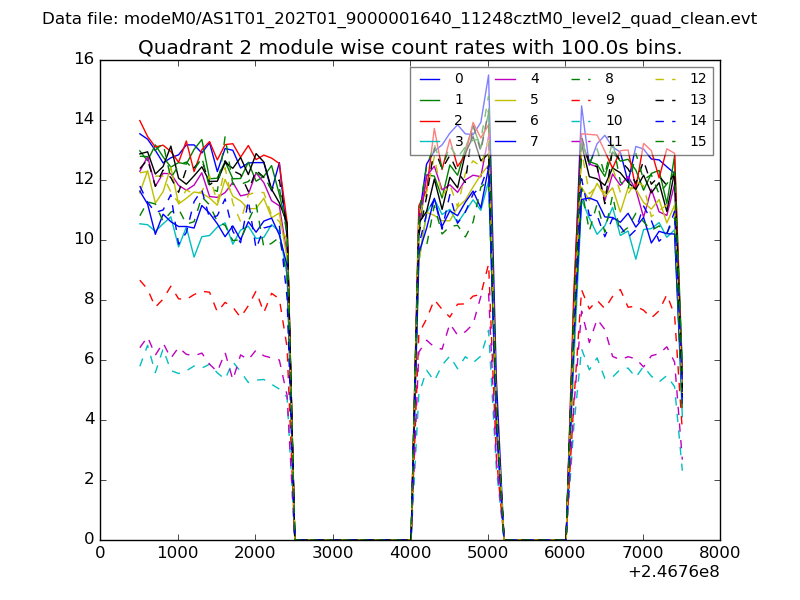
| Quadrant-wise count rates Data is divided into 100 sec bins |
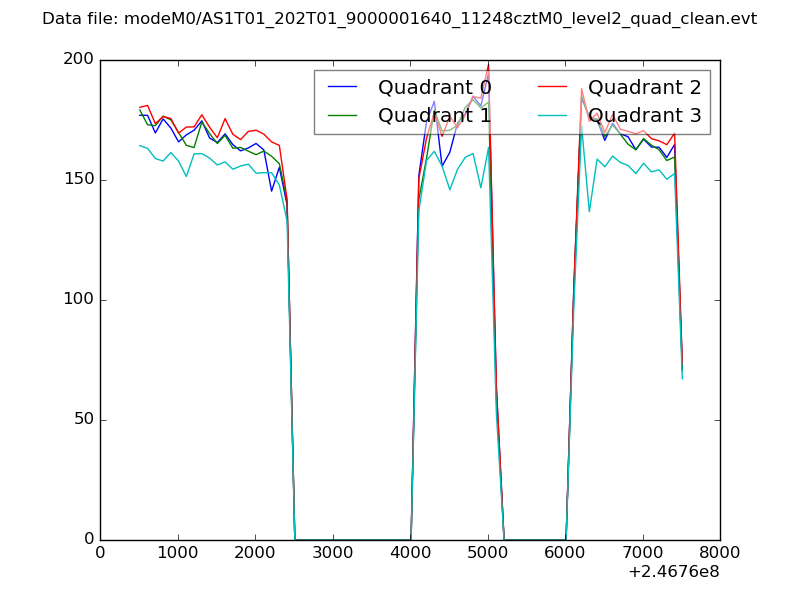 |
|
| Module-wise count rates for Quadrant A Data is divided into 100 sec bins |
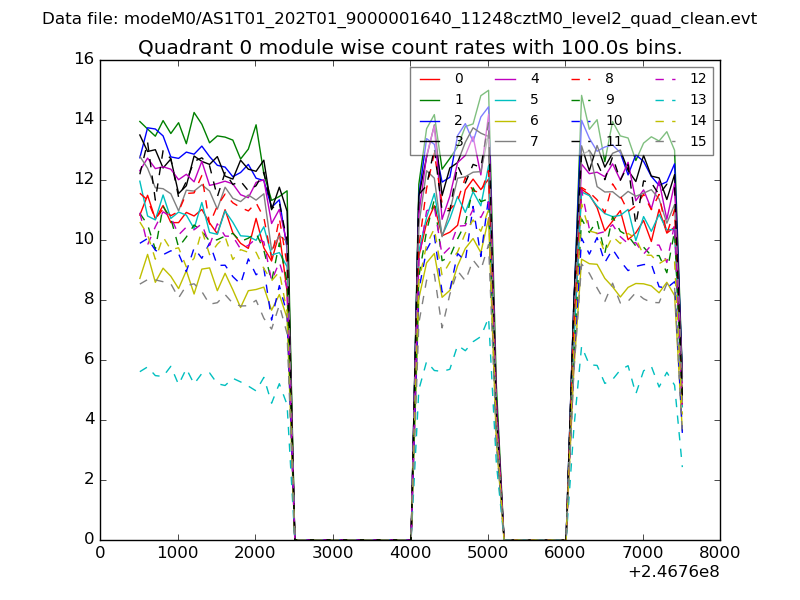 |
 |
| Module-wise count rates for Quadrant B Data is divided into 100 sec bins |
 |
 |
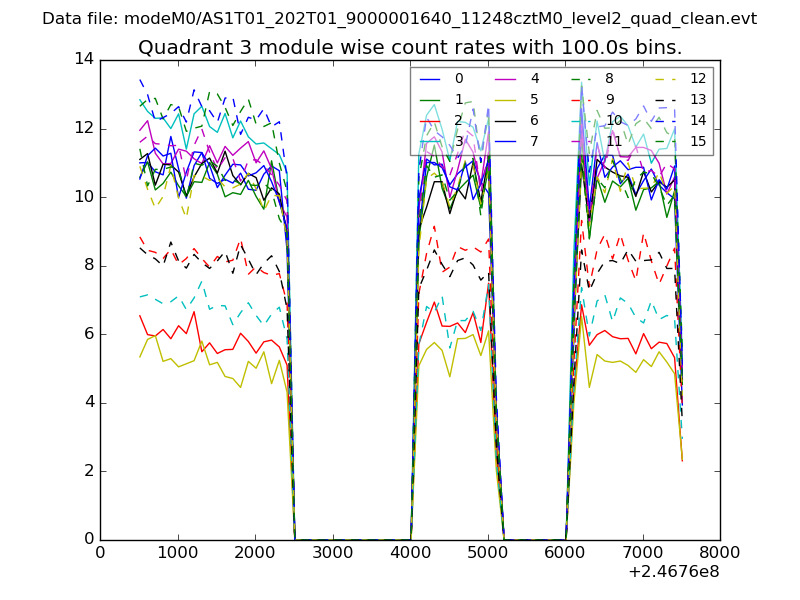
| Module-wise count rates for Quadrant C Data is divided into 100 sec bins |
 |
 |
| Module-wise count rates for Quadrant D Data is divided into 100 sec bins |
 |
 |
| Parameter | Plot |
|---|---|
| CZT HV Monitor | 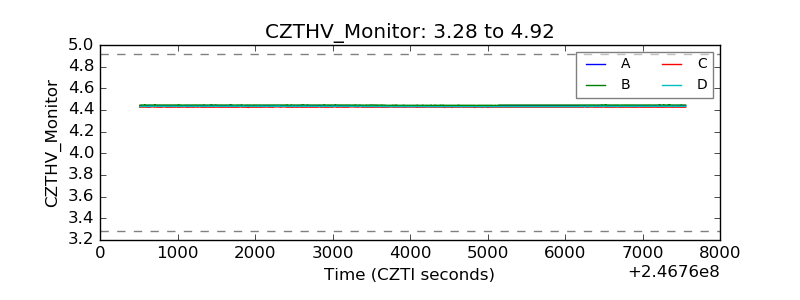 |
| D_VDD | 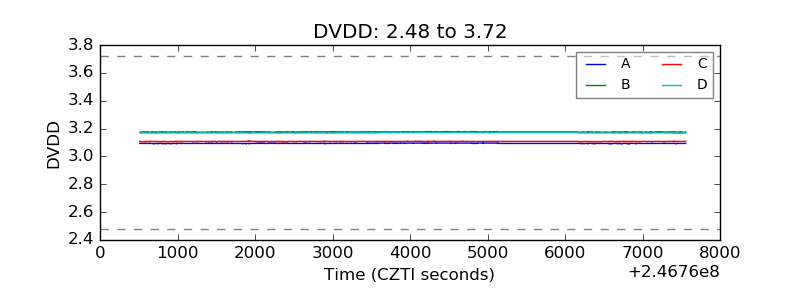 |
| Temperature 1 | 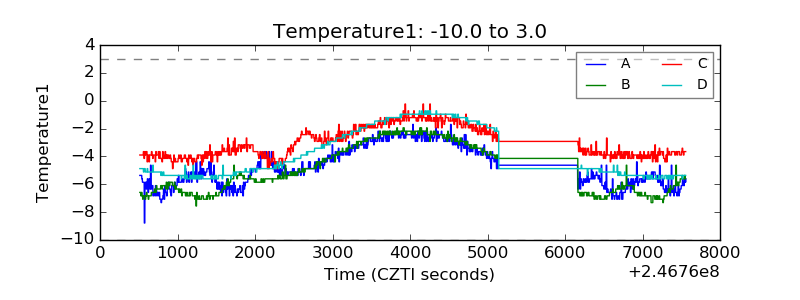 |
| Veto HV Monitor |  |
| Veto LLD | 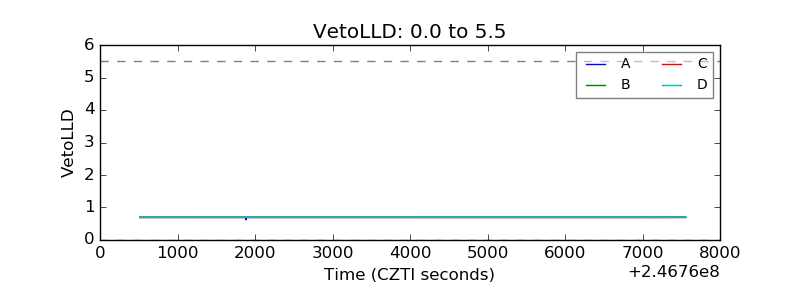 |
| Alpha Counter | 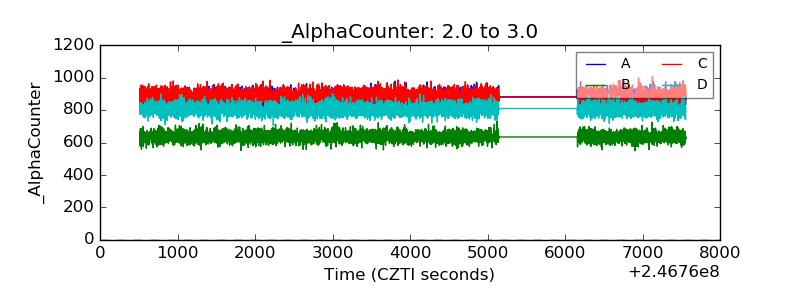 |
| _CPM_Rate | 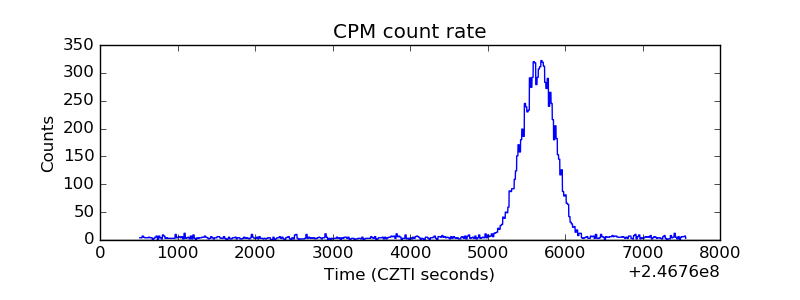 |
| CZT Counter | 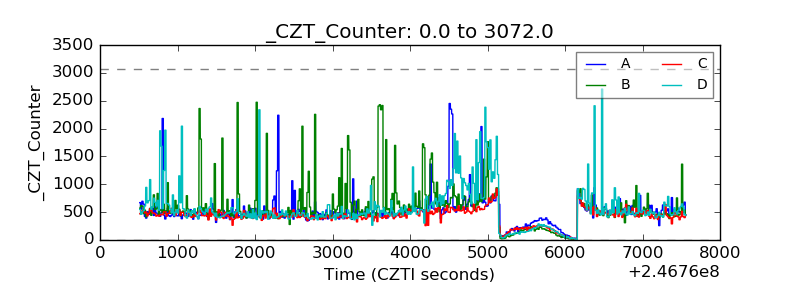 |
| +2.5 Volts monitor |  |
| +5 Volts monitor |  |
| _ROLL_ROT | 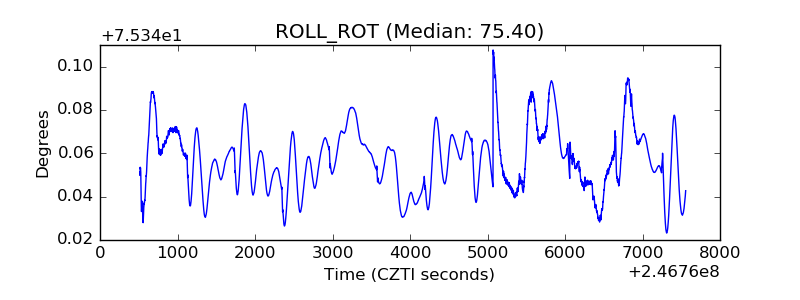 |
| _Roll_DEC |  |
| _Roll_RA | 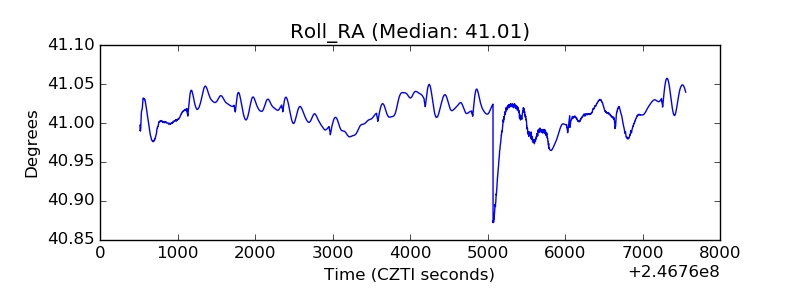 |
| Veto Counter | 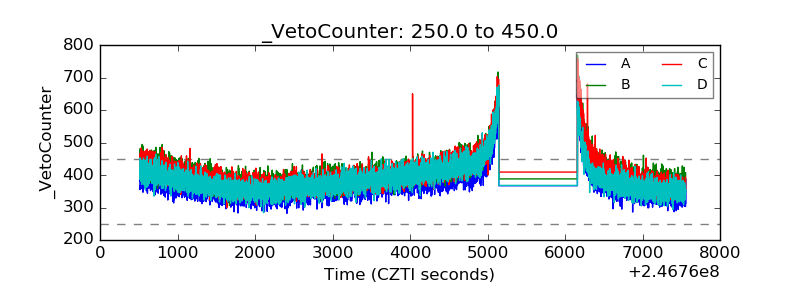 |