| Param | Original file | Final file |
|---|---|---|
| Filename | modeM0/AS1T01_202T01_9000001640_11250cztM0_level2.evt | modeM0/AS1T01_202T01_9000001640_11250cztM0_level2_quad_clean.evt |
| Size (bytes) | 741,326,400 | 105,022,080 |
| Size | 707.0 MB | 100.2 MB |
| Events in quadrant A | 3,516,456 | 780,806 |
| Events in quadrant B | 3,945,511 | 774,513 |
| Events in quadrant C | 10,446,956 | 439,094 |
| Events in quadrant D | 4,103,425 | 732,897 |
| Mode M9 | |||
|---|---|---|---|
| Quadrant | BADHDUFLAG | Total packets | Discarded packets |
| A | 0 | 2 | 0 |
| B | 0 | 2 | 0 |
| C | 0 | 2 | 0 |
| D | 0 | 2 | 0 |
| Mode M0 | |||
|---|---|---|---|
| Quadrant | BADHDUFLAG | Total packets | Discarded packets |
| A | 0 | 14598 | 2 |
| B | 0 | 15939 | 1 |
| C | 0 | 35512 | 1 |
| D | 0 | 16375 | 1 |
| Mode SS | |||
|---|---|---|---|
| Quadrant | BADHDUFLAG | Total packets | Discarded packets |
| A | 0 | 130 | 0 |
| B | 0 | 130 | 0 |
| C | 0 | 130 | 0 |
| D | 0 | 130 | 0 |
| Quadrant | Total seconds | Saturated seconds | Saturation percentage |
|---|---|---|---|
| A | 6480 | 208 | 3.209877% |
| B | 6480 | 312 | 4.814815% |
| C | 6480 | 3906 | 60.277778% |
| D | 6480 | 340 | 5.246914% |
Noise dominated data is calculated using 1-second bins in cleaned event files. If a bin has >2000 counts, and if more than 50% of those come from <1% of pixels, then it is considered to be noise-dominated and hence unusable.
| Quadrant | # 1 sec bins | Bins with >0 counts | Bins with >2000 counts | High rate bins dominated by noise | Noise dominated (total time) | Noise dominated (detector-on time) | Marked lightcurve |
|---|---|---|---|---|---|---|---|
| A | 6660 | 6481 | 27 | 27 | 0.41% | 0.42% | 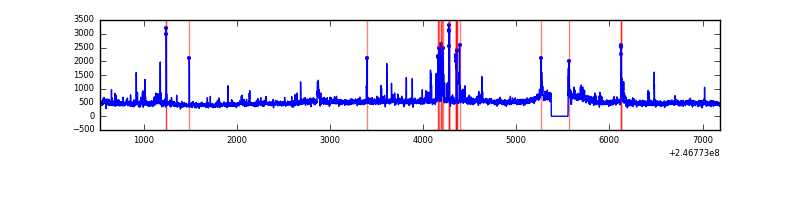 |
| B | 6660 | 6481 | 60 | 60 | 0.90% | 0.93% | 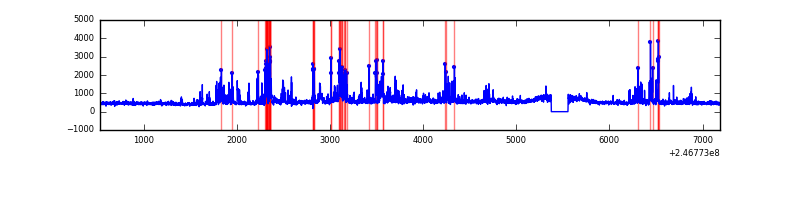 |
| C | 6660 | 6481 | 2420 | 2420 | 36.34% | 37.34% | 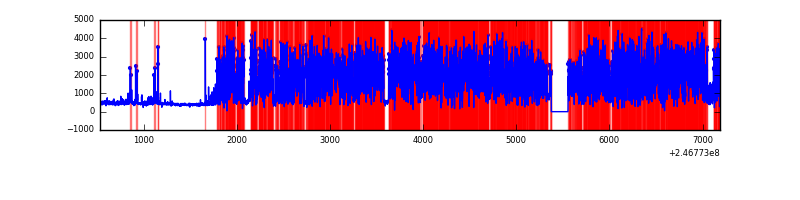 |
| D | 6660 | 6481 | 190 | 190 | 2.85% | 2.93% | 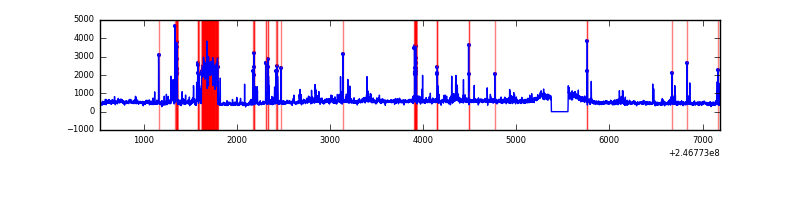 |
Top three noisy pixels from each quadrant. If the there are fewer than three noisy pixels in the level2.evt file, extra rows are filled as -1
| Pixel properties | Quadrant properties | ||||||
|---|---|---|---|---|---|---|---|
| Quadrant | DetID | PixID | Counts | Sigma | Mean | Median | Sigma |
| A | 14 | 238 | 218673 | 1202.97 | 806 | 788 | 181.1 |
| A | 8 | 5 | 82368 | 450.41 | 806 | 788 | 181.1 |
| A | 8 | 15 | 30702 | 165.16 | 806 | 788 | 181.1 |
| B | 4 | 239 | 602685 | 3692.56 | 807 | 790 | 163.0 |
| B | 11 | 51 | 89813 | 546.14 | 807 | 790 | 163.0 |
| B | 15 | 204 | 44347 | 267.21 | 807 | 790 | 163.0 |
| C | 4 | 254 | 8418467 | 68073.09 | 516 | 522 | 123.7 |
| C | 4 | 238 | 13090 | 101.63 | 516 | 522 | 123.7 |
| C | 13 | 61 | 3732 | 25.96 | 516 | 522 | 123.7 |
| D | 13 | 152 | 477727 | 2183.75 | 766 | 751 | 218.4 |
| D | 8 | 195 | 286849 | 1309.85 | 766 | 751 | 218.4 |
| D | 5 | 222 | 95573 | 434.13 | 766 | 751 | 218.4 |
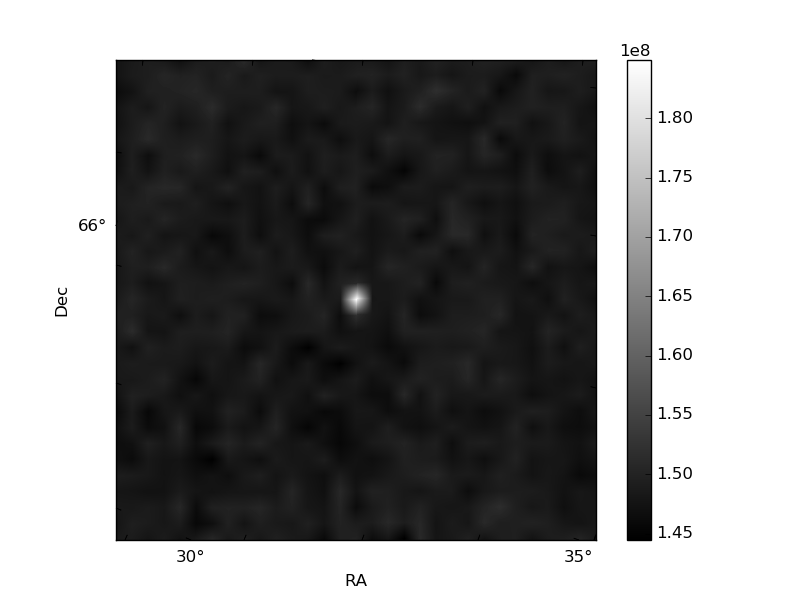
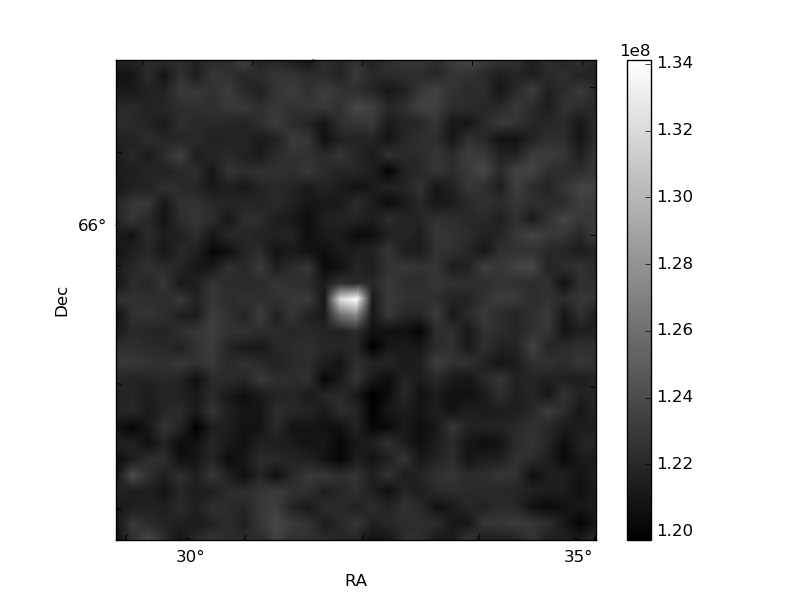
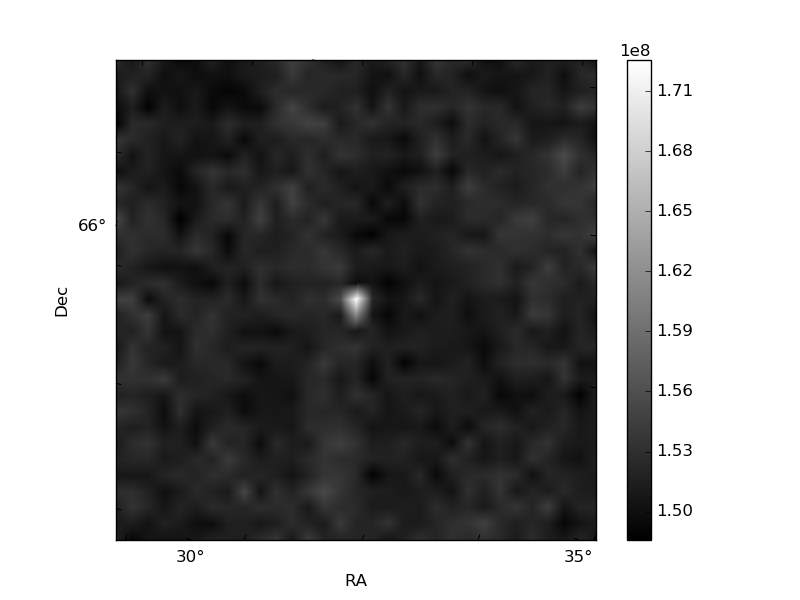
Histogram calculated using DETX and DETY for each event in the final _common_clean file
| Quadrant A | 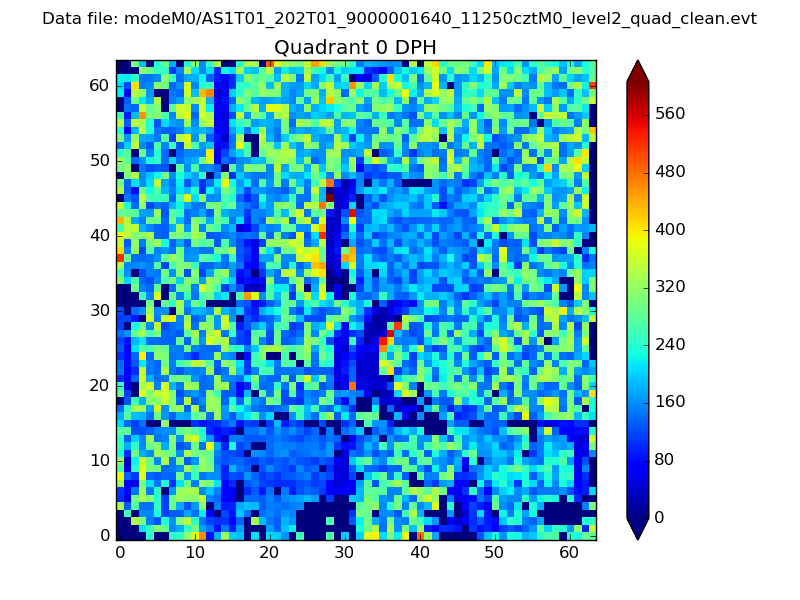 |
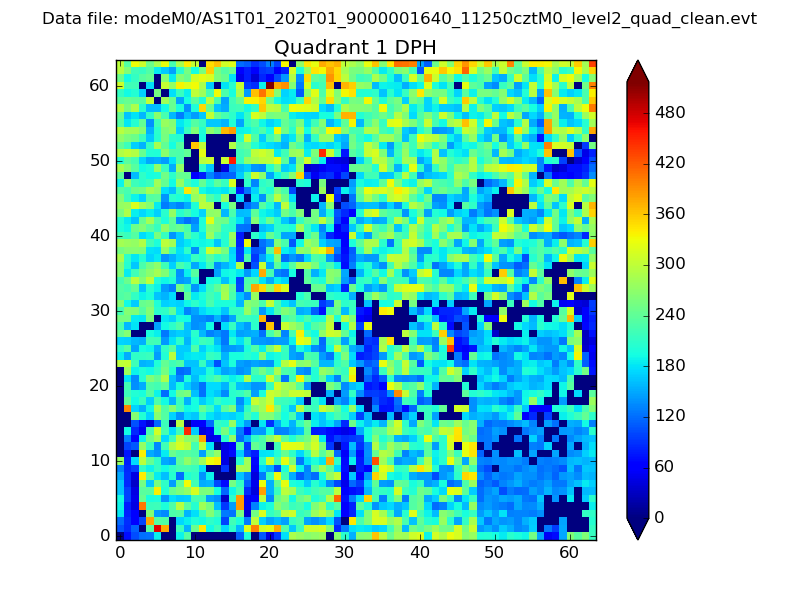 |
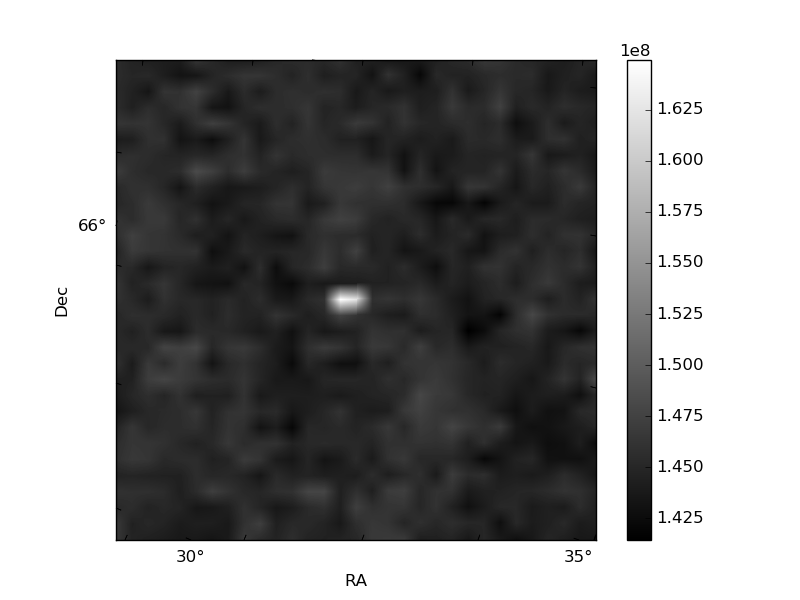
Quadrant B |
|---|---|---|---|
| Quadrant D | 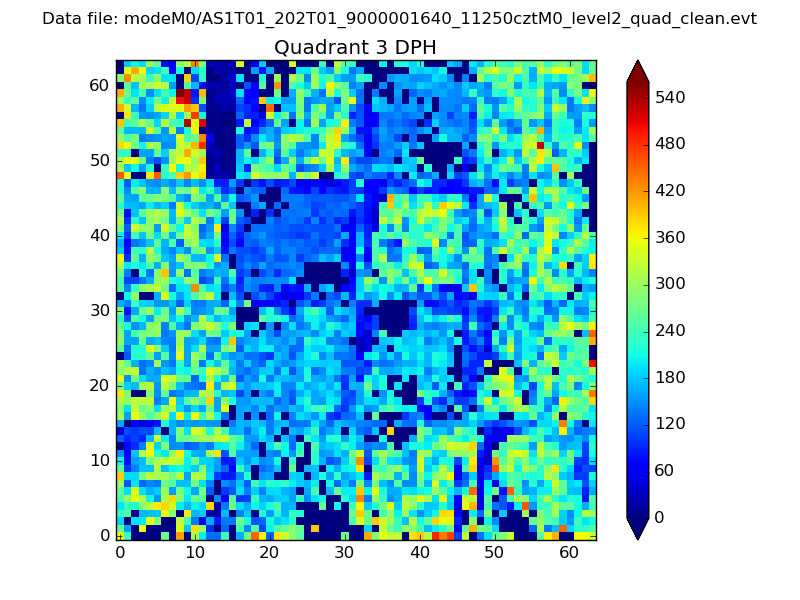 |
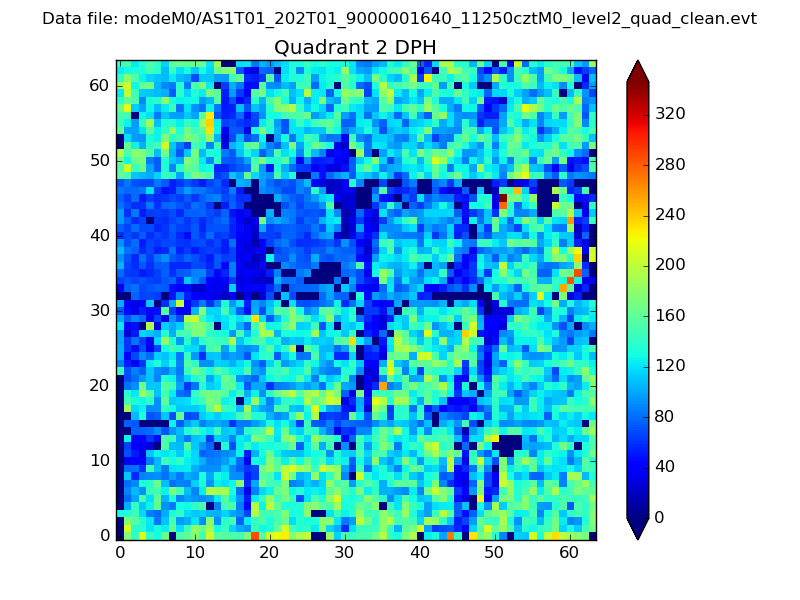 |
Quadrant C |
| Plot type | Count rate plots | Images |
|---|---|---|
| Comparison with Poisson distribution Blue bars denote a histogram of data divided into 1 sec bins. Red curve is a Poisson curve with rate = median count rate of data. |
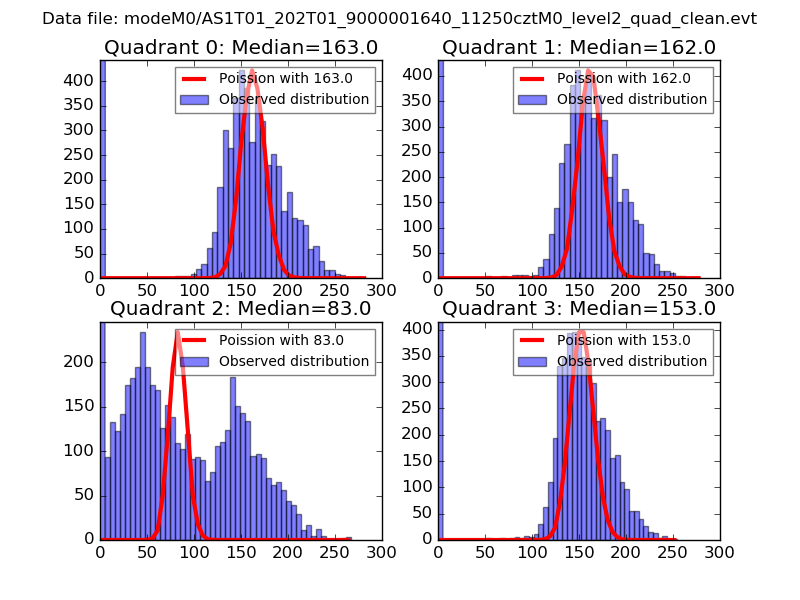 |
 |
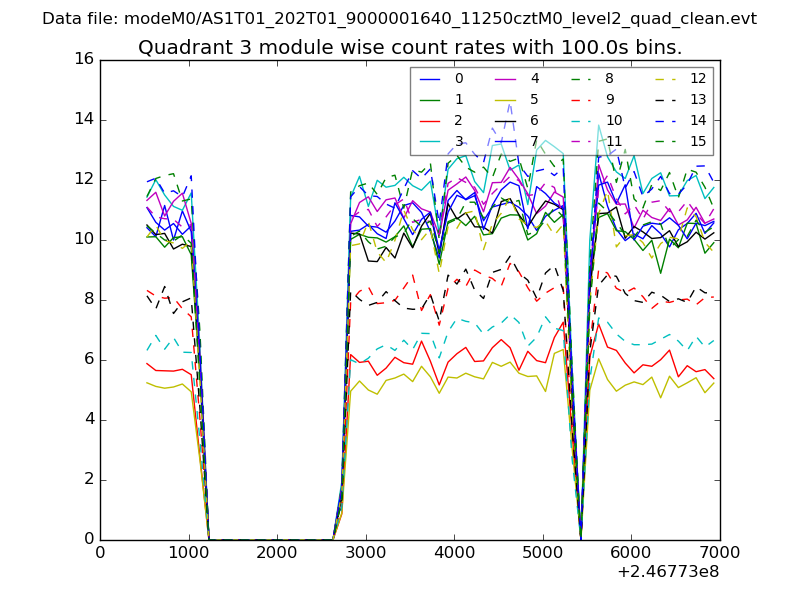
| Quadrant-wise count rates Data is divided into 100 sec bins |
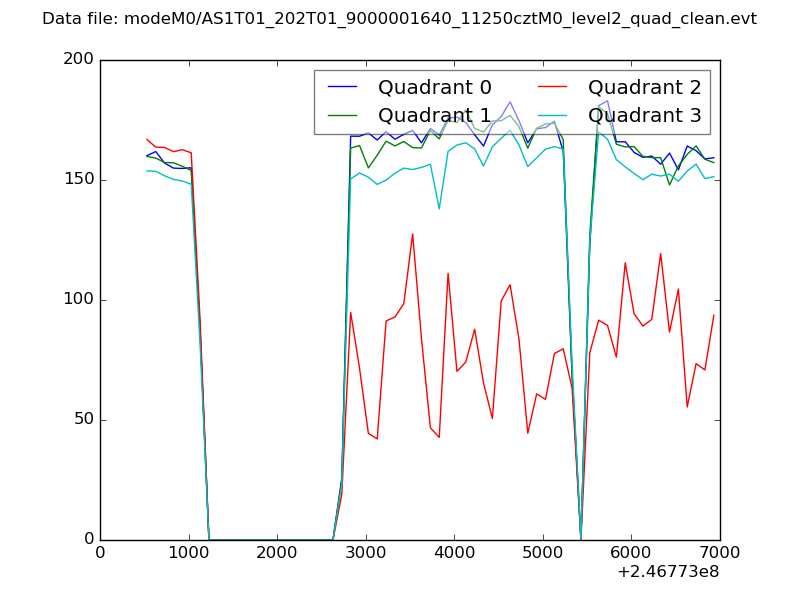 |
|
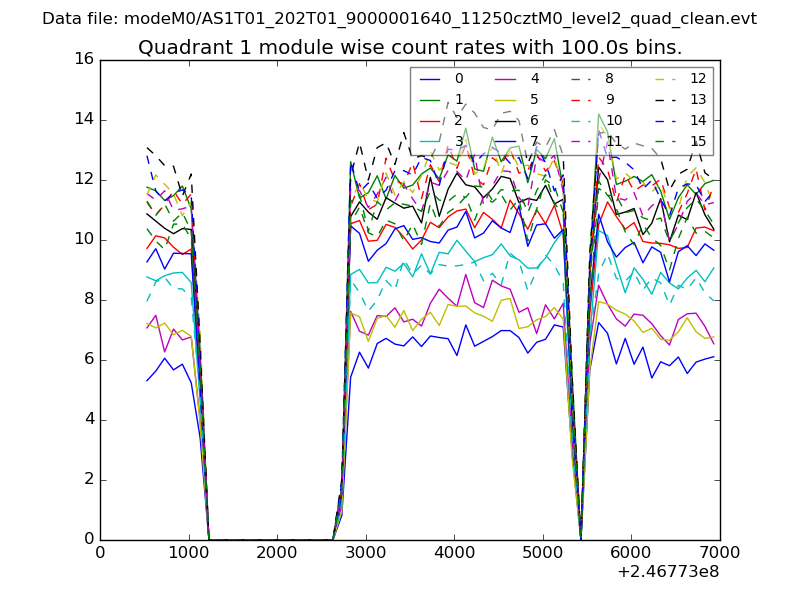
| Module-wise count rates for Quadrant A Data is divided into 100 sec bins |
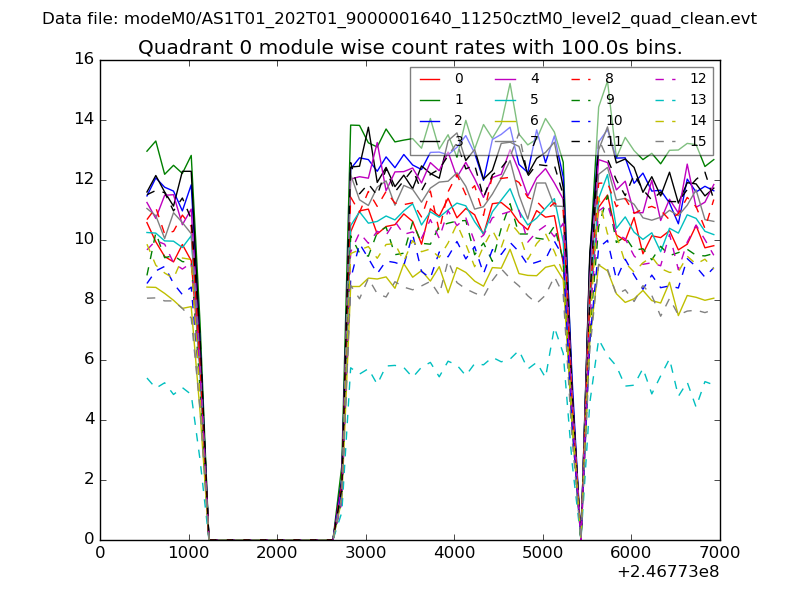 |
 |
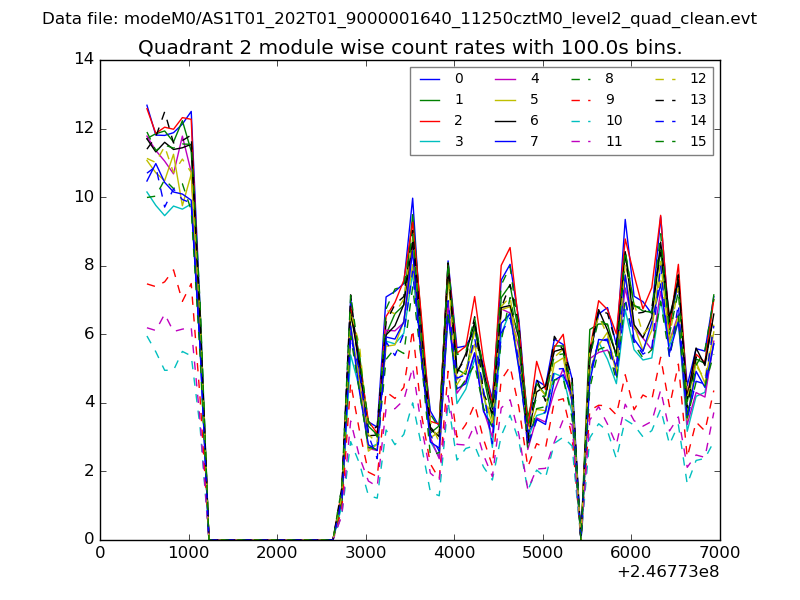
| Module-wise count rates for Quadrant B Data is divided into 100 sec bins |
 |
 |
| Module-wise count rates for Quadrant C Data is divided into 100 sec bins |
 |
 |
| Module-wise count rates for Quadrant D Data is divided into 100 sec bins |
 |
 |
| Parameter | Plot |
|---|---|
| CZT HV Monitor | 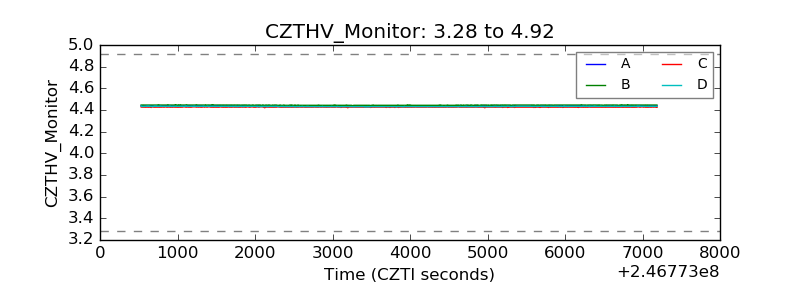 |
| D_VDD | 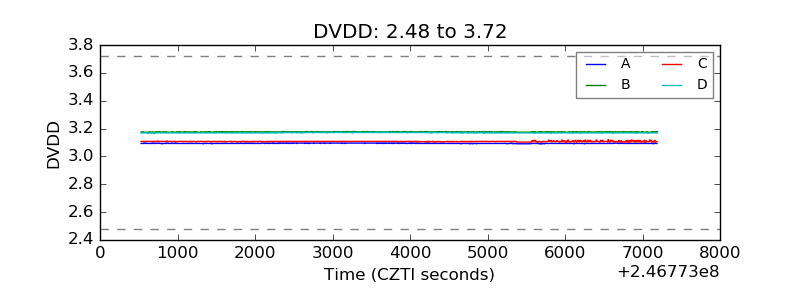 |
| Temperature 1 | 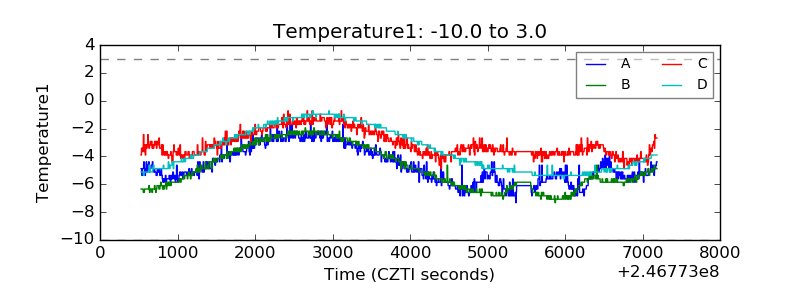 |
| Veto HV Monitor | 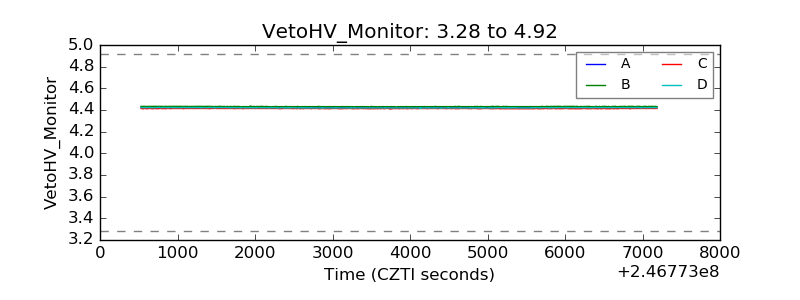 |
| Veto LLD | 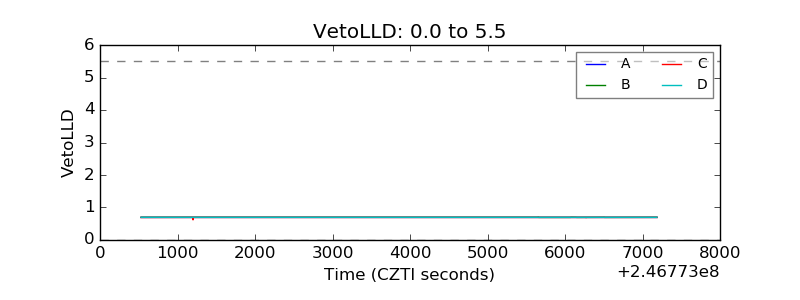 |
| Alpha Counter | 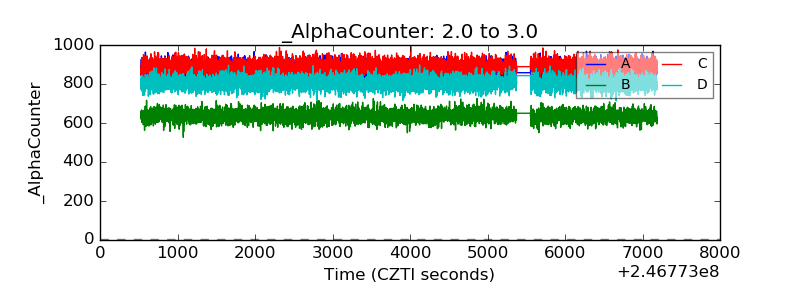 |
| _CPM_Rate | 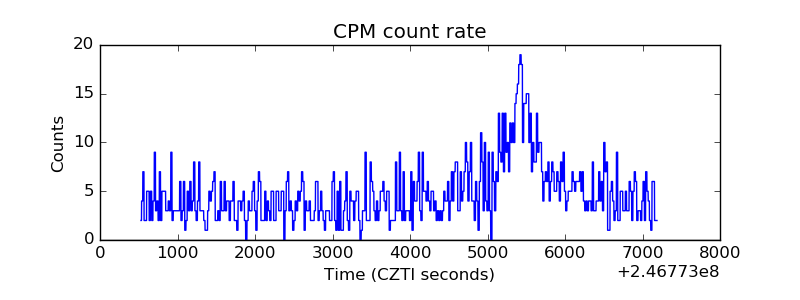 |
| CZT Counter | 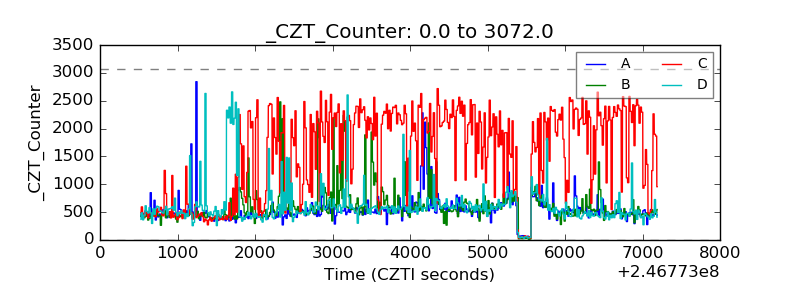 |
| +2.5 Volts monitor |  |
| +5 Volts monitor |  |
| _ROLL_ROT | 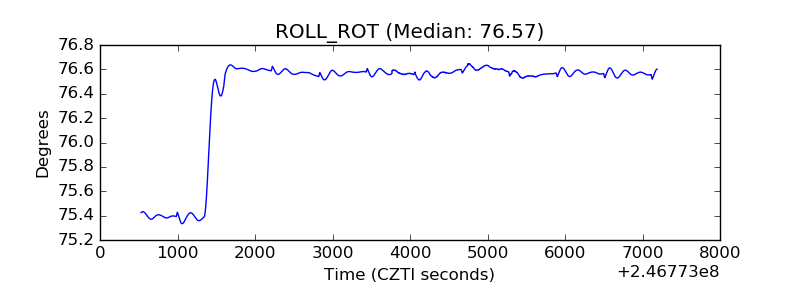 |
| _Roll_DEC | 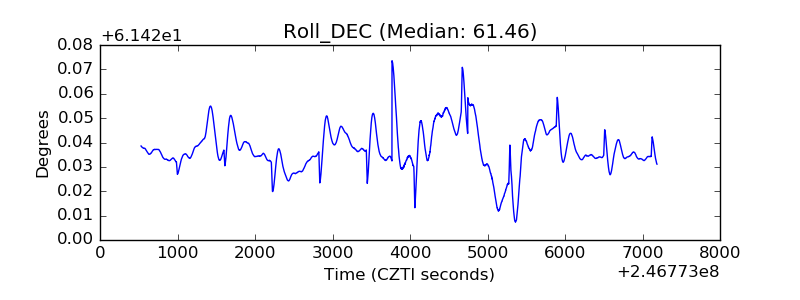 |
| _Roll_RA | 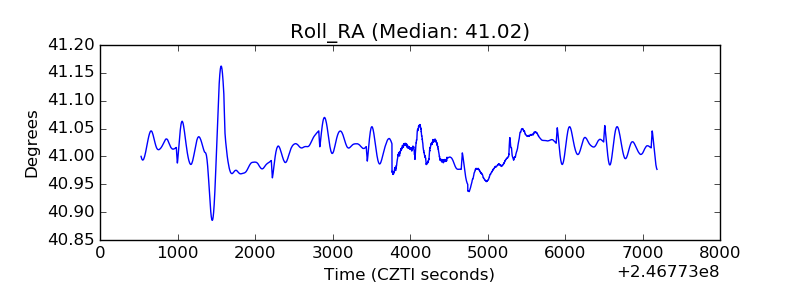 |
| Veto Counter | 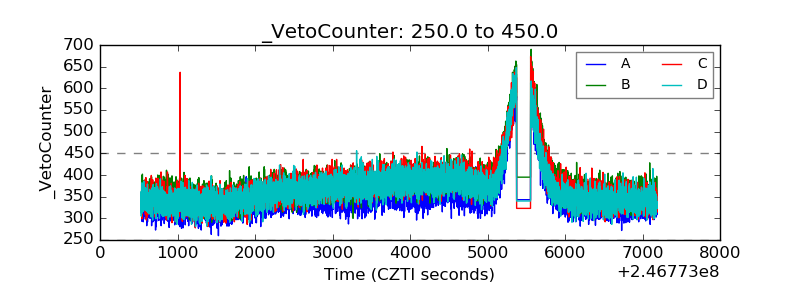 |