| Param | Original file | Final file |
|---|---|---|
| Filename | modeM0/AS1T01_202T01_9000001640_11251cztM0_level2.evt | modeM0/AS1T01_202T01_9000001640_11251cztM0_level2_quad_clean.evt |
| Size (bytes) | 599,950,080 | 108,046,080 |
| Size | 572.2 MB | 103.0 MB |
| Events in quadrant A | 3,824,692 | 721,905 |
| Events in quadrant B | 3,936,587 | 728,386 |
| Events in quadrant C | 5,670,184 | 687,821 |
| Events in quadrant D | 4,291,638 | 674,439 |
| Mode M0 | |||
|---|---|---|---|
| Quadrant | BADHDUFLAG | Total packets | Discarded packets |
| A | 0 | 15615 | 3 |
| B | 0 | 15890 | 2 |
| C | 0 | 21234 | 2 |
| D | 0 | 17163 | 2 |
| Mode SS | |||
|---|---|---|---|
| Quadrant | BADHDUFLAG | Total packets | Discarded packets |
| A | 0 | 134 | 0 |
| B | 0 | 134 | 0 |
| C | 0 | 134 | 0 |
| D | 0 | 134 | 0 |
| Quadrant | Total seconds | Saturated seconds | Saturation percentage |
|---|---|---|---|
| A | 6574 | 347 | 5.278369% |
| B | 6574 | 353 | 5.369638% |
| C | 6574 | 1046 | 15.911165% |
| D | 6574 | 483 | 7.347125% |
Noise dominated data is calculated using 1-second bins in cleaned event files. If a bin has >2000 counts, and if more than 50% of those come from <1% of pixels, then it is considered to be noise-dominated and hence unusable.
| Quadrant | # 1 sec bins | Bins with >0 counts | Bins with >2000 counts | High rate bins dominated by noise | Noise dominated (total time) | Noise dominated (detector-on time) | Marked lightcurve |
|---|---|---|---|---|---|---|---|
| A | 6649 | 6576 | 84 | 84 | 1.26% | 1.28% |  |
| B | 6649 | 6576 | 61 | 61 | 0.92% | 0.93% |  |
| C | 6649 | 6576 | 569 | 569 | 8.56% | 8.65% |  |
| D | 6649 | 6576 | 266 | 266 | 4.00% | 4.05% |  |
Top three noisy pixels from each quadrant. If the there are fewer than three noisy pixels in the level2.evt file, extra rows are filled as -1
| Pixel properties | Quadrant properties | ||||||
|---|---|---|---|---|---|---|---|
| Quadrant | DetID | PixID | Counts | Sigma | Mean | Median | Sigma |
| A | 14 | 238 | 334073 | 1835.99 | 813 | 796 | 181.5 |
| A | 8 | 5 | 131908 | 722.28 | 813 | 796 | 181.5 |
| A | 1 | 162 | 52240 | 283.4 | 813 | 796 | 181.5 |
| B | 4 | 239 | 522466 | 3168.15 | 817 | 800 | 164.7 |
| B | 11 | 51 | 101686 | 612.69 | 817 | 800 | 164.7 |
| B | 15 | 204 | 46981 | 280.46 | 817 | 800 | 164.7 |
| C | 4 | 254 | 2699396 | 14946.35 | 756 | 766 | 180.6 |
| C | 4 | 238 | 9870 | 50.42 | 756 | 766 | 180.6 |
| C | 8 | 222 | 6578 | 32.19 | 756 | 766 | 180.6 |
| D | 13 | 152 | 695456 | 3493.97 | 779 | 756 | 198.8 |
| D | 1 | 52 | 161049 | 806.19 | 779 | 756 | 198.8 |
| D | 8 | 195 | 112370 | 561.36 | 779 | 756 | 198.8 |
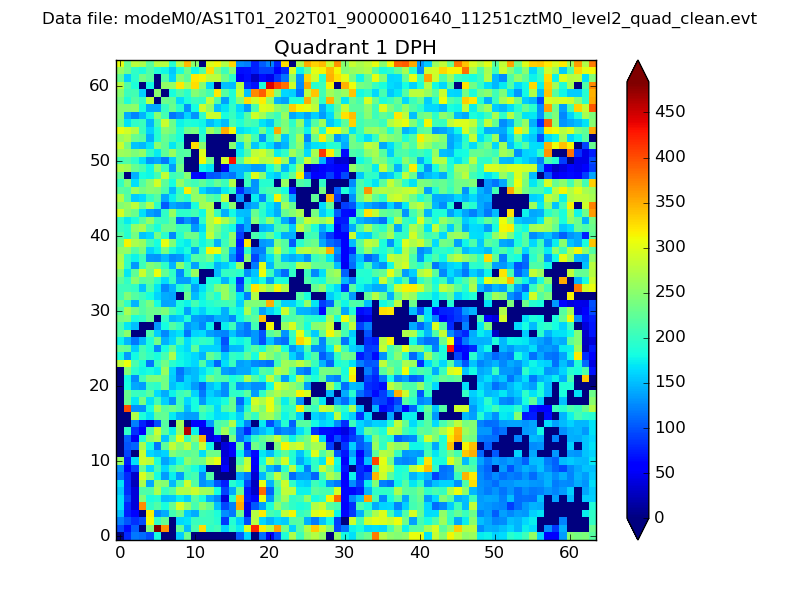
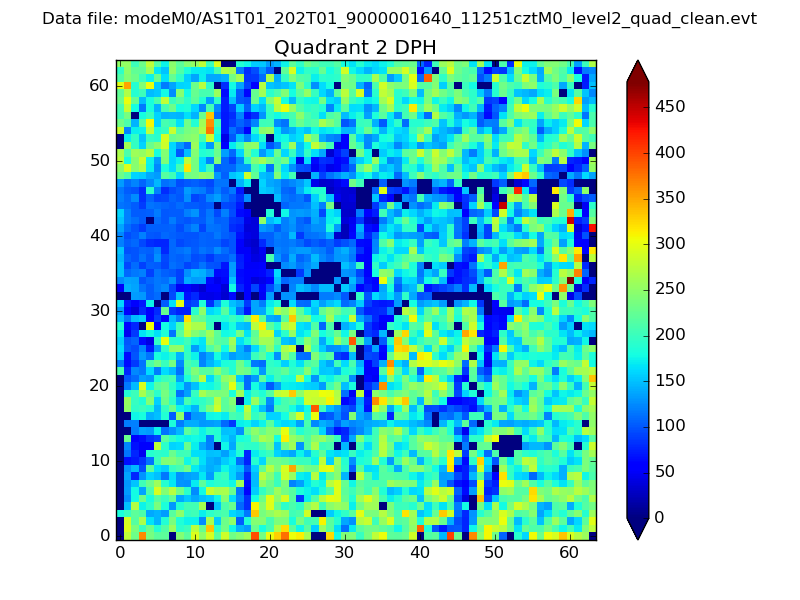
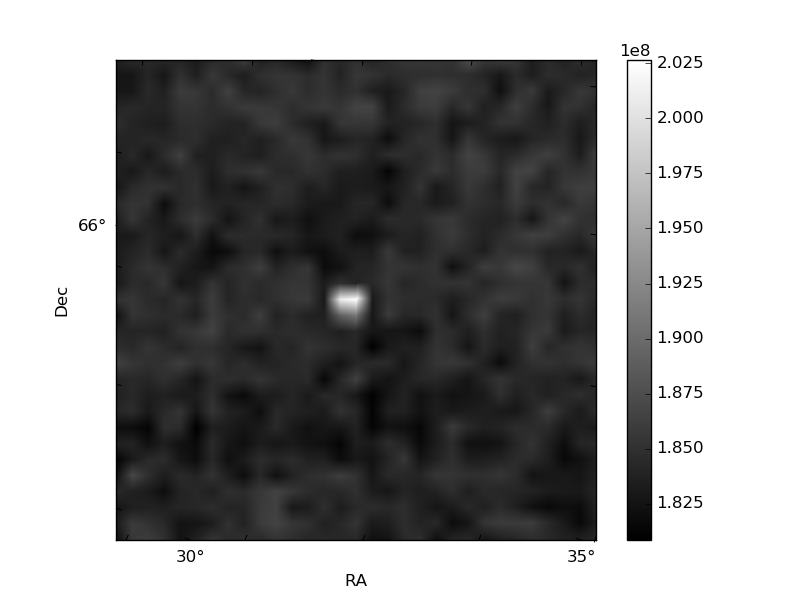
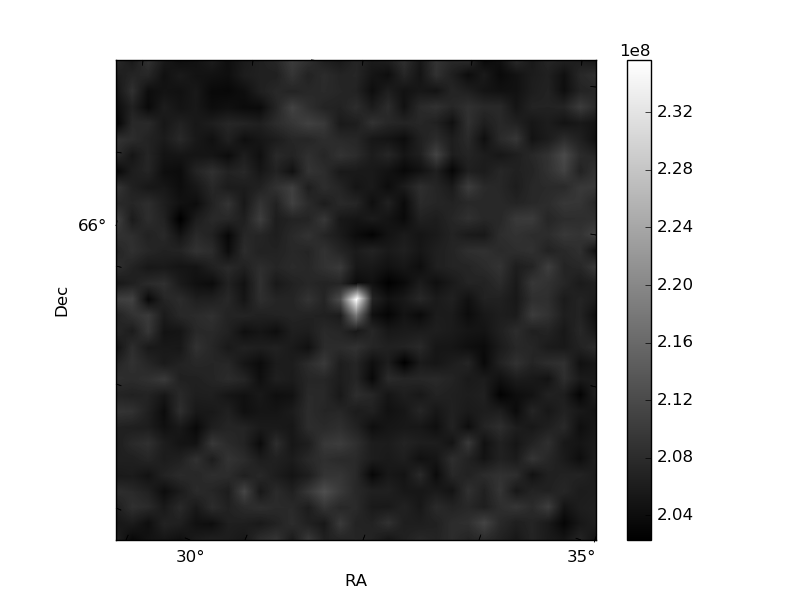
Histogram calculated using DETX and DETY for each event in the final _common_clean file
| Quadrant A | 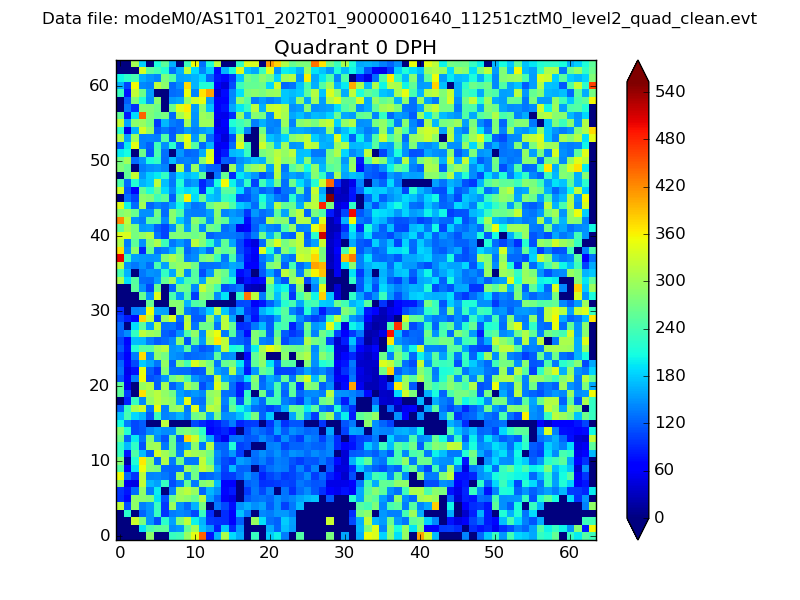 |
 |
Quadrant B |
|---|---|---|---|
| Quadrant D | 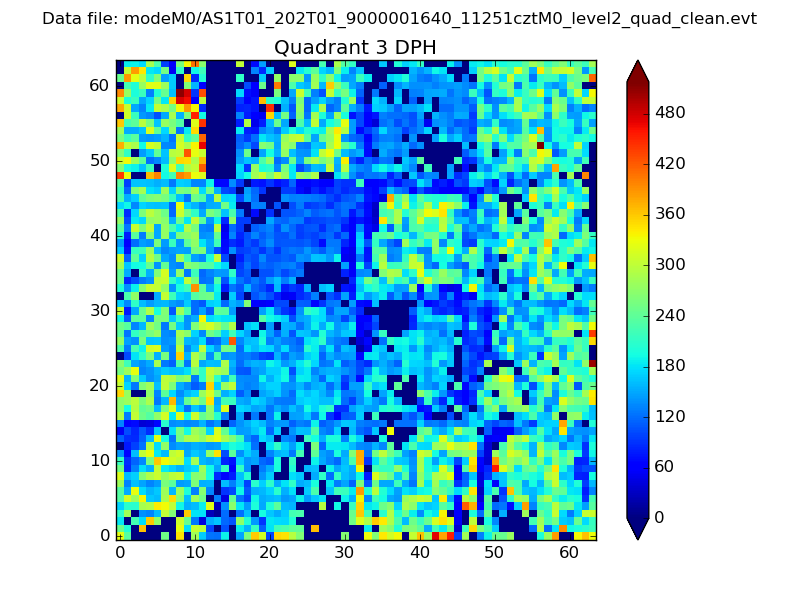 |
 |
Quadrant C |
| Plot type | Count rate plots | Images |
|---|---|---|
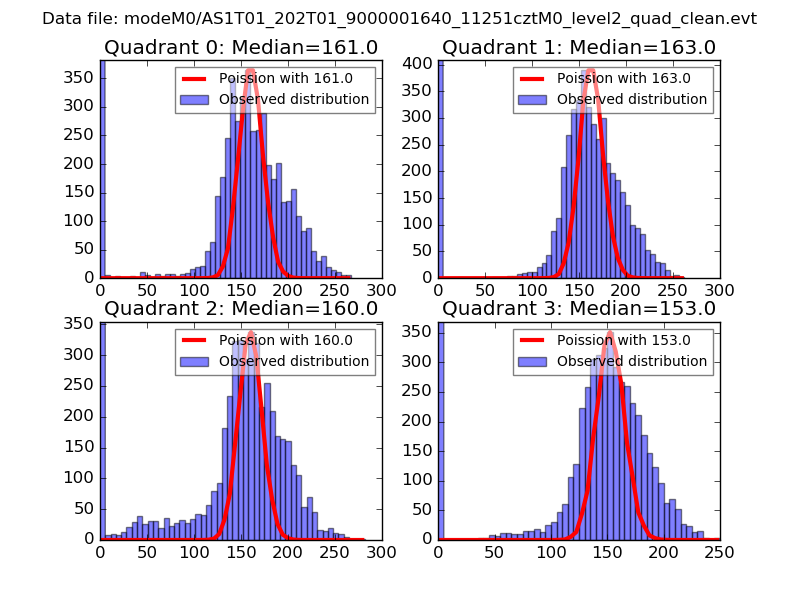
| Comparison with Poisson distribution Blue bars denote a histogram of data divided into 1 sec bins. Red curve is a Poisson curve with rate = median count rate of data. |
 |
 |
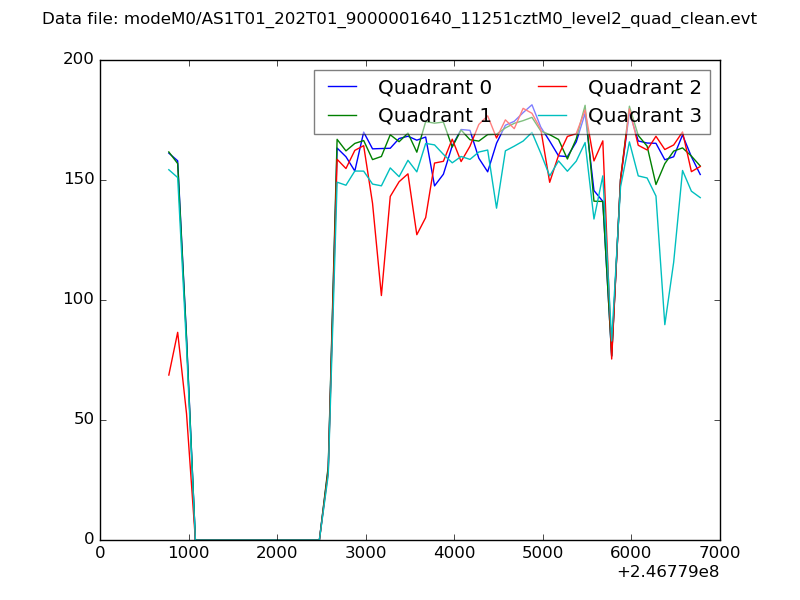
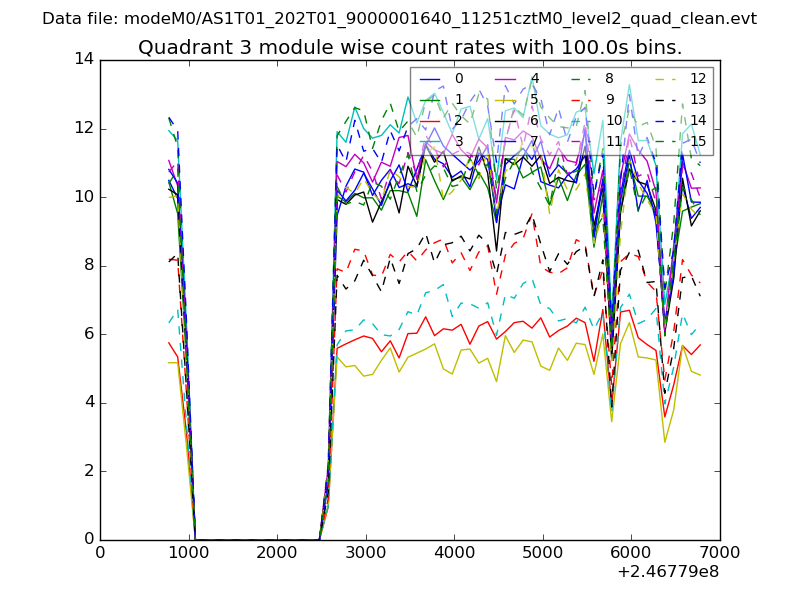
| Quadrant-wise count rates Data is divided into 100 sec bins |
 |
|
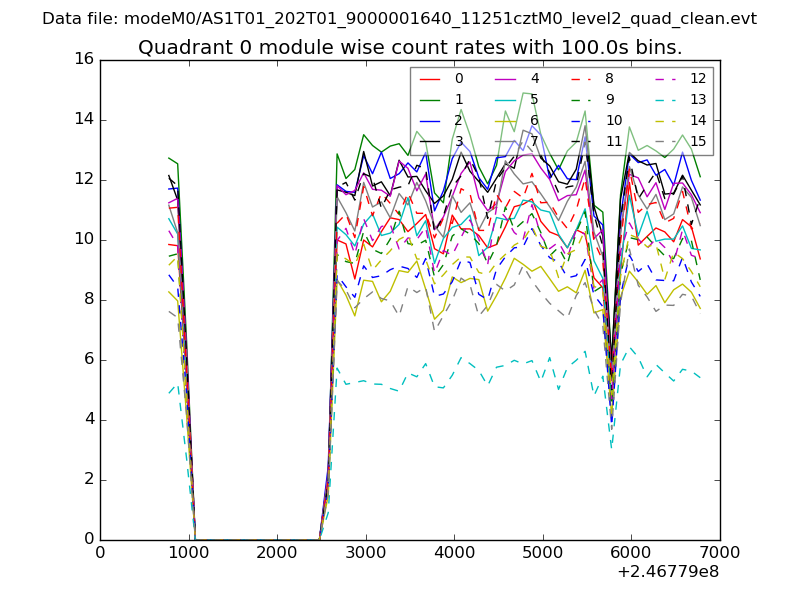
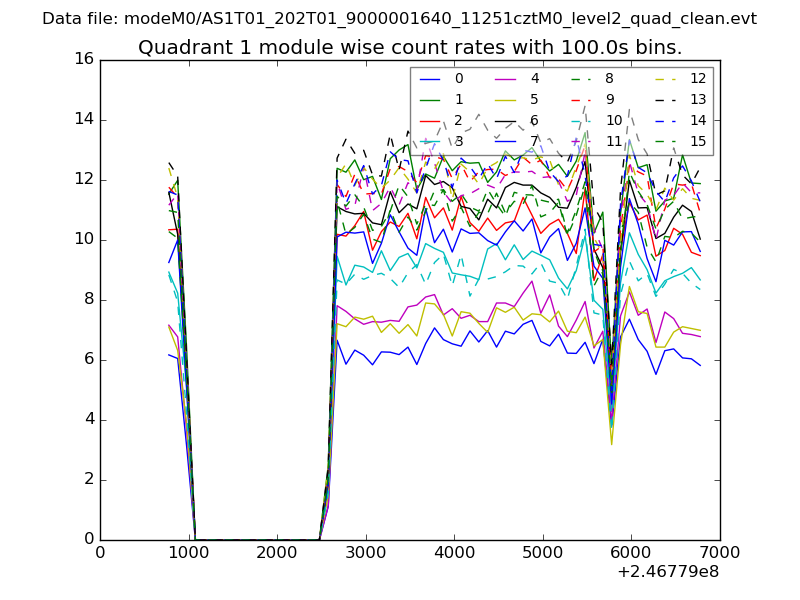
| Module-wise count rates for Quadrant A Data is divided into 100 sec bins |
 |
 |
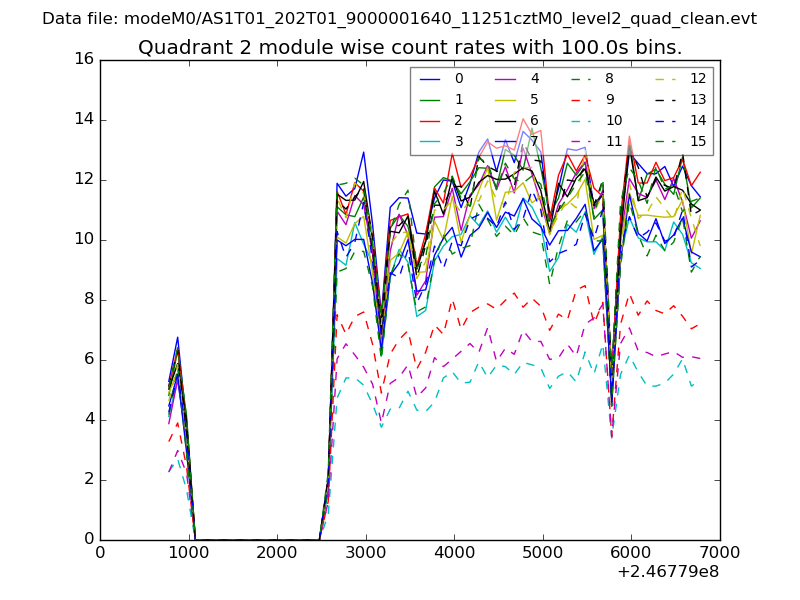
| Module-wise count rates for Quadrant B Data is divided into 100 sec bins |
 |
 |
| Module-wise count rates for Quadrant C Data is divided into 100 sec bins |
 |
 |
| Module-wise count rates for Quadrant D Data is divided into 100 sec bins |
 |
 |
| Parameter | Plot |
|---|---|
| CZT HV Monitor |  |
| D_VDD | 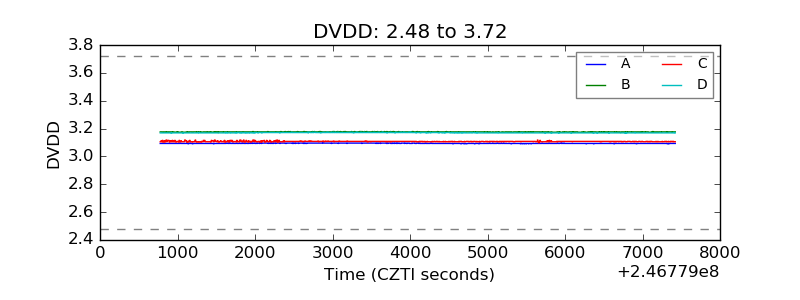 |
| Temperature 1 |  |
| Veto HV Monitor | 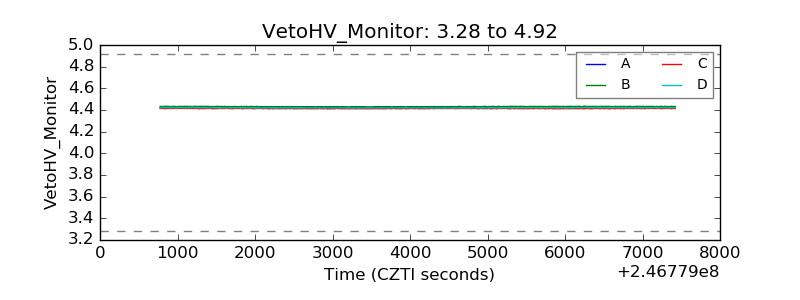 |
| Veto LLD |  |
| Alpha Counter | 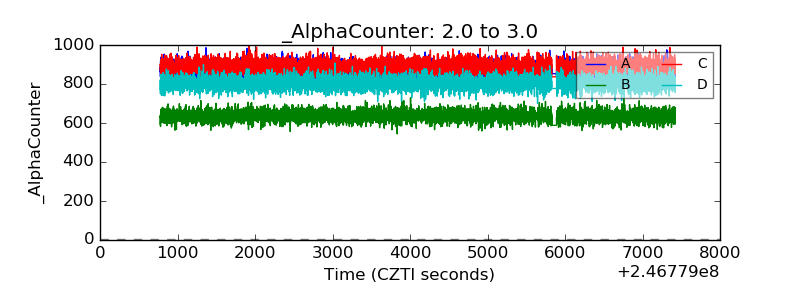 |
| _CPM_Rate | 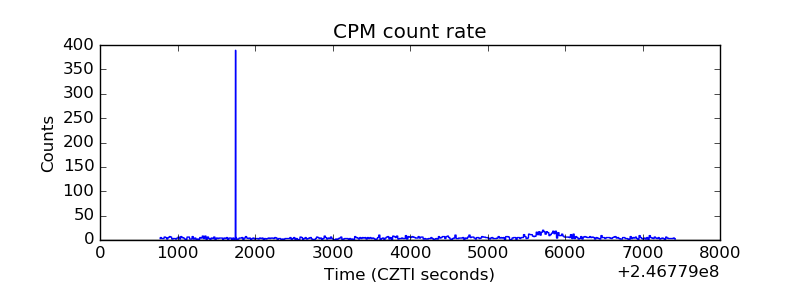 |
| CZT Counter | 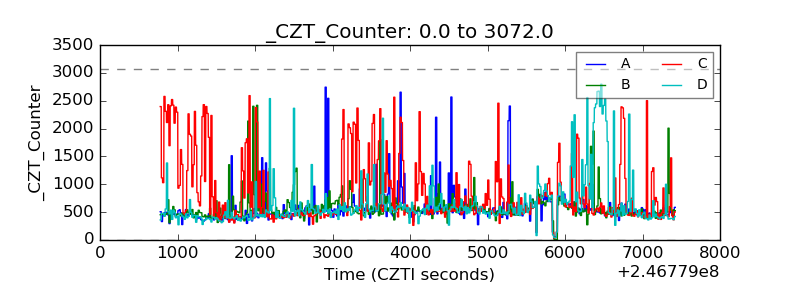 |
| +2.5 Volts monitor |  |
| +5 Volts monitor |  |
| _ROLL_ROT |  |
| _Roll_DEC |  |
| _Roll_RA | 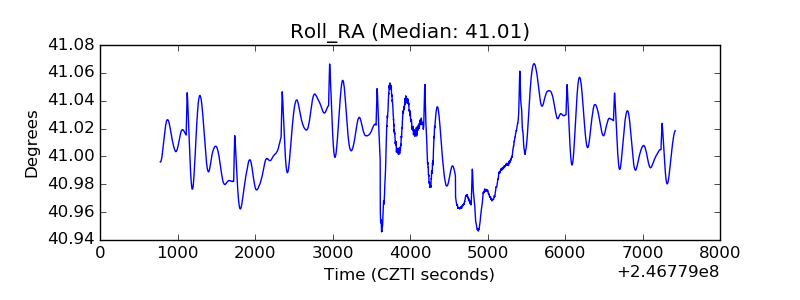 |
| Veto Counter | 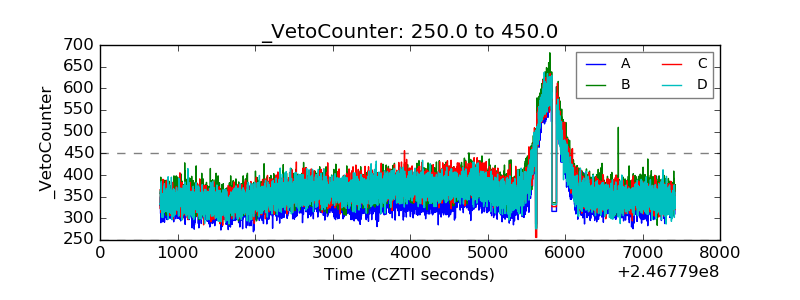 |