| Param | Original file | Final file |
|---|---|---|
| Filename | modeM0/AS1T01_202T01_9000001640_11252cztM0_level2.evt | modeM0/AS1T01_202T01_9000001640_11252cztM0_level2_quad_clean.evt |
| Size (bytes) | 564,255,360 | 101,917,440 |
| Size | 538.1 MB | 97.2 MB |
| Events in quadrant A | 3,880,837 | 669,202 |
| Events in quadrant B | 4,049,040 | 661,936 |
| Events in quadrant C | 3,750,305 | 666,974 |
| Events in quadrant D | 4,950,880 | 617,921 |
| Mode M9 | |||
|---|---|---|---|
| Quadrant | BADHDUFLAG | Total packets | Discarded packets |
| A | 0 | 3 | 0 |
| B | 0 | 3 | 0 |
| C | 0 | 3 | 0 |
| D | 0 | 3 | 0 |
| Mode M0 | |||
|---|---|---|---|
| Quadrant | BADHDUFLAG | Total packets | Discarded packets |
| A | 0 | 15896 | 158 |
| B | 0 | 16374 | 134 |
| C | 0 | 15716 | 120 |
| D | 0 | 19283 | 189 |
| Mode SS | |||
|---|---|---|---|
| Quadrant | BADHDUFLAG | Total packets | Discarded packets |
| A | 0 | 138 | 2 |
| B | 0 | 138 | 2 |
| C | 0 | 138 | 0 |
| D | 0 | 138 | 0 |
| Quadrant | Total seconds | Saturated seconds | Saturation percentage |
|---|---|---|---|
| A | 6749 | 190 | 2.815232% |
| B | 6747 | 271 | 4.016600% |
| C | 6749 | 228 | 3.378278% |
| D | 6746 | 545 | 8.078862% |
Noise dominated data is calculated using 1-second bins in cleaned event files. If a bin has >2000 counts, and if more than 50% of those come from <1% of pixels, then it is considered to be noise-dominated and hence unusable.
| Quadrant | # 1 sec bins | Bins with >0 counts | Bins with >2000 counts | High rate bins dominated by noise | Noise dominated (total time) | Noise dominated (detector-on time) | Marked lightcurve |
|---|---|---|---|---|---|---|---|
| A | 7185 | 6755 | 54 | 54 | 0.75% | 0.80% | 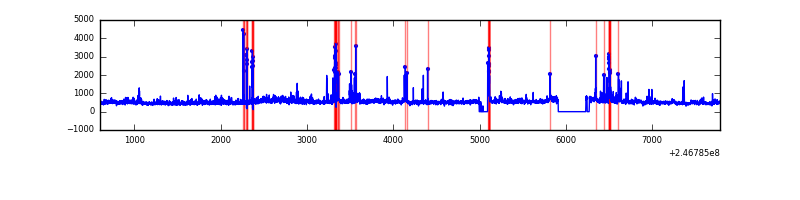 |
| B | 7185 | 6754 | 110 | 110 | 1.53% | 1.63% | 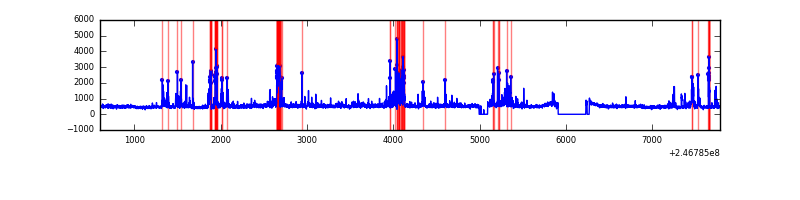 |
| C | 7185 | 6758 | 114 | 114 | 1.59% | 1.69% | 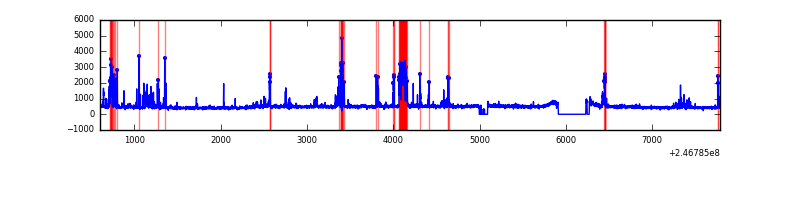 |
| D | 7185 | 6754 | 391 | 391 | 5.44% | 5.79% | 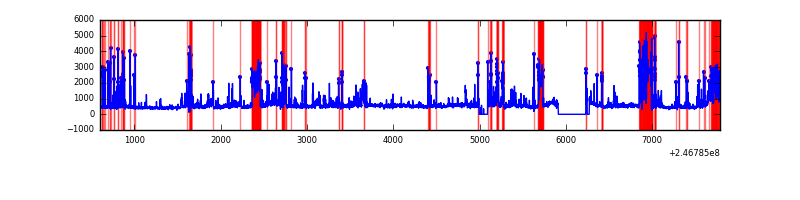 |
Top three noisy pixels from each quadrant. If the there are fewer than three noisy pixels in the level2.evt file, extra rows are filled as -1
| Pixel properties | Quadrant properties | ||||||
|---|---|---|---|---|---|---|---|
| Quadrant | DetID | PixID | Counts | Sigma | Mean | Median | Sigma |
| A | 14 | 238 | 267457 | 1456.02 | 826 | 809 | 183.1 |
| A | 8 | 5 | 174088 | 946.18 | 826 | 809 | 183.1 |
| A | 1 | 162 | 76896 | 415.47 | 826 | 809 | 183.1 |
| B | 4 | 239 | 619171 | 3752.58 | 823 | 807 | 164.8 |
| B | 11 | 51 | 100435 | 604.6 | 823 | 807 | 164.8 |
| B | 15 | 204 | 66294 | 397.41 | 823 | 807 | 164.8 |
| C | 4 | 254 | 566454 | 2977.04 | 799 | 809 | 190.0 |
| C | 9 | 204 | 68388 | 355.67 | 799 | 809 | 190.0 |
| C | 13 | 61 | 5876 | 26.67 | 799 | 809 | 190.0 |
| D | 13 | 152 | 529099 | 2684.81 | 770 | 749 | 196.8 |
| D | 10 | 253 | 525536 | 2666.7 | 770 | 749 | 196.8 |
| D | 13 | 104 | 449294 | 2279.28 | 770 | 749 | 196.8 |
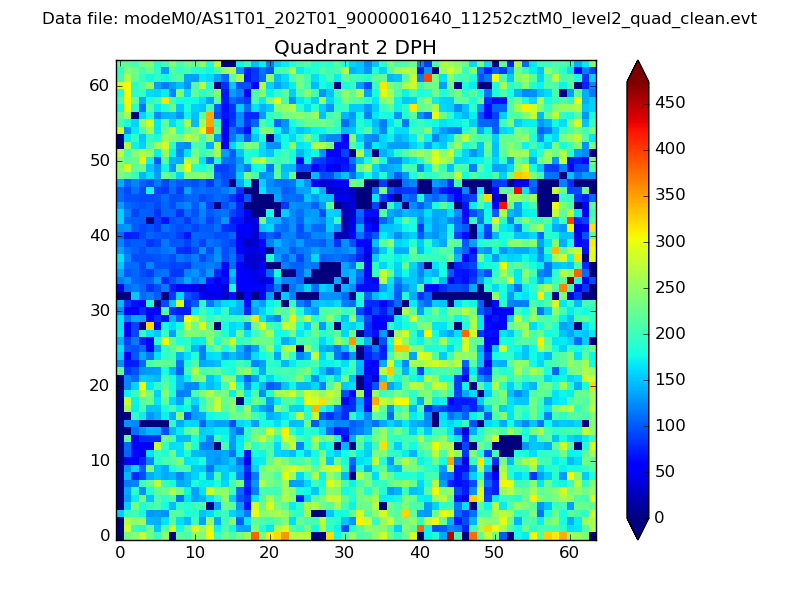
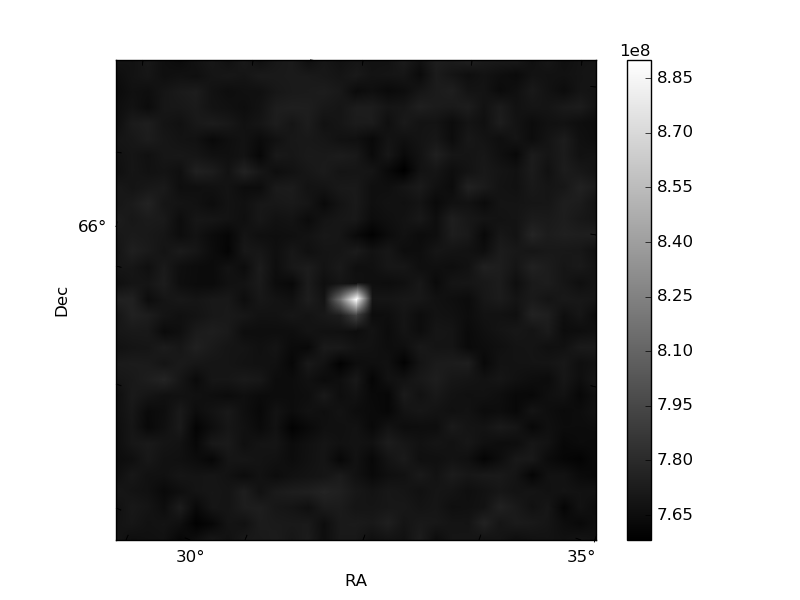
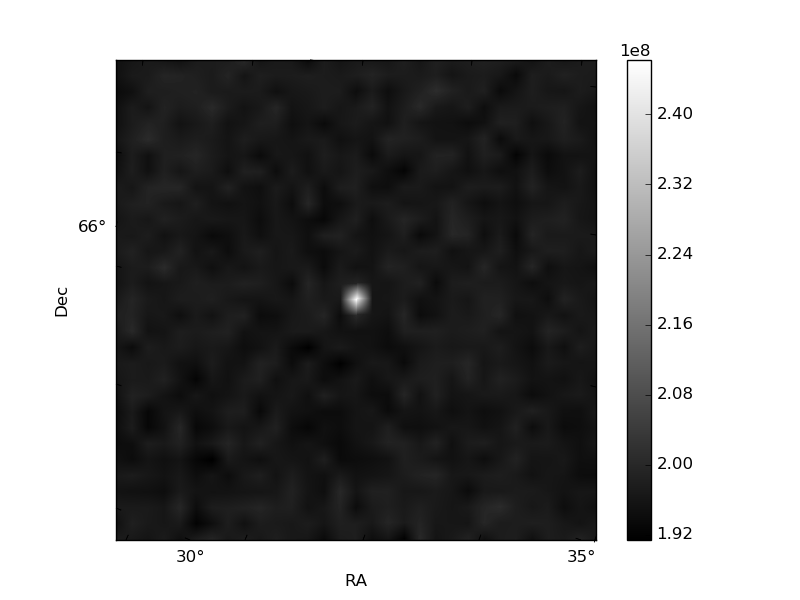
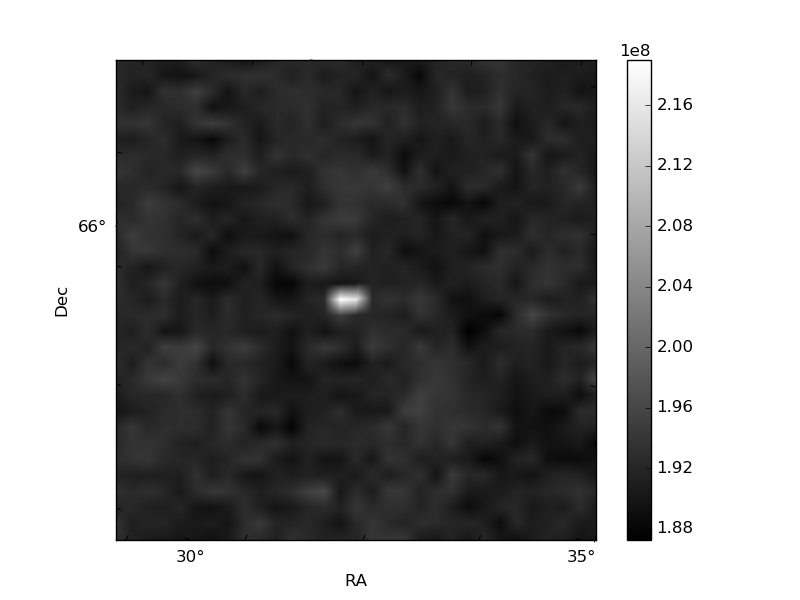
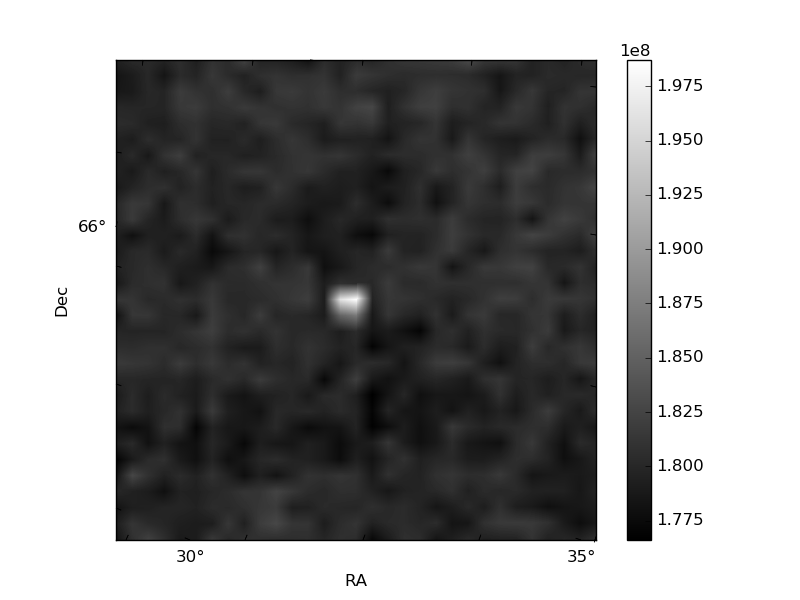
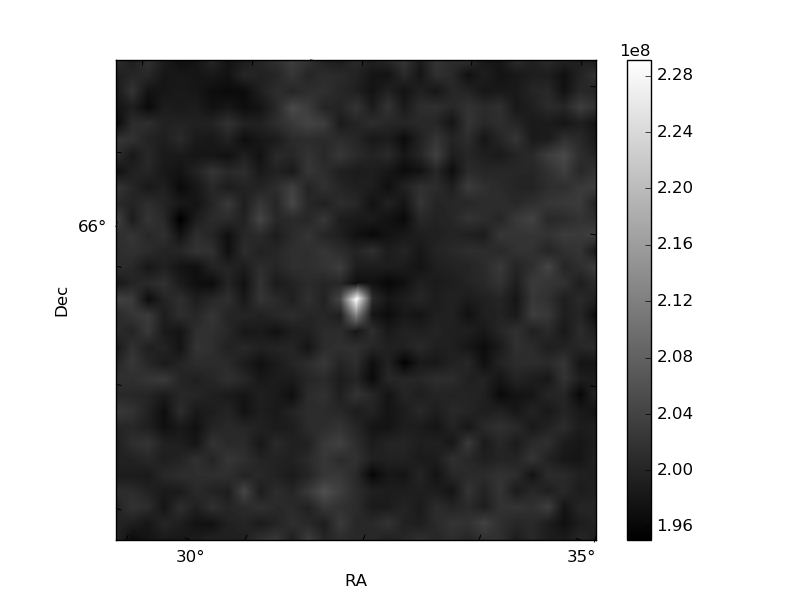
Histogram calculated using DETX and DETY for each event in the final _common_clean file
| Quadrant A | 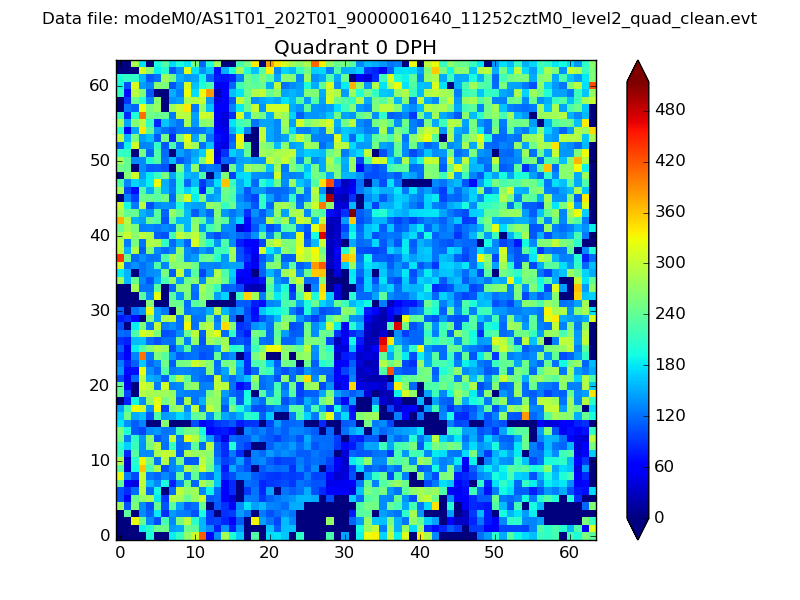 |
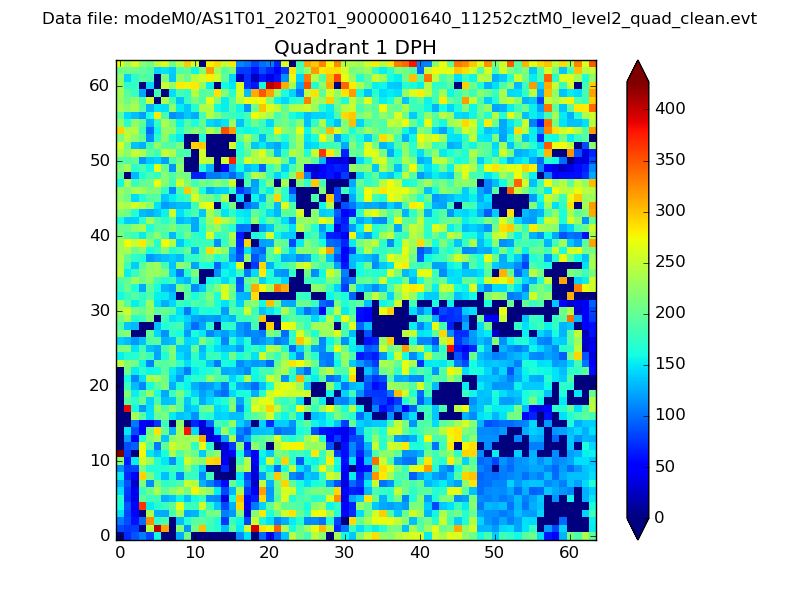 |
Quadrant B |
|---|---|---|---|
| Quadrant D | 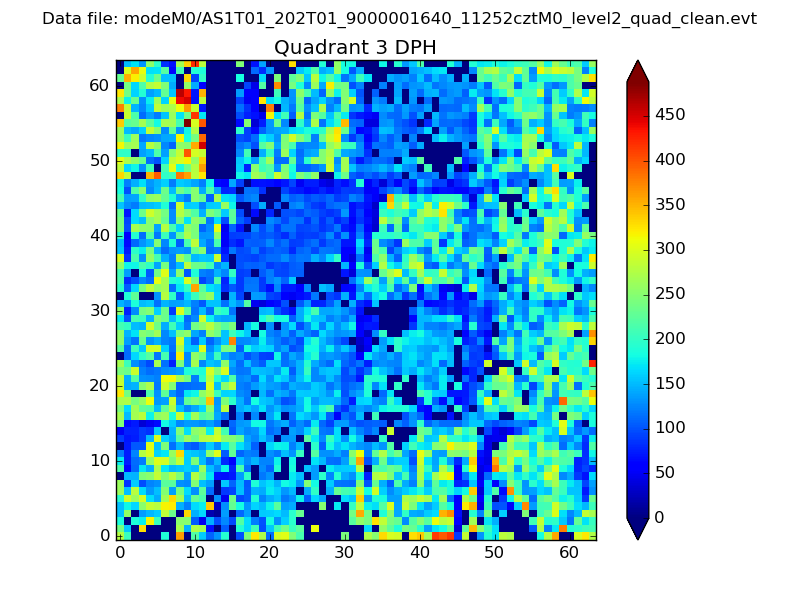 |
 |
Quadrant C |
| Plot type | Count rate plots | Images |
|---|---|---|
| Comparison with Poisson distribution Blue bars denote a histogram of data divided into 1 sec bins. Red curve is a Poisson curve with rate = median count rate of data. |
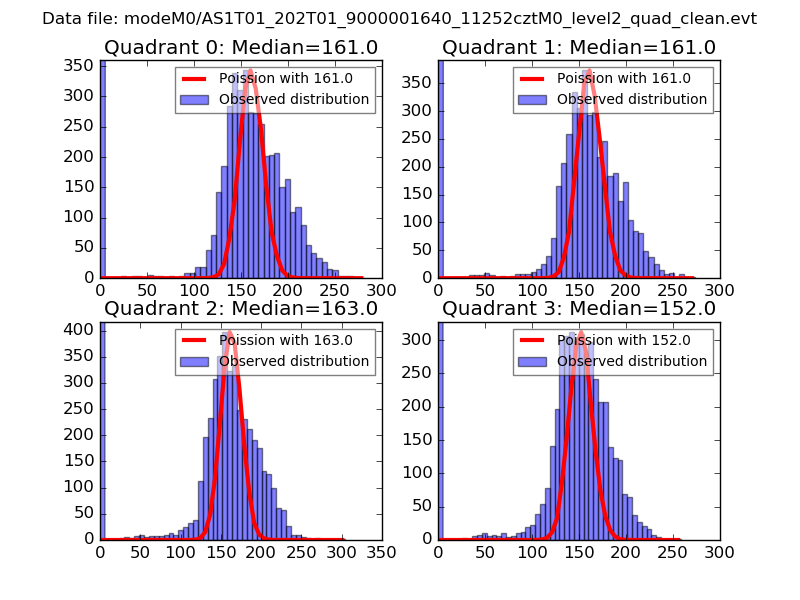 |
 |
| Quadrant-wise count rates Data is divided into 100 sec bins |
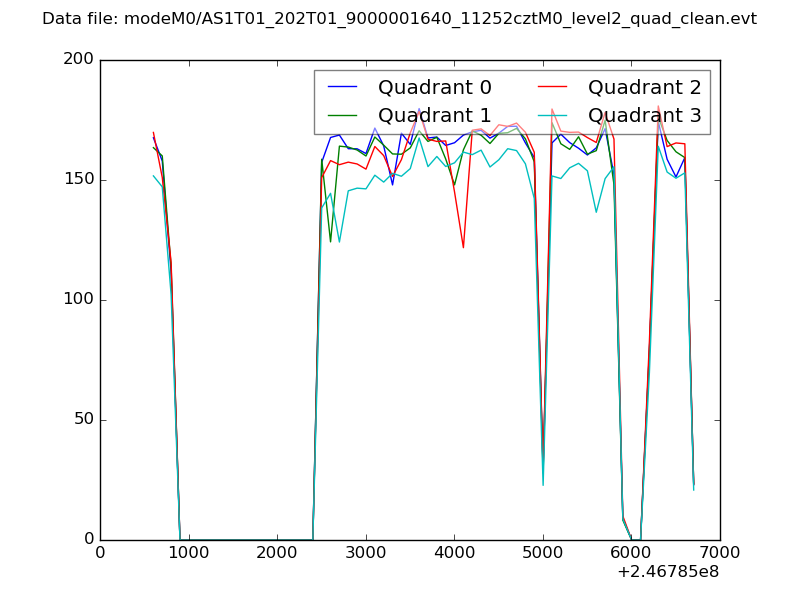 |
|
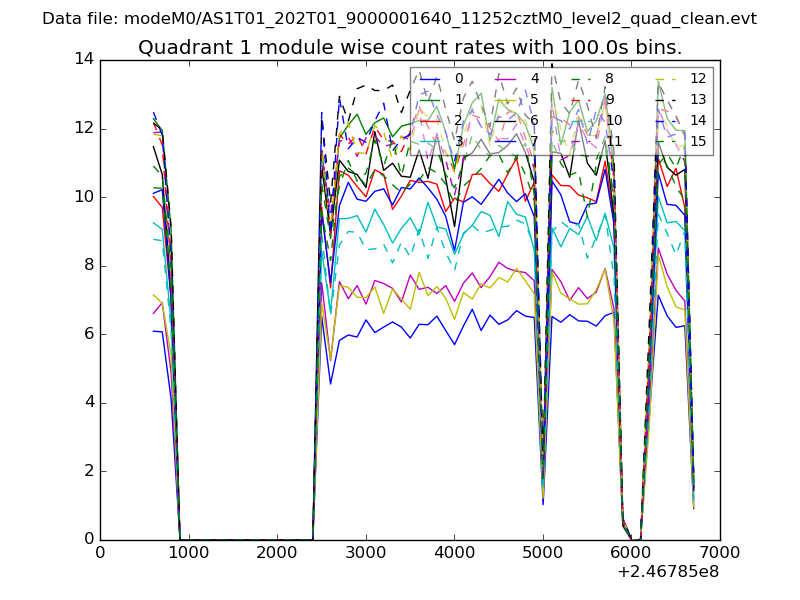
| Module-wise count rates for Quadrant A Data is divided into 100 sec bins |
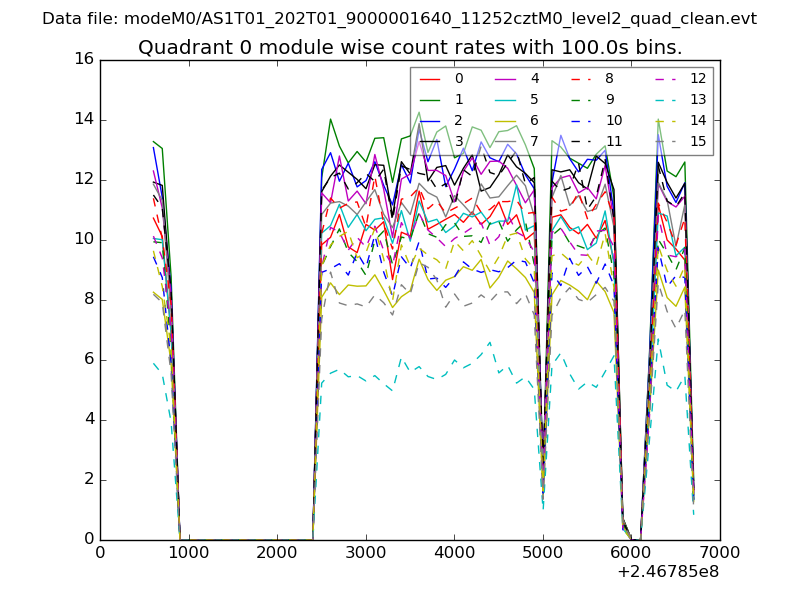 |
 |
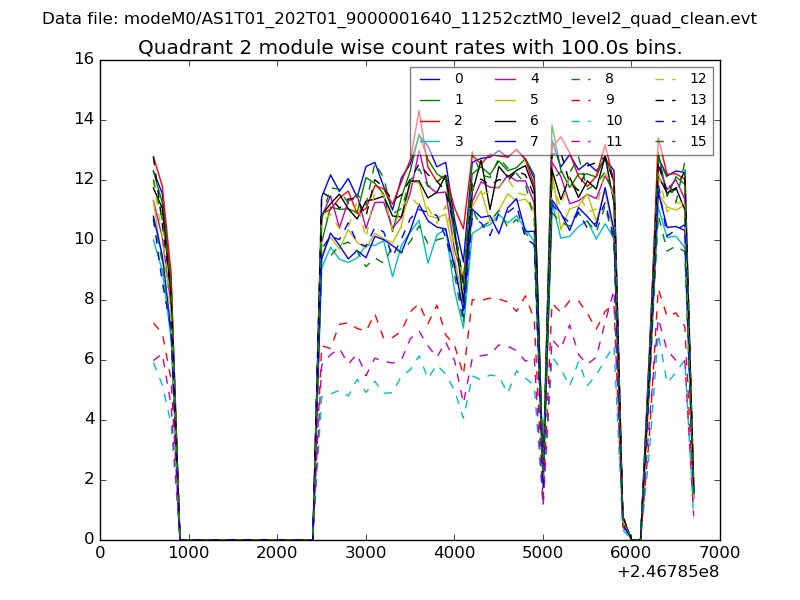
| Module-wise count rates for Quadrant B Data is divided into 100 sec bins |
 |
 |
| Module-wise count rates for Quadrant C Data is divided into 100 sec bins |
 |
 |
| Module-wise count rates for Quadrant D Data is divided into 100 sec bins |
 |
 |
| Parameter | Plot |
|---|---|
| CZT HV Monitor |  |
| D_VDD | 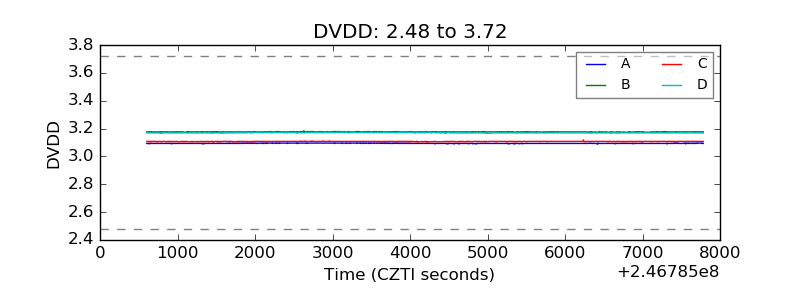 |
| Temperature 1 | 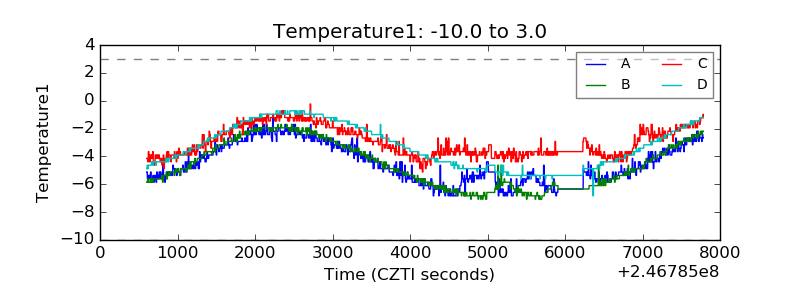 |
| Veto HV Monitor | 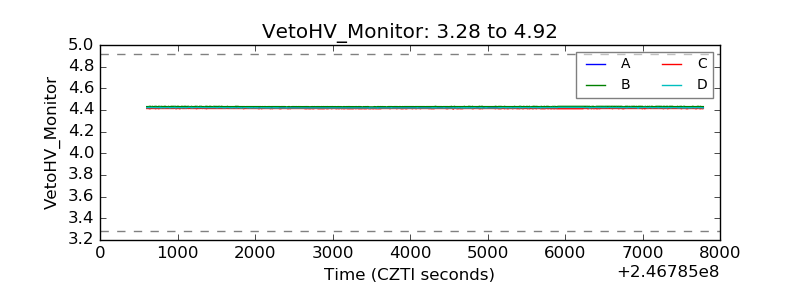 |
| Veto LLD | 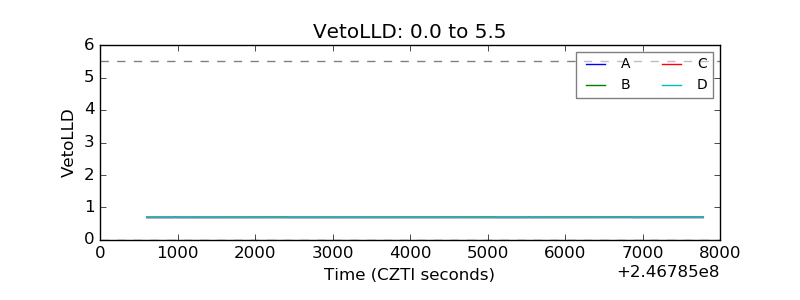 |
| Alpha Counter | 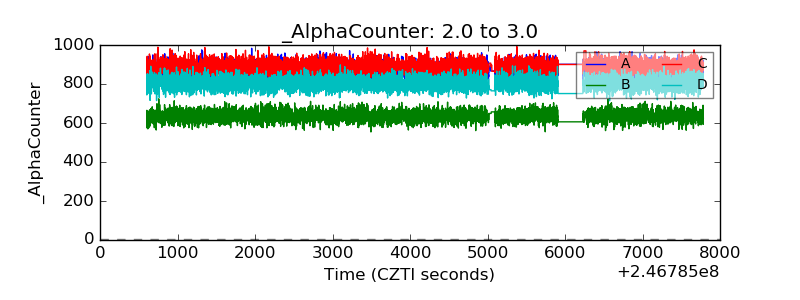 |
| _CPM_Rate | 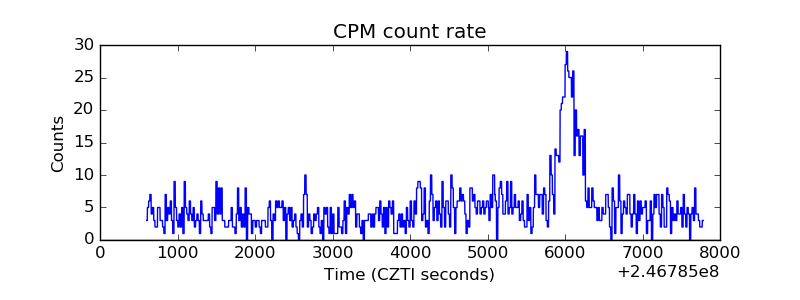 |
| CZT Counter | 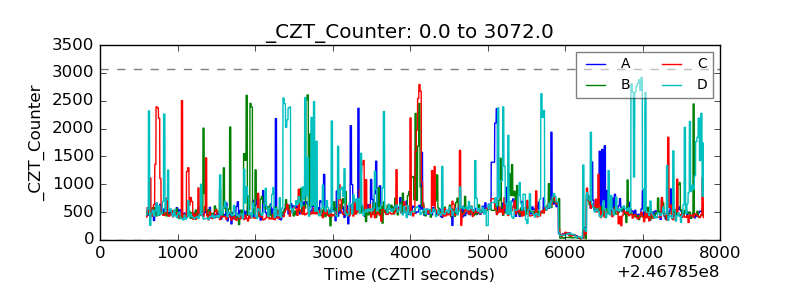 |
| +2.5 Volts monitor |  |
| +5 Volts monitor |  |
| _ROLL_ROT | 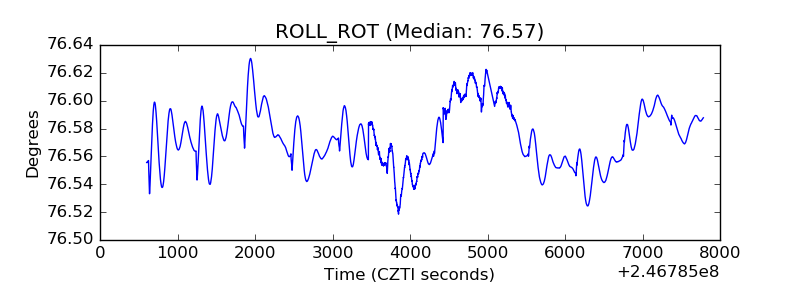 |
| _Roll_DEC | 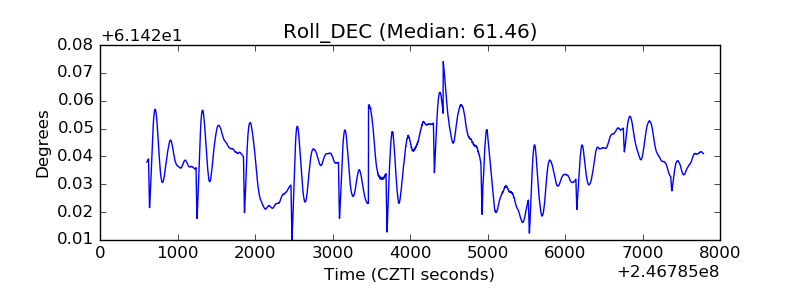 |
| _Roll_RA | 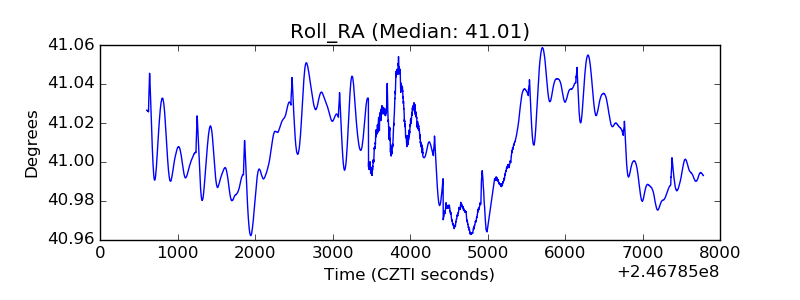 |
| Veto Counter | 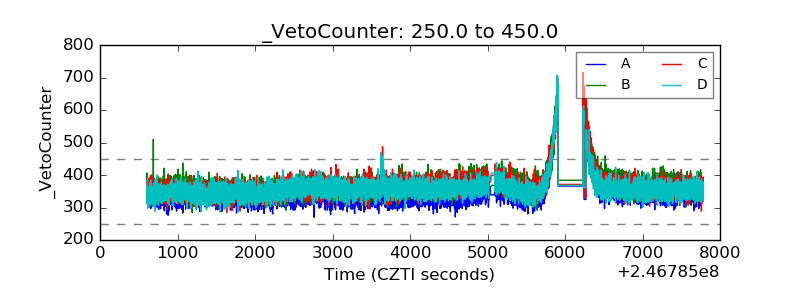 |