| Param | Original file | Final file |
|---|---|---|
| Filename | modeM0/AS1T01_202T01_9000001640_11254cztM0_level2.evt | modeM0/AS1T01_202T01_9000001640_11254cztM0_level2_quad_clean.evt |
| Size (bytes) | 760,847,040 | 150,667,200 |
| Size | 725.6 MB | 143.7 MB |
| Events in quadrant A | 5,519,584 | 993,563 |
| Events in quadrant B | 5,832,200 | 995,011 |
| Events in quadrant C | 4,424,946 | 1,006,070 |
| Events in quadrant D | 6,632,020 | 919,329 |
| Mode M9 | |||
|---|---|---|---|
| Quadrant | BADHDUFLAG | Total packets | Discarded packets |
| A | 0 | 6 | 0 |
| B | 0 | 6 | 0 |
| C | 0 | 6 | 0 |
| D | 0 | 6 | 0 |
| Mode M0 | |||
|---|---|---|---|
| Quadrant | BADHDUFLAG | Total packets | Discarded packets |
| A | 0 | 22109 | 1 |
| B | 0 | 23125 | 1 |
| C | 0 | 19178 | 1 |
| D | 0 | 25620 | 1 |
| Mode SS | |||
|---|---|---|---|
| Quadrant | BADHDUFLAG | Total packets | Discarded packets |
| A | 0 | 188 | 0 |
| B | 0 | 188 | 0 |
| C | 0 | 188 | 0 |
| D | 0 | 188 | 0 |
| Quadrant | Total seconds | Saturated seconds | Saturation percentage |
|---|---|---|---|
| A | 9368 | 260 | 2.775406% |
| B | 9368 | 323 | 3.447908% |
| C | 9368 | 76 | 0.811272% |
| D | 9368 | 662 | 7.066610% |
Noise dominated data is calculated using 1-second bins in cleaned event files. If a bin has >2000 counts, and if more than 50% of those come from <1% of pixels, then it is considered to be noise-dominated and hence unusable.
| Quadrant | # 1 sec bins | Bins with >0 counts | Bins with >2000 counts | High rate bins dominated by noise | Noise dominated (total time) | Noise dominated (detector-on time) | Marked lightcurve |
|---|---|---|---|---|---|---|---|
| A | 9913 | 9369 | 137 | 137 | 1.38% | 1.46% | 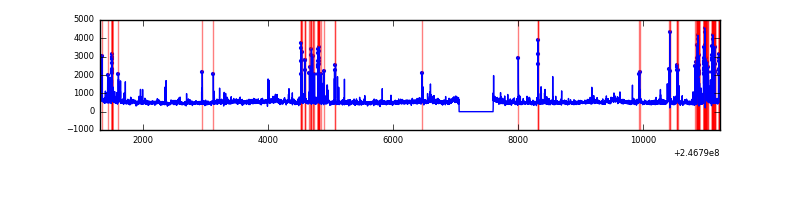 |
| B | 9913 | 9368 | 145 | 145 | 1.46% | 1.55% | 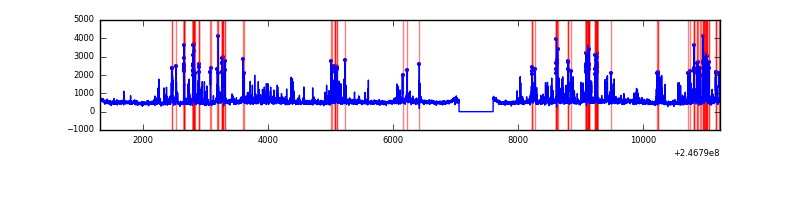 |
| C | 9913 | 9369 | 9 | 9 | 0.09% | 0.10% | 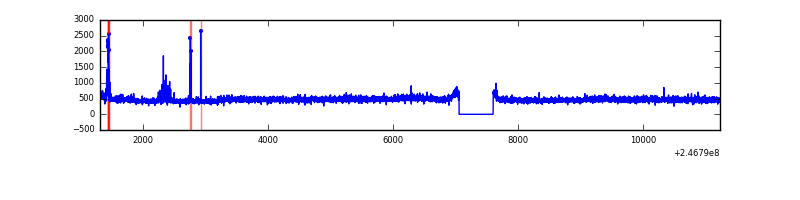 |
| D | 9913 | 9369 | 471 | 471 | 4.75% | 5.03% | 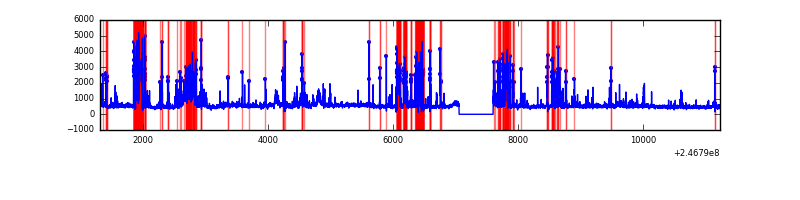 |
Top three noisy pixels from each quadrant. If the there are fewer than three noisy pixels in the level2.evt file, extra rows are filled as -1
| Pixel properties | Quadrant properties | ||||||
|---|---|---|---|---|---|---|---|
| Quadrant | DetID | PixID | Counts | Sigma | Mean | Median | Sigma |
| A | 14 | 238 | 623034 | 2454.8 | 1140 | 1117 | 253.3 |
| A | 8 | 5 | 326675 | 1285.03 | 1140 | 1117 | 253.3 |
| A | 8 | 15 | 119502 | 467.28 | 1140 | 1117 | 253.3 |
| B | 4 | 239 | 958915 | 4206.69 | 1137 | 1113 | 227.7 |
| B | 11 | 51 | 180758 | 789.0 | 1137 | 1113 | 227.7 |
| B | 15 | 204 | 73714 | 318.86 | 1137 | 1113 | 227.7 |
| C | 9 | 204 | 69173 | 255.22 | 1116 | 1130 | 266.6 |
| C | 13 | 61 | 8138 | 26.29 | 1116 | 1130 | 266.6 |
| C | 1 | 90 | 5162 | 15.12 | 1116 | 1130 | 266.6 |
| D | 10 | 253 | 964926 | 3531.78 | 1069 | 1043 | 272.9 |
| D | 13 | 104 | 746773 | 2732.44 | 1069 | 1043 | 272.9 |
| D | 8 | 195 | 329608 | 1203.9 | 1069 | 1043 | 272.9 |
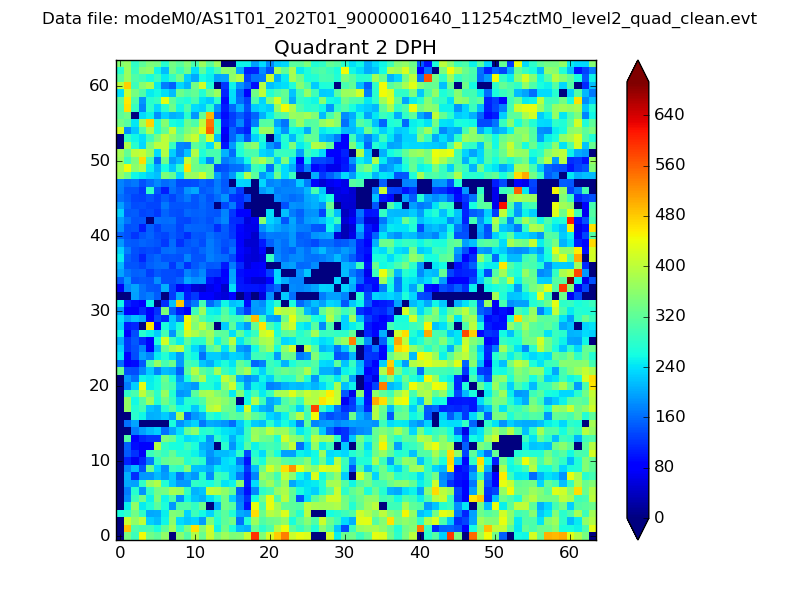
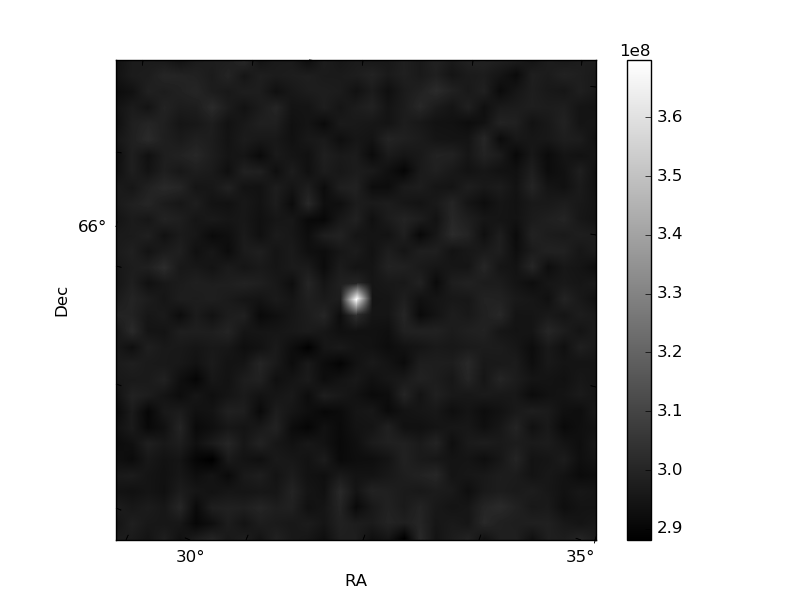
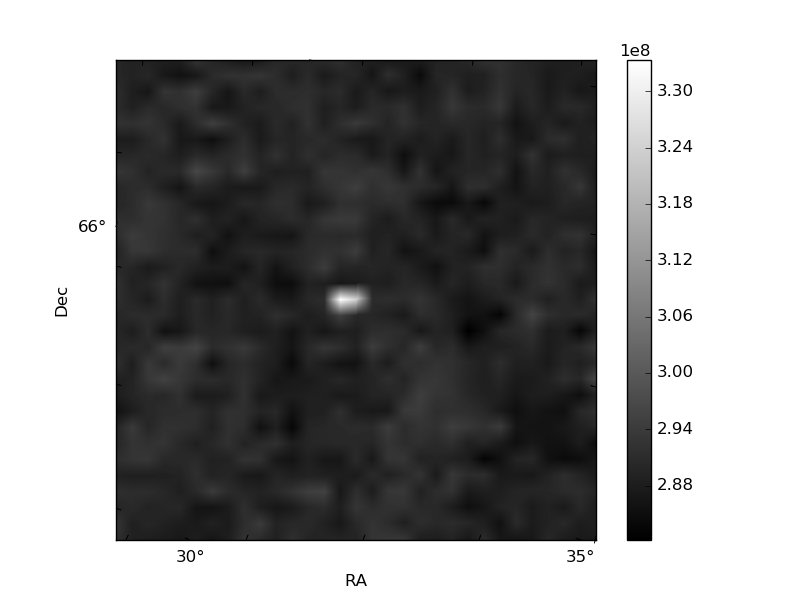
Histogram calculated using DETX and DETY for each event in the final _common_clean file
| Quadrant A | 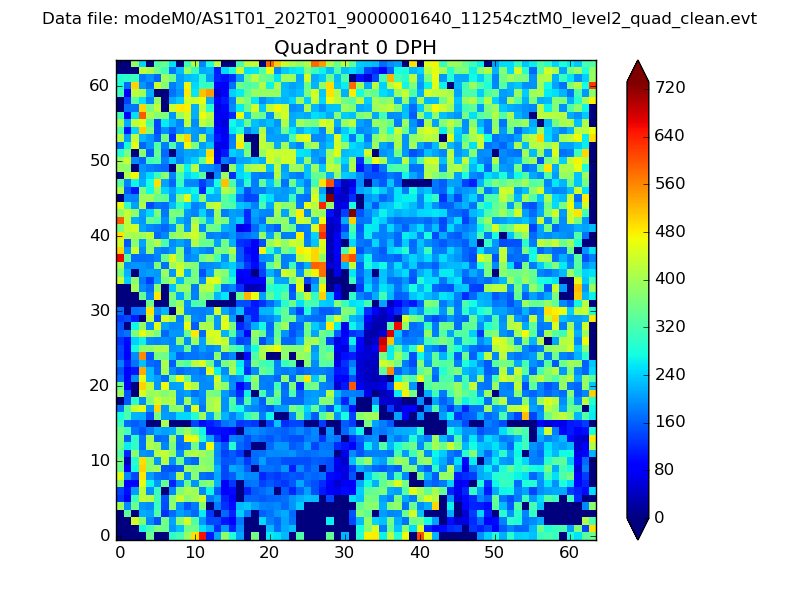 |
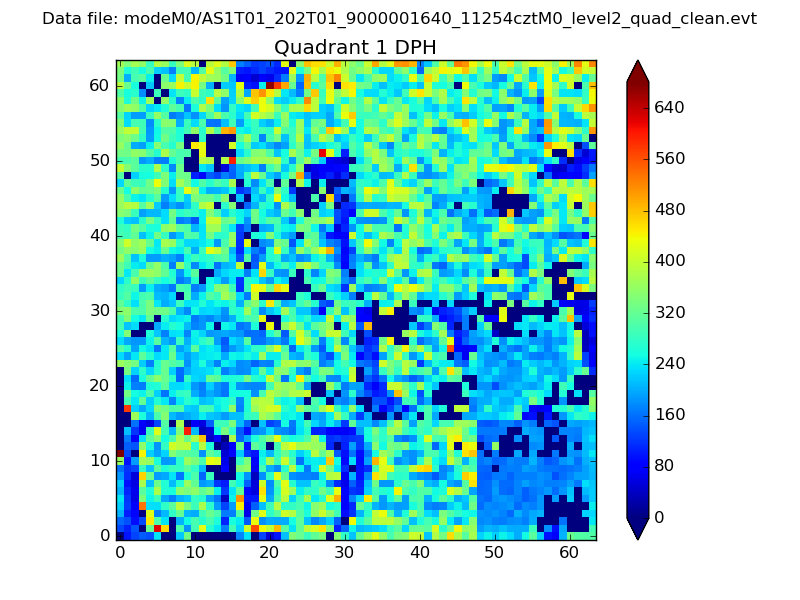 |
Quadrant B |
|---|---|---|---|
| Quadrant D | 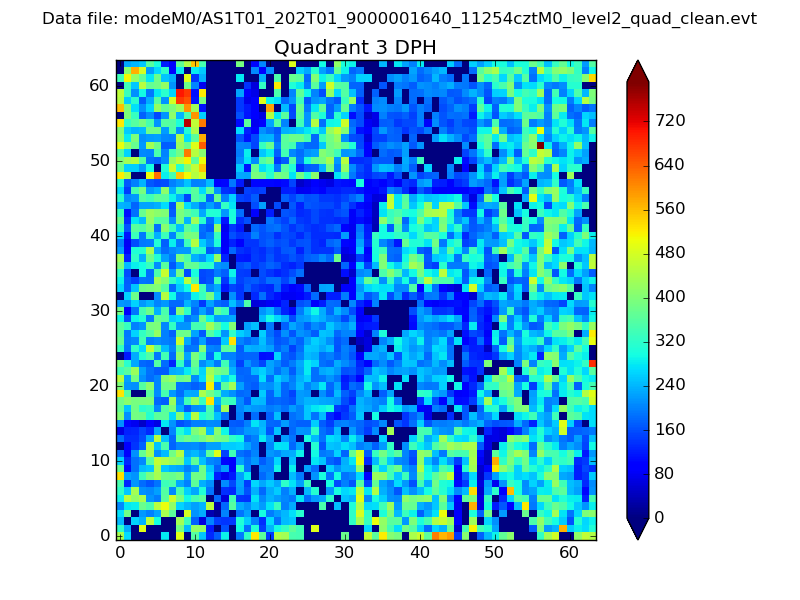 |
 |
Quadrant C |
| Plot type | Count rate plots | Images |
|---|---|---|
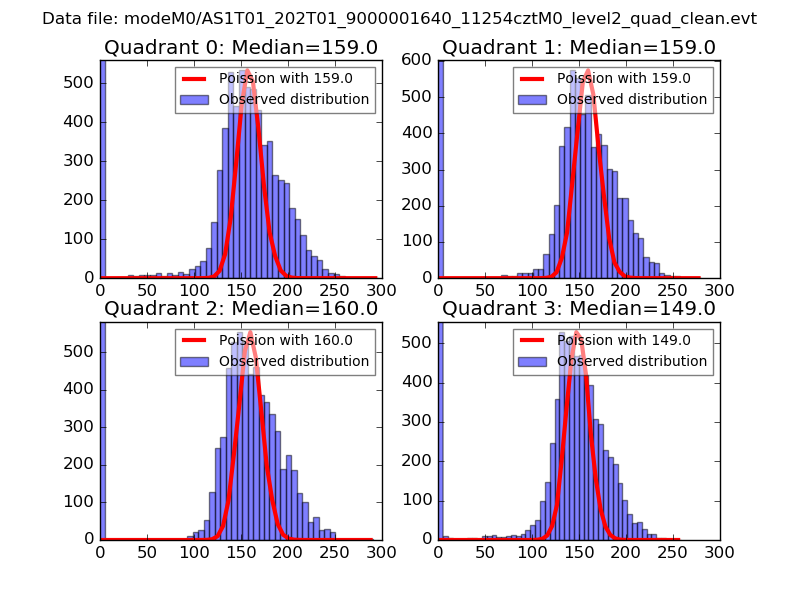
| Comparison with Poisson distribution Blue bars denote a histogram of data divided into 1 sec bins. Red curve is a Poisson curve with rate = median count rate of data. |
 |
 |
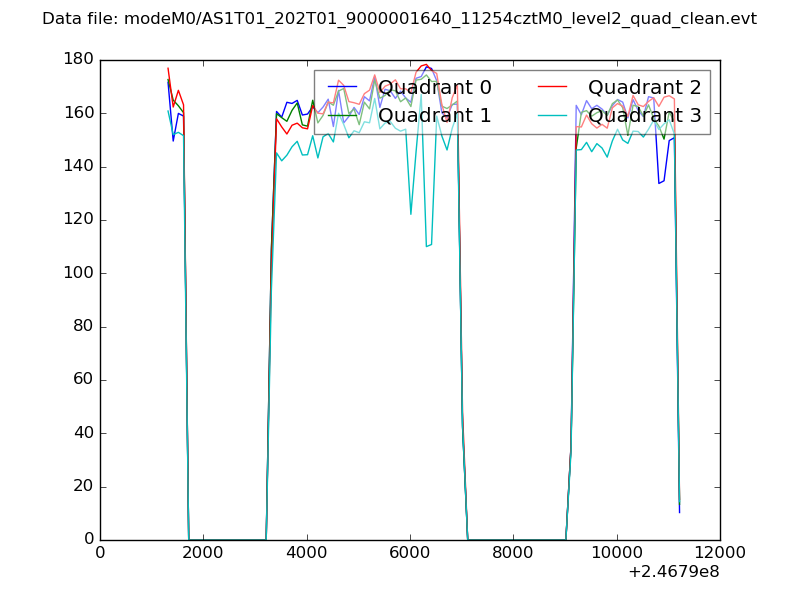
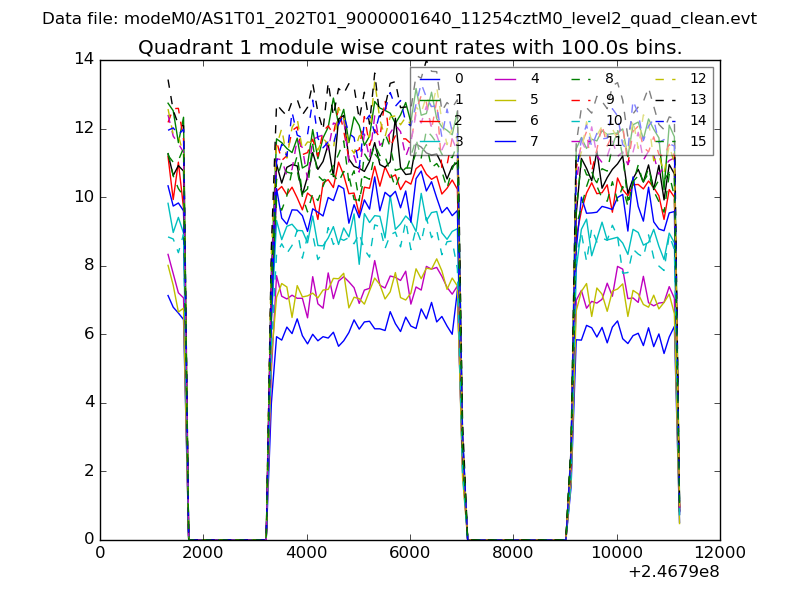
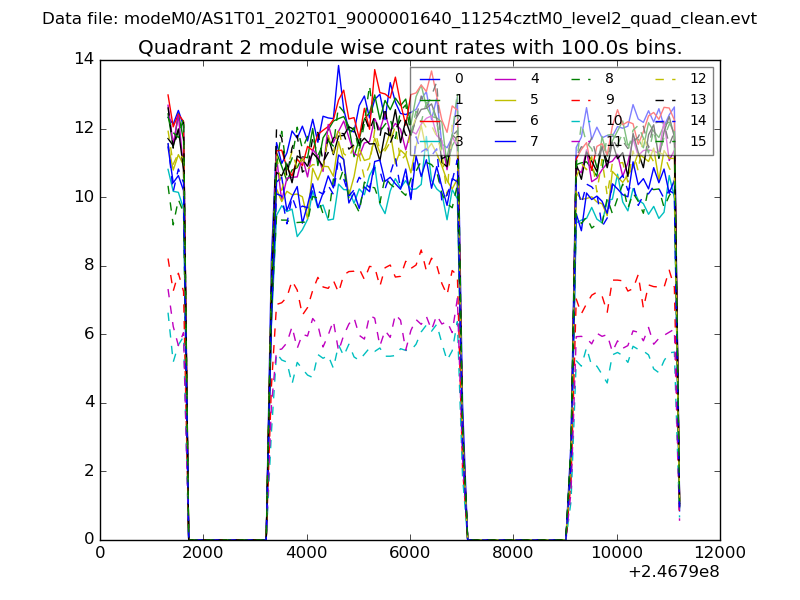
| Quadrant-wise count rates Data is divided into 100 sec bins |
 |
|
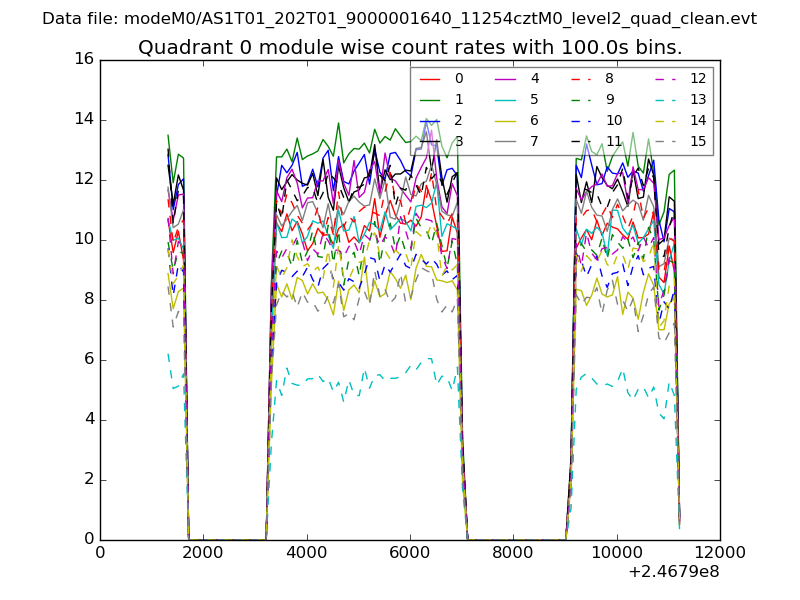
| Module-wise count rates for Quadrant A Data is divided into 100 sec bins |
 |
 |
| Module-wise count rates for Quadrant B Data is divided into 100 sec bins |
 |
 |
| Module-wise count rates for Quadrant C Data is divided into 100 sec bins |
 |
 |
| Module-wise count rates for Quadrant D Data is divided into 100 sec bins |
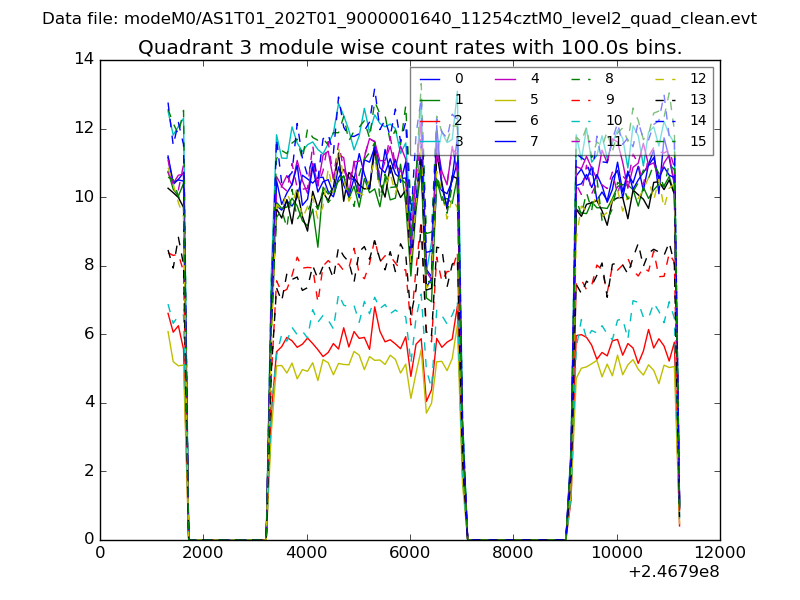 |
 |
| Parameter | Plot |
|---|---|
| CZT HV Monitor | 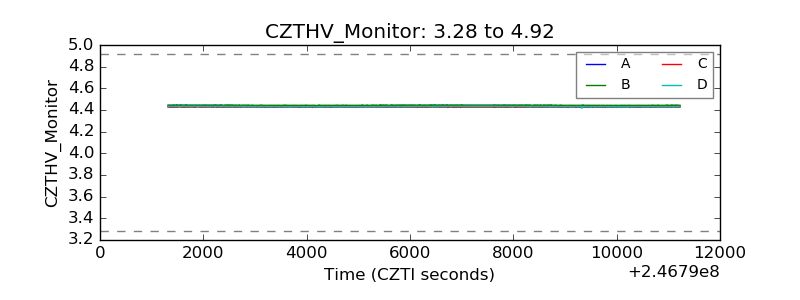 |
| D_VDD | 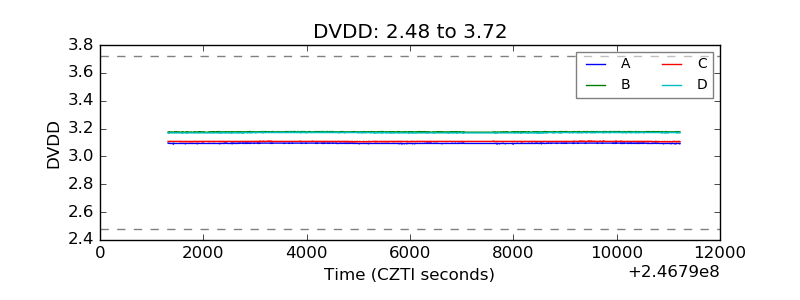 |
| Temperature 1 | 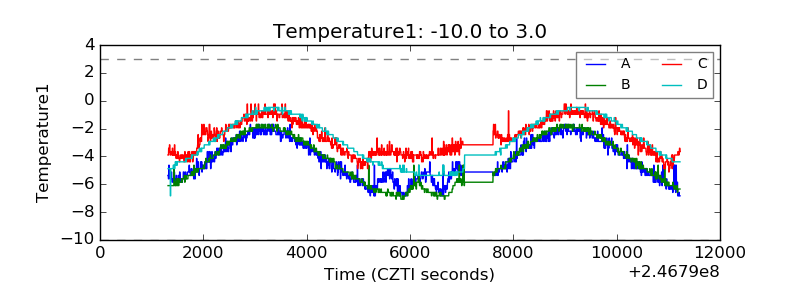 |
| Veto HV Monitor |  |
| Veto LLD | 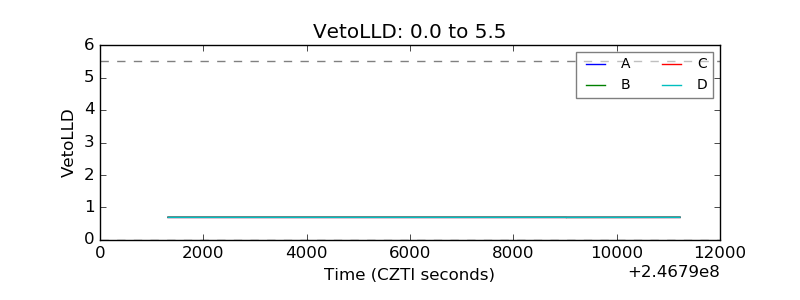 |
| Alpha Counter | 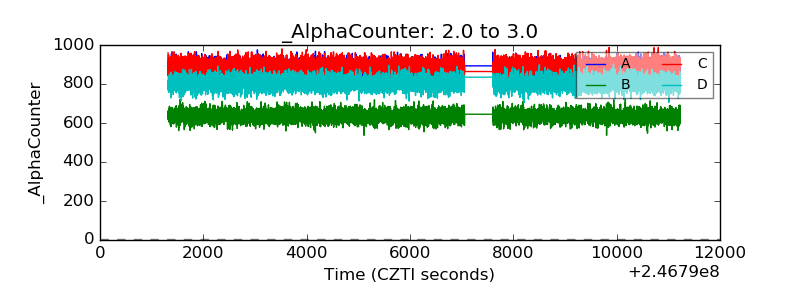 |
| _CPM_Rate | 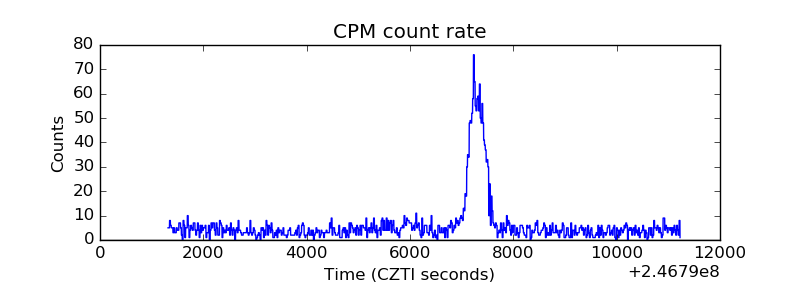 |
| CZT Counter | 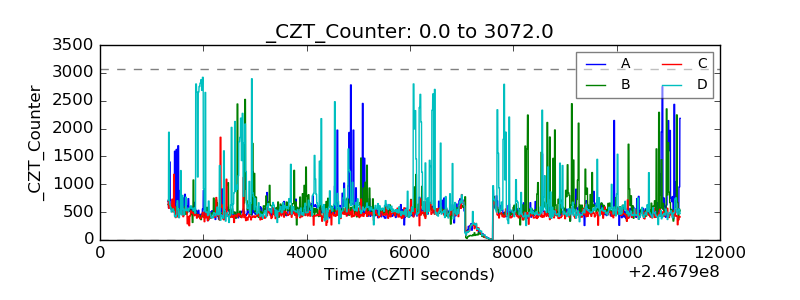 |
| +2.5 Volts monitor |  |
| +5 Volts monitor | 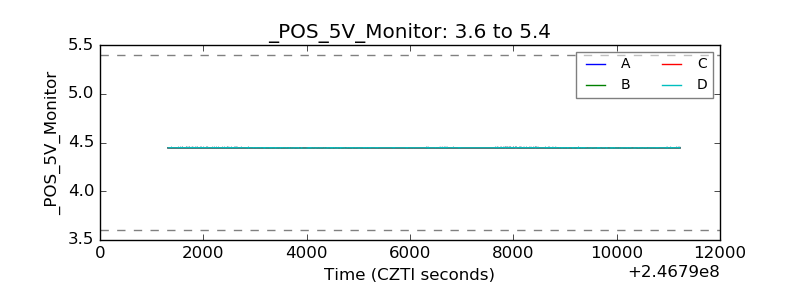 |
| _ROLL_ROT | 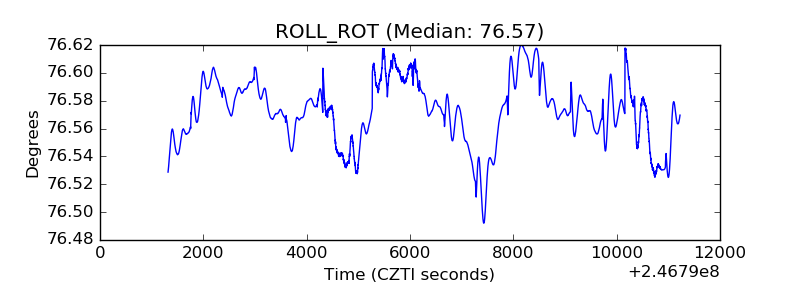 |
| _Roll_DEC | 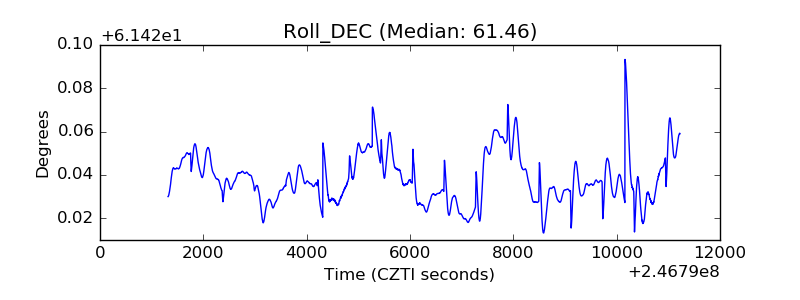 |
| _Roll_RA | 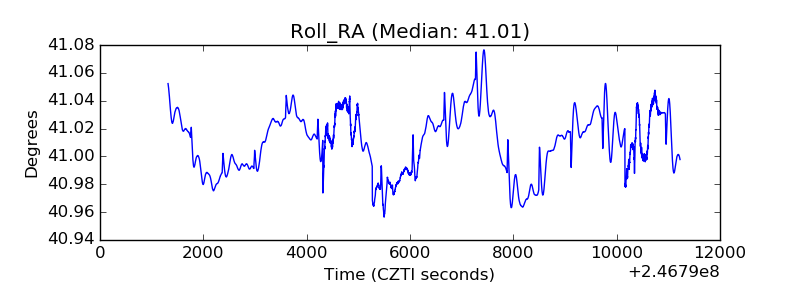 |
| Veto Counter | 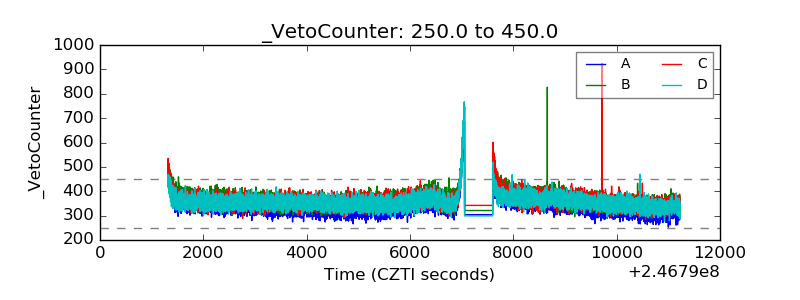 |