| Param | Original file | Final file |
|---|---|---|
| Filename | modeM0/AS1A04_080T01_9000001644cztM0_level2.fits | modeM0/AS1A04_080T01_9000001644cztM0_level2_quad_clean.evt |
| Size (bytes) | 169,410,240 | 150,655,680 |
| Size | 161.6 MB | 143.7 MB |
| Events in quadrant A | 1,013,966 | 880,885 |
| Events in quadrant B | 974,638 | 830,948 |
| Events in quadrant C | 1,029,158 | 861,733 |
| Events in quadrant D | 822,476 | 698,745 |
| Mode M0 | |||
|---|---|---|---|
| Quadrant | BADHDUFLAG | Total packets | Discarded packets |
| A | 0 | 45473 | 0 |
| B | 0 | 50575 | 0 |
| C | 0 | 38188 | 0 |
| D | 0 | 84287 | 0 |
| Mode SS | |||
|---|---|---|---|
| Quadrant | BADHDUFLAG | Total packets | Discarded packets |
| A | 0 | 380 | 0 |
| B | 0 | 380 | 0 |
| C | 0 | 380 | 0 |
| D | 0 | 380 | 0 |
| Mode M9 | |||
|---|---|---|---|
| Quadrant | BADHDUFLAG | Total packets | Discarded packets |
| A | 0 | 26 | 0 |
| B | 0 | 26 | 0 |
| C | 0 | 26 | 0 |
| D | 0 | 26 | 0 |
| Quadrant | Total seconds | Saturated seconds | Saturation percentage |
|---|---|---|---|
| A | 18710 | 511 | 2.731160% |
| B | 18710 | 1284 | 6.862640% |
| C | 18710 | 89 | 0.475681% |
| D | 18710 | 1455 | 7.776590% |
Noise dominated data is calculated using 1-second bins in cleaned event files. If a bin has >2000 counts, and if more than 50% of those come from <1% of pixels, then it is considered to be noise-dominated and hence unusable.
| Quadrant | # 1 sec bins | Bins with >0 counts | Bins with >2000 counts | High rate bins dominated by noise | Noise dominated (total time) | Noise dominated (detector-on time) | Marked lightcurve |
|---|---|---|---|---|---|---|---|
| A | 21295 | 18709 | 0 | 0 | 0.00% | 0.00% | 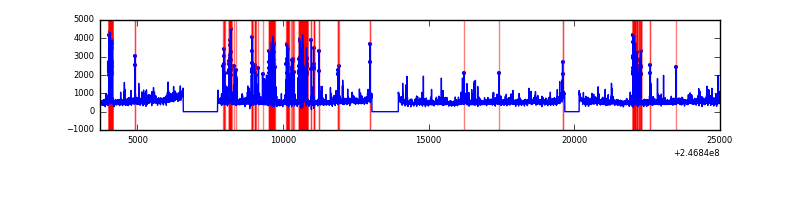 |
| B | 21295 | 18706 | 0 | 0 | 0.00% | 0.00% |  |
| C | 21295 | 18710 | 0 | 0 | 0.00% | 0.00% |  |
| D | 21295 | 18630 | 0 | 0 | 0.00% | 0.00% | 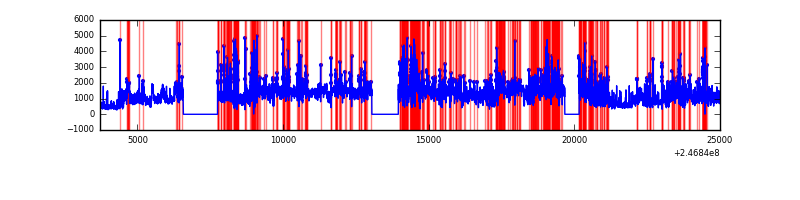 |
Top three noisy pixels from each quadrant. If the there are fewer than three noisy pixels in the level2.evt file, extra rows are filled as -1
| Pixel properties | Quadrant properties | ||||||
|---|---|---|---|---|---|---|---|
| Quadrant | DetID | PixID | Counts | Sigma | Mean | Median | Sigma |
| A | 0 | 29 | 947 | 10.17 | 264 | 246 | 68.9 |
| A | 7 | 110 | 826 | 8.41 | 264 | 246 | 68.9 |
| A | 9 | 19 | 788 | 7.86 | 264 | 246 | 68.9 |
| B | 2 | 9 | 867 | 11.46 | 257 | 244 | 54.4 |
| B | 3 | 17 | 654 | 7.54 | 257 | 244 | 54.4 |
| B | 5 | 128 | 651 | 7.49 | 257 | 244 | 54.4 |
| C | 1 | 80 | 808 | 7.7 | 271 | 250 | 72.5 |
| C | 1 | 81 | 792 | 7.48 | 271 | 250 | 72.5 |
| C | 12 | 241 | 715 | 6.42 | 271 | 250 | 72.5 |
| D | 6 | 231 | 659 | 6.89 | 234 | 213 | 64.7 |
| D | 7 | 5 | 642 | 6.63 | 234 | 213 | 64.7 |
| D | 3 | 14 | 640 | 6.6 | 234 | 213 | 64.7 |
Histogram calculated using DETX and DETY for each event in the final _common_clean file
| Quadrant A |  |
 |
Quadrant B |
|---|---|---|---|
| Quadrant D |  |
 |
Quadrant C |
| Plot type | Count rate plots | Images |
|---|---|---|
| Comparison with Poisson distribution Blue bars denote a histogram of data divided into 1 sec bins. Red curve is a Poisson curve with rate = median count rate of data. |
 |
 |
| Quadrant-wise count rates Data is divided into 100 sec bins |
 |
|
| Module-wise count rates for Quadrant A Data is divided into 100 sec bins |
 |
 |
| Module-wise count rates for Quadrant B Data is divided into 100 sec bins |
 |
 |
| Module-wise count rates for Quadrant C Data is divided into 100 sec bins |
 |
 |
| Module-wise count rates for Quadrant D Data is divided into 100 sec bins |
 |
 |
| Parameter | Plot |
|---|---|
| CZT HV Monitor |  |
| D_VDD |  |
| Temperature 1 |  |
| Veto HV Monitor |  |
| Veto LLD |  |
| Alpha Counter |  |
| _CPM_Rate |  |
| CZT Counter |  |
| +2.5 Volts monitor |  |
| +5 Volts monitor |  |
| _ROLL_ROT |  |
| _Roll_DEC |  |
| _Roll_RA |  |
| Veto Counter |  |