| Param | Original file | Final file |
|---|---|---|
| Filename | modeM0/AS1A04_080T01_9000001644_11262cztM0_level2.evt | modeM0/AS1A04_080T01_9000001644_11262cztM0_level2_quad_clean.evt |
| Size (bytes) | 434,822,400 | 50,342,400 |
| Size | 414.7 MB | 48.0 MB |
| Events in quadrant A | 2,904,472 | 307,843 |
| Events in quadrant B | 2,961,441 | 311,649 |
| Events in quadrant C | 2,109,810 | 316,898 |
| Events in quadrant D | 4,890,507 | 273,979 |
| Mode M0 | |||
|---|---|---|---|
| Quadrant | BADHDUFLAG | Total packets | Discarded packets |
| A | 0 | 11544 | 2 |
| B | 0 | 11736 | 1 |
| C | 0 | 9233 | 1 |
| D | 0 | 17659 | 1 |
| Mode SS | |||
|---|---|---|---|
| Quadrant | BADHDUFLAG | Total packets | Discarded packets |
| A | 0 | 90 | 0 |
| B | 0 | 90 | 0 |
| C | 0 | 90 | 0 |
| D | 0 | 90 | 0 |
| Mode M9 | |||
|---|---|---|---|
| Quadrant | BADHDUFLAG | Total packets | Discarded packets |
| A | 0 | 12 | 0 |
| B | 0 | 12 | 0 |
| C | 0 | 12 | 0 |
| D | 0 | 12 | 0 |
| Quadrant | Total seconds | Saturated seconds | Saturation percentage |
|---|---|---|---|
| A | 4461 | 168 | 3.765972% |
| B | 4461 | 245 | 5.492042% |
| C | 4461 | 30 | 0.672495% |
| D | 4461 | 331 | 7.419861% |
Noise dominated data is calculated using 1-second bins in cleaned event files. If a bin has >2000 counts, and if more than 50% of those come from <1% of pixels, then it is considered to be noise-dominated and hence unusable.
| Quadrant | # 1 sec bins | Bins with >0 counts | Bins with >2000 counts | High rate bins dominated by noise | Noise dominated (total time) | Noise dominated (detector-on time) | Marked lightcurve |
|---|---|---|---|---|---|---|---|
| A | 5641 | 4462 | 96 | 96 | 1.70% | 2.15% | 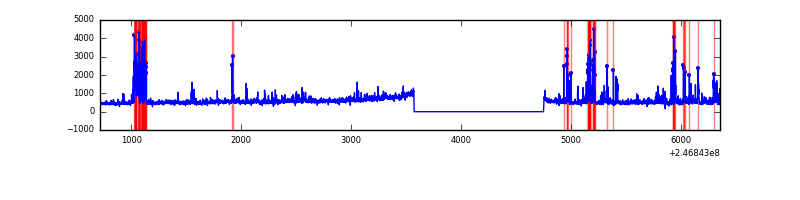 |
| B | 5641 | 4462 | 116 | 116 | 2.06% | 2.60% | 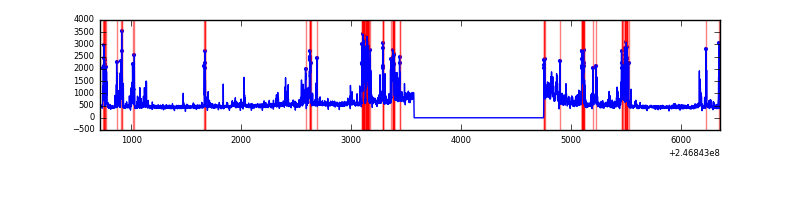 |
| C | 5641 | 4462 | 4 | 4 | 0.07% | 0.09% | 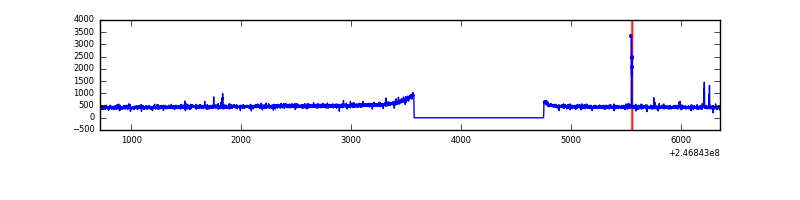 |
| D | 5641 | 4462 | 180 | 180 | 3.19% | 4.03% | 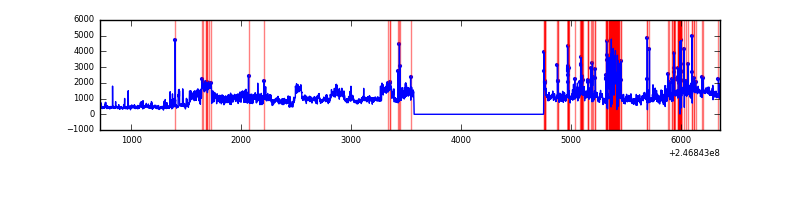 |
Top three noisy pixels from each quadrant. If the there are fewer than three noisy pixels in the level2.evt file, extra rows are filled as -1
| Pixel properties | Quadrant properties | ||||||
|---|---|---|---|---|---|---|---|
| Quadrant | DetID | PixID | Counts | Sigma | Mean | Median | Sigma |
| A | 14 | 238 | 355789 | 3224.5 | 535 | 525 | 110.2 |
| A | 13 | 251 | 221580 | 2006.37 | 535 | 525 | 110.2 |
| A | 8 | 5 | 153810 | 1391.27 | 535 | 525 | 110.2 |
| B | 4 | 239 | 632197 | 6036.14 | 540 | 527 | 104.6 |
| B | 11 | 51 | 66380 | 629.28 | 540 | 527 | 104.6 |
| B | 0 | 168 | 62383 | 591.09 | 540 | 527 | 104.6 |
| C | 9 | 204 | 24898 | 194.92 | 533 | 536 | 125.0 |
| C | 5 | 239 | 4158 | 28.98 | 533 | 536 | 125.0 |
| C | 13 | 61 | 3902 | 26.93 | 533 | 536 | 125.0 |
| D | 1 | 52 | 2166153 | 17762.74 | 506 | 491 | 121.9 |
| D | 10 | 253 | 380909 | 3120.18 | 506 | 491 | 121.9 |
| D | 8 | 195 | 172444 | 1410.36 | 506 | 491 | 121.9 |
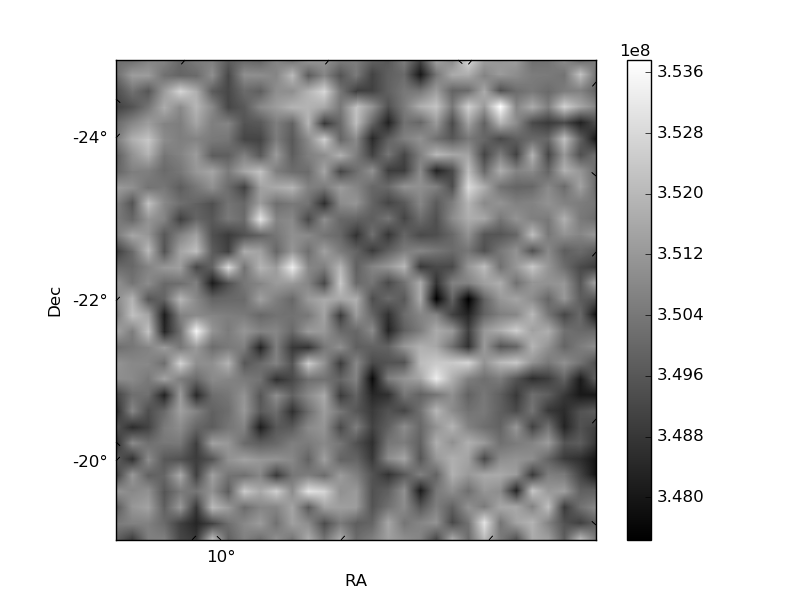
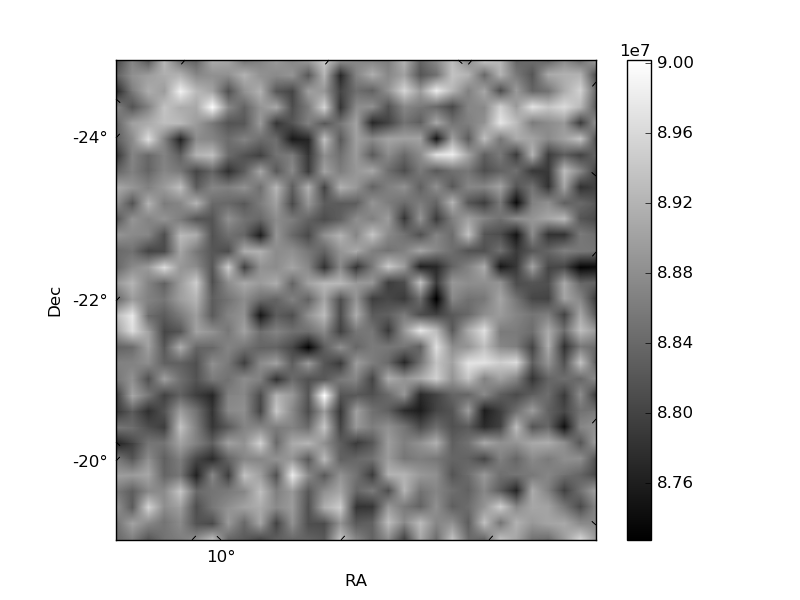
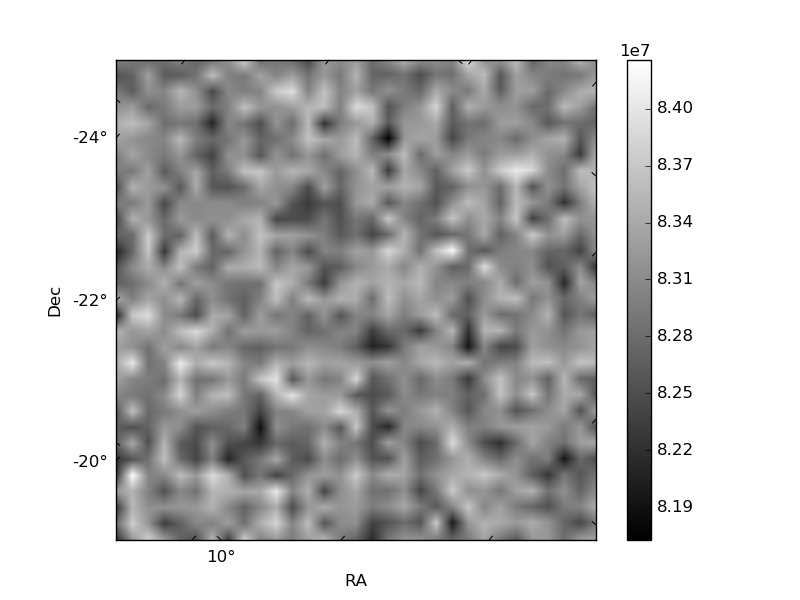
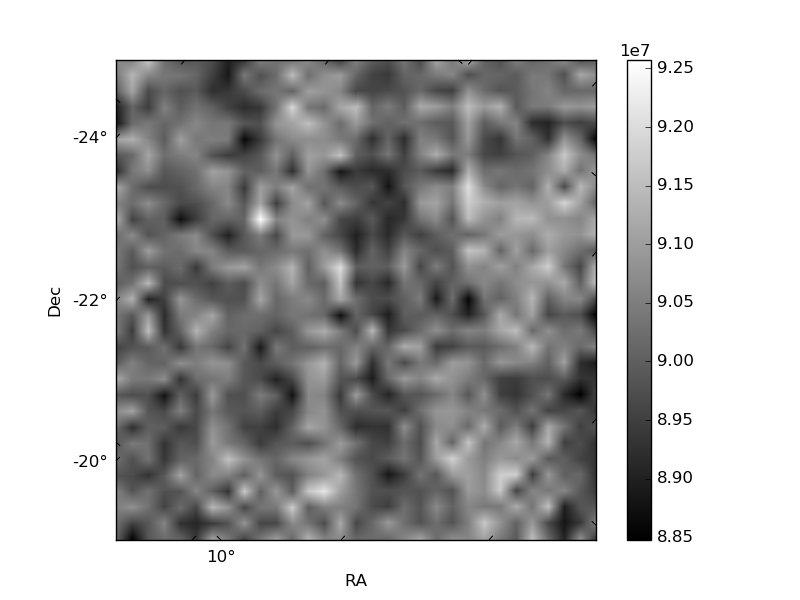
Histogram calculated using DETX and DETY for each event in the final _common_clean file
| Quadrant A | 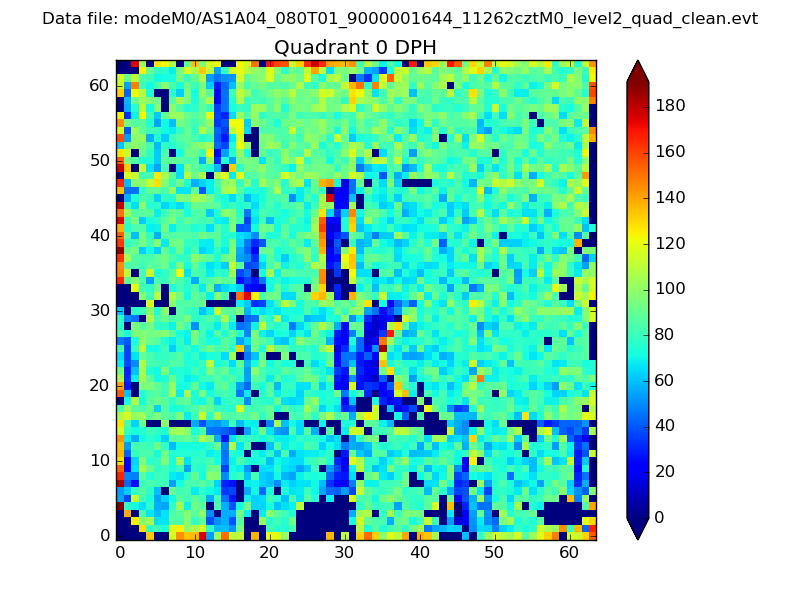 |
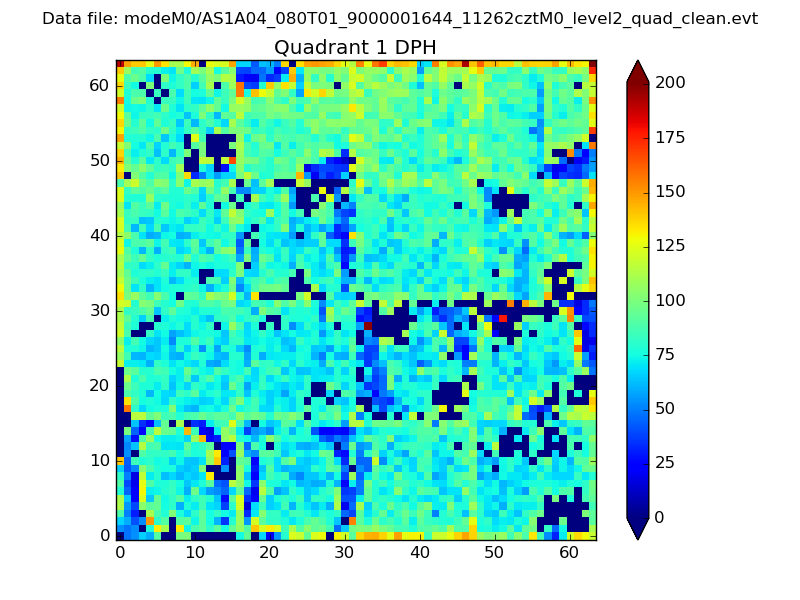 |
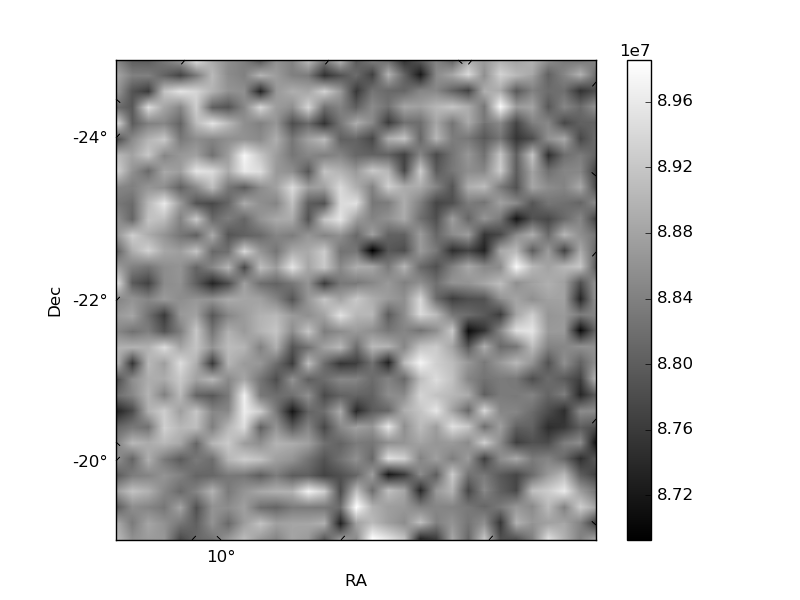
Quadrant B |
|---|---|---|---|
| Quadrant D | 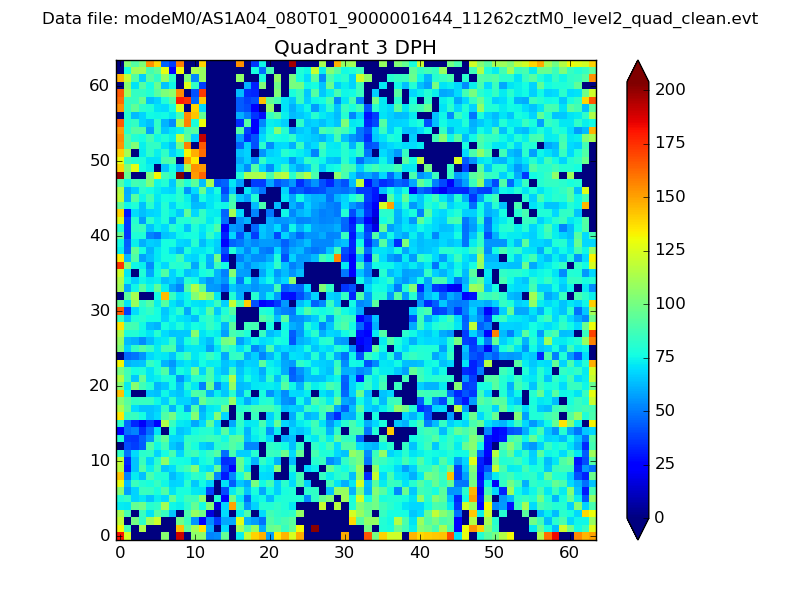 |
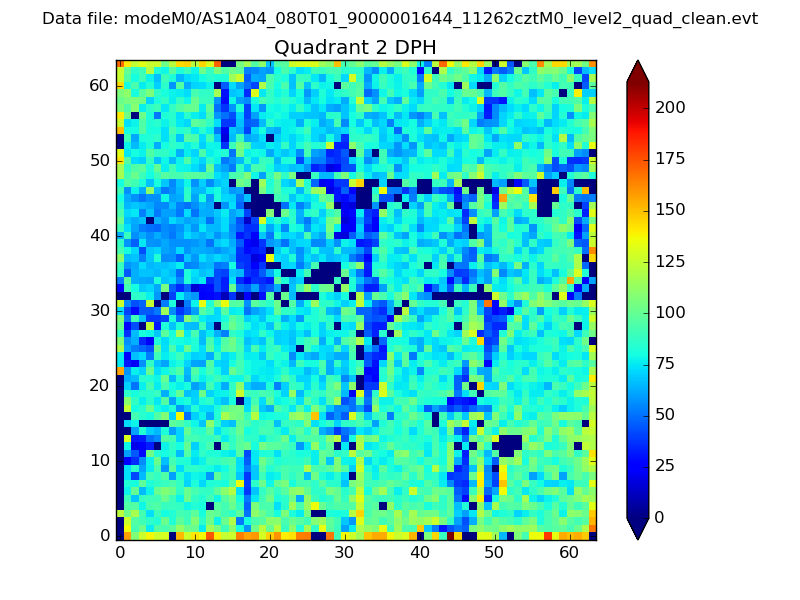 |
Quadrant C |
| Plot type | Count rate plots | Images |
|---|---|---|
| Comparison with Poisson distribution Blue bars denote a histogram of data divided into 1 sec bins. Red curve is a Poisson curve with rate = median count rate of data. |
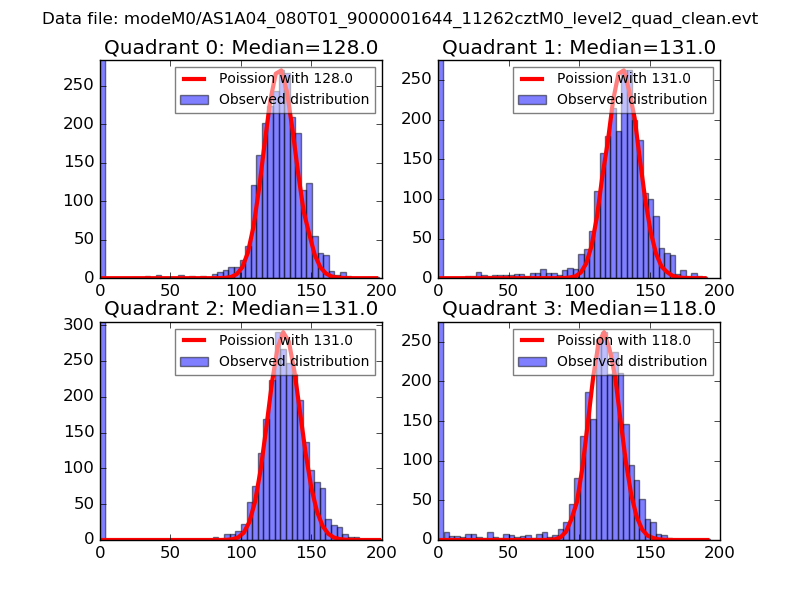 |
 |
| Quadrant-wise count rates Data is divided into 100 sec bins |
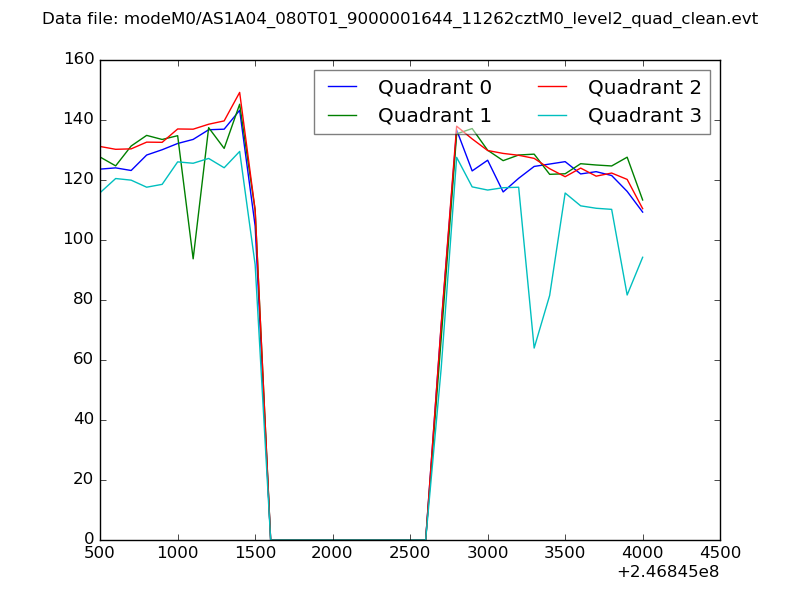 |
|
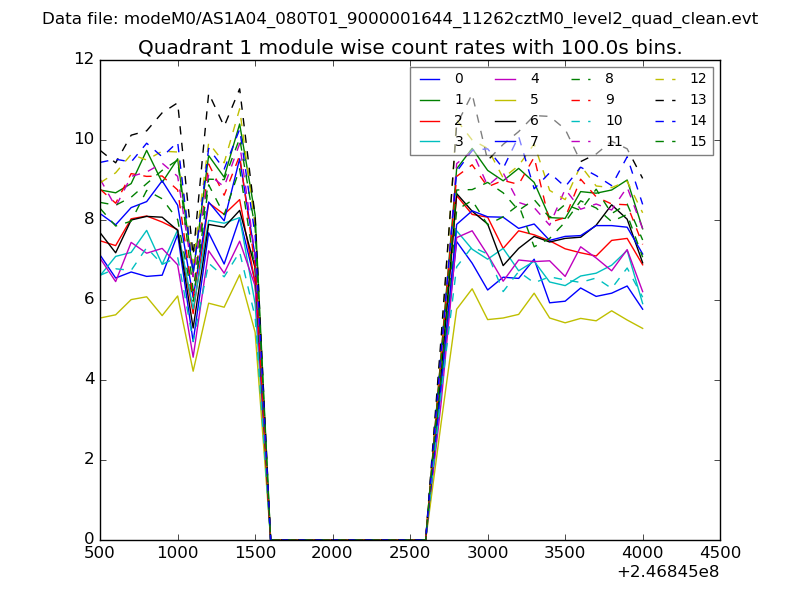
| Module-wise count rates for Quadrant A Data is divided into 100 sec bins |
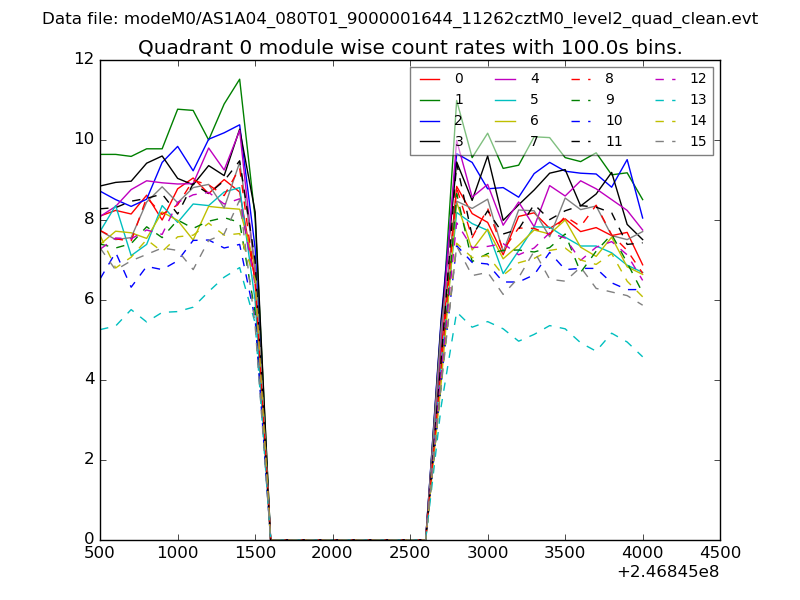 |
 |
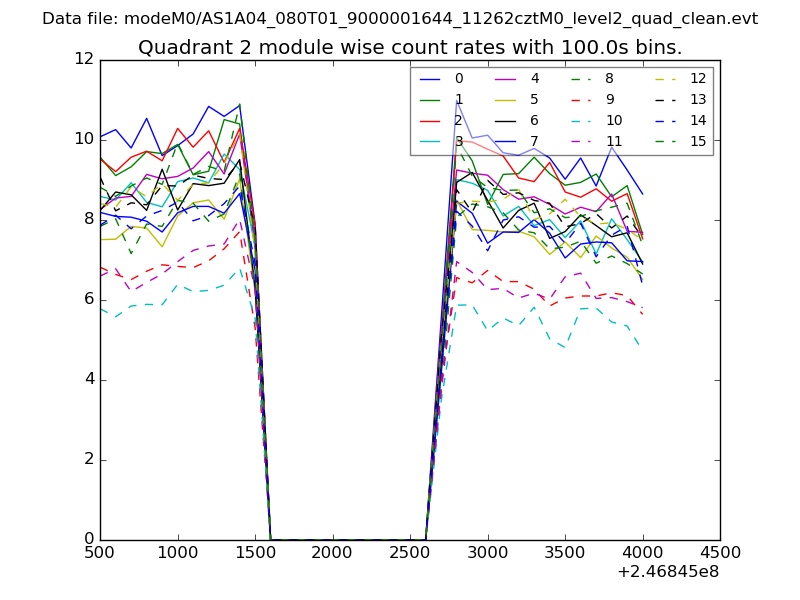
| Module-wise count rates for Quadrant B Data is divided into 100 sec bins |
 |
 |
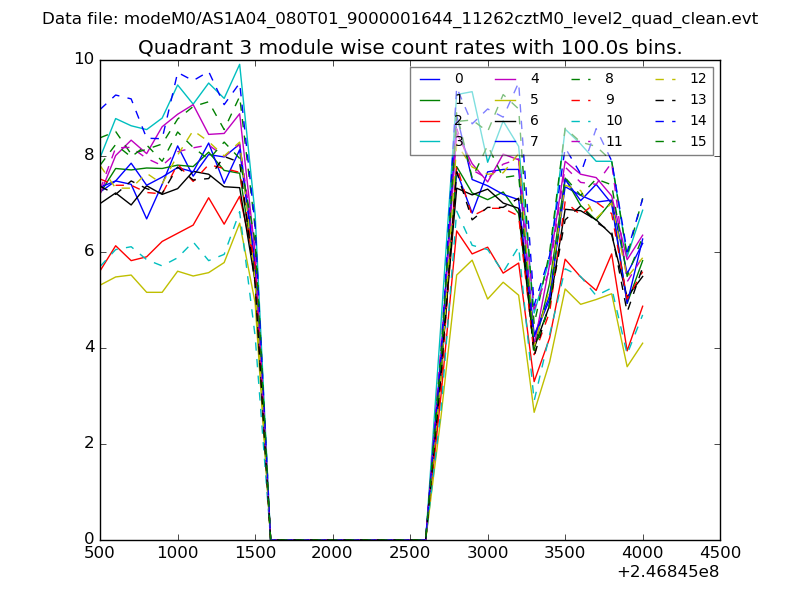
| Module-wise count rates for Quadrant C Data is divided into 100 sec bins |
 |
 |
| Module-wise count rates for Quadrant D Data is divided into 100 sec bins |
 |
 |
| Parameter | Plot |
|---|---|
| CZT HV Monitor | 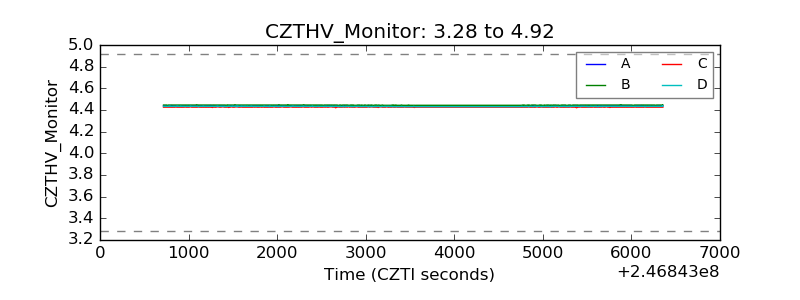 |
| D_VDD | 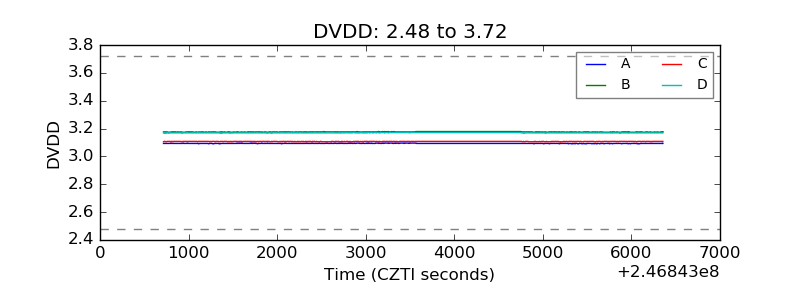 |
| Temperature 1 | 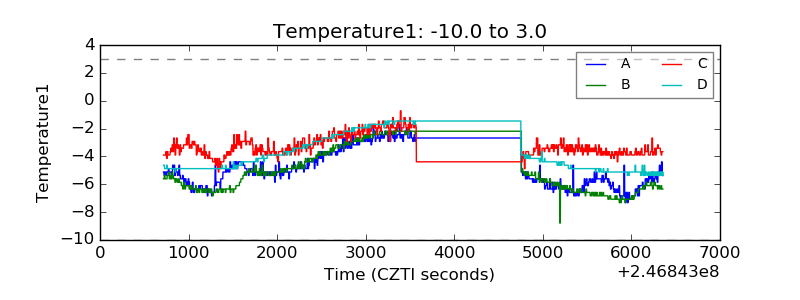 |
| Veto HV Monitor | 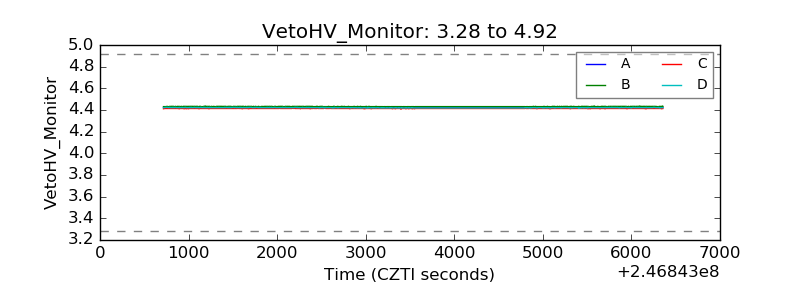 |
| Veto LLD | 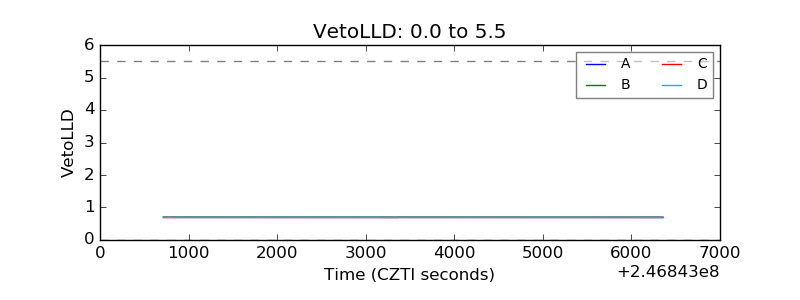 |
| Alpha Counter |  |
| _CPM_Rate | 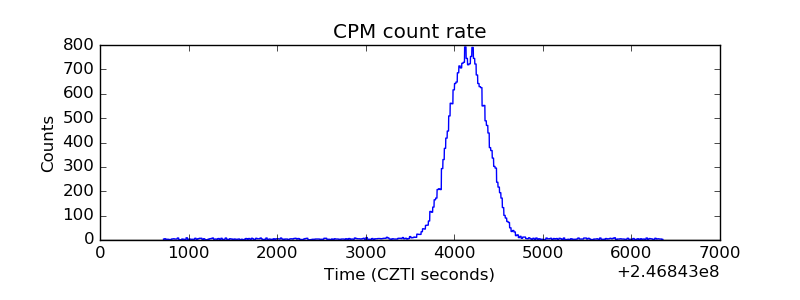 |
| CZT Counter | 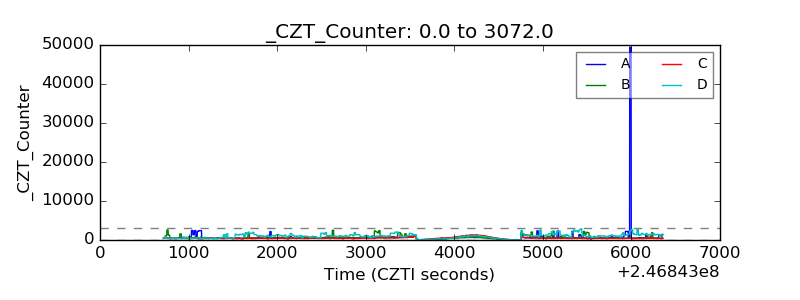 |
| +2.5 Volts monitor |  |
| +5 Volts monitor |  |
| _ROLL_ROT | 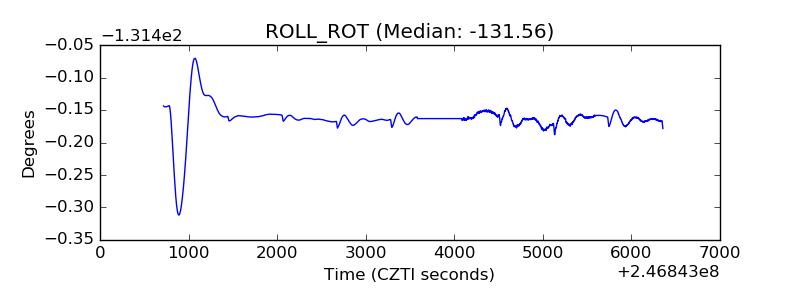 |
| _Roll_DEC | 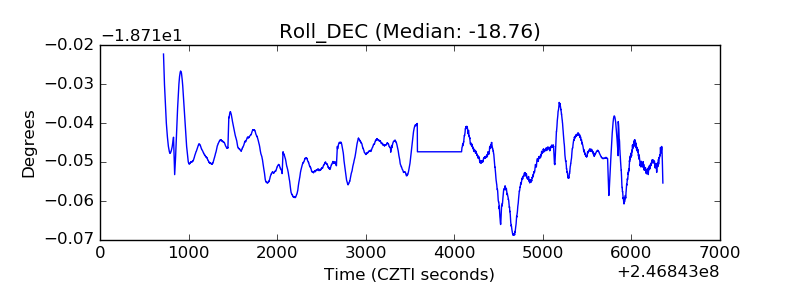 |
| _Roll_RA |  |
| Veto Counter | 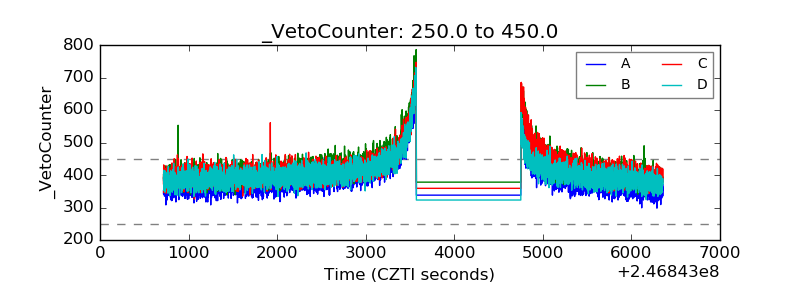 |