| Param | Original file | Final file |
|---|---|---|
| Filename | modeM0/AS1A04_080T01_9000001644_11264cztM0_level2.evt | modeM0/AS1A04_080T01_9000001644_11264cztM0_level2_quad_clean.evt |
| Size (bytes) | 804,951,360 | 88,724,160 |
| Size | 767.7 MB | 84.6 MB |
| Events in quadrant A | 4,143,664 | 561,418 |
| Events in quadrant B | 5,549,273 | 549,635 |
| Events in quadrant C | 3,445,608 | 565,291 |
| Events in quadrant D | 10,727,758 | 481,577 |
| Mode M0 | |||
|---|---|---|---|
| Quadrant | BADHDUFLAG | Total packets | Discarded packets |
| A | 0 | 17040 | 3 |
| B | 0 | 21512 | 2 |
| C | 0 | 15623 | 2 |
| D | 0 | 37246 | 2 |
| Mode SS | |||
|---|---|---|---|
| Quadrant | BADHDUFLAG | Total packets | Discarded packets |
| A | 0 | 156 | 0 |
| B | 0 | 156 | 0 |
| C | 0 | 156 | 0 |
| D | 0 | 156 | 0 |
| Mode M9 | |||
|---|---|---|---|
| Quadrant | BADHDUFLAG | Total packets | Discarded packets |
| A | 0 | 14 | 0 |
| B | 0 | 14 | 0 |
| C | 0 | 14 | 0 |
| D | 0 | 14 | 0 |
| Quadrant | Total seconds | Saturated seconds | Saturation percentage |
|---|---|---|---|
| A | 7593 | 79 | 1.040432% |
| B | 7593 | 671 | 8.837087% |
| C | 7593 | 56 | 0.737521% |
| D | 7593 | 881 | 11.602792% |
Noise dominated data is calculated using 1-second bins in cleaned event files. If a bin has >2000 counts, and if more than 50% of those come from <1% of pixels, then it is considered to be noise-dominated and hence unusable.
| Quadrant | # 1 sec bins | Bins with >0 counts | Bins with >2000 counts | High rate bins dominated by noise | Noise dominated (total time) | Noise dominated (detector-on time) | Marked lightcurve |
|---|---|---|---|---|---|---|---|
| A | 8998 | 7595 | 6 | 6 | 0.07% | 0.08% | 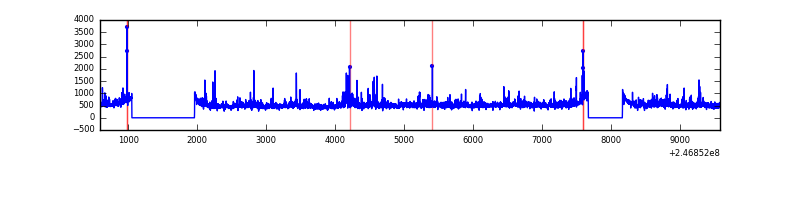 |
| B | 8998 | 7595 | 344 | 344 | 3.82% | 4.53% | 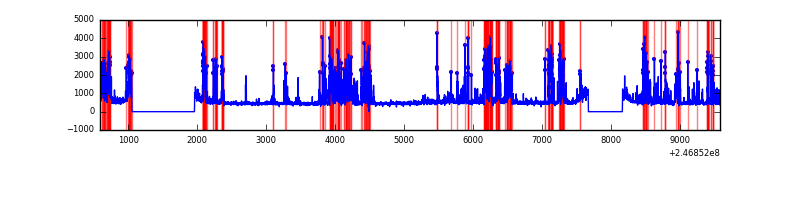 |
| C | 8998 | 7595 | 1 | 1 | 0.01% | 0.01% | 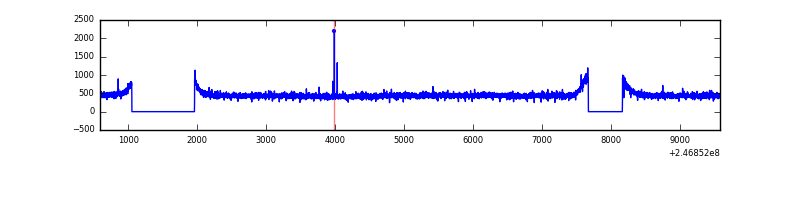 |
| D | 8998 | 7595 | 619 | 619 | 6.88% | 8.15% | 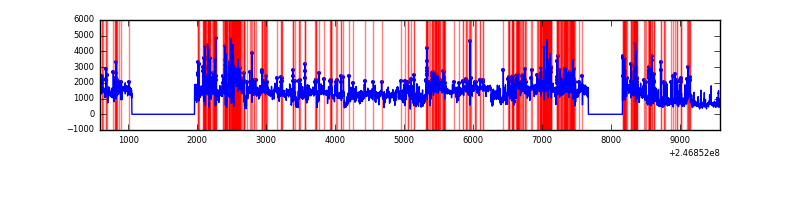 |
Top three noisy pixels from each quadrant. If the there are fewer than three noisy pixels in the level2.evt file, extra rows are filled as -1
| Pixel properties | Quadrant properties | ||||||
|---|---|---|---|---|---|---|---|
| Quadrant | DetID | PixID | Counts | Sigma | Mean | Median | Sigma |
| A | 13 | 251 | 243572 | 1312.12 | 901 | 880 | 185.0 |
| A | 8 | 5 | 99811 | 534.87 | 901 | 880 | 185.0 |
| A | 14 | 238 | 73305 | 391.57 | 901 | 880 | 185.0 |
| B | 4 | 239 | 1306306 | 7576.01 | 883 | 862 | 172.3 |
| B | 3 | 64 | 627711 | 3637.85 | 883 | 862 | 172.3 |
| B | 11 | 51 | 45148 | 257.01 | 883 | 862 | 172.3 |
| C | 13 | 61 | 6543 | 27.22 | 882 | 885 | 207.9 |
| C | 5 | 239 | 6065 | 24.92 | 882 | 885 | 207.9 |
| C | 12 | 4 | 2281 | 6.71 | 882 | 885 | 207.9 |
| D | 1 | 52 | 5691386 | 28232.55 | 832 | 809 | 201.6 |
| D | 13 | 152 | 690358 | 3421.05 | 832 | 809 | 201.6 |
| D | 10 | 253 | 362368 | 1793.8 | 832 | 809 | 201.6 |
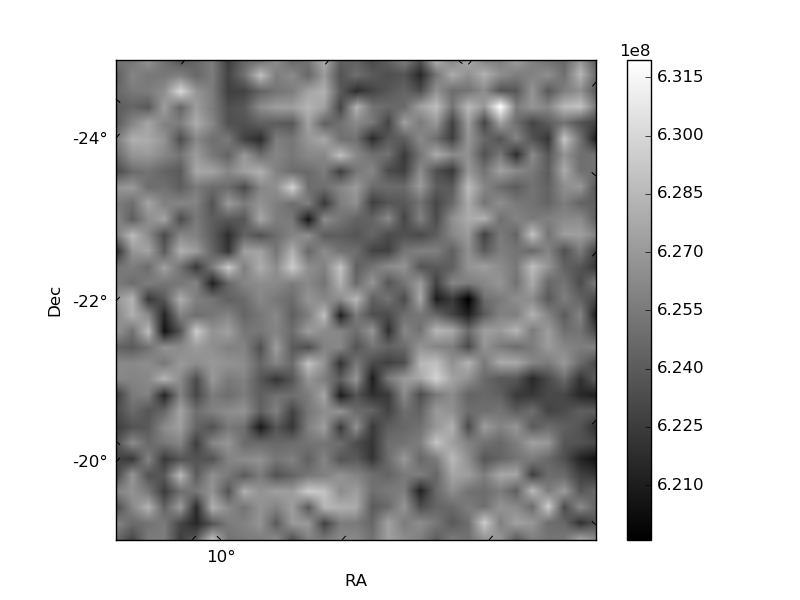
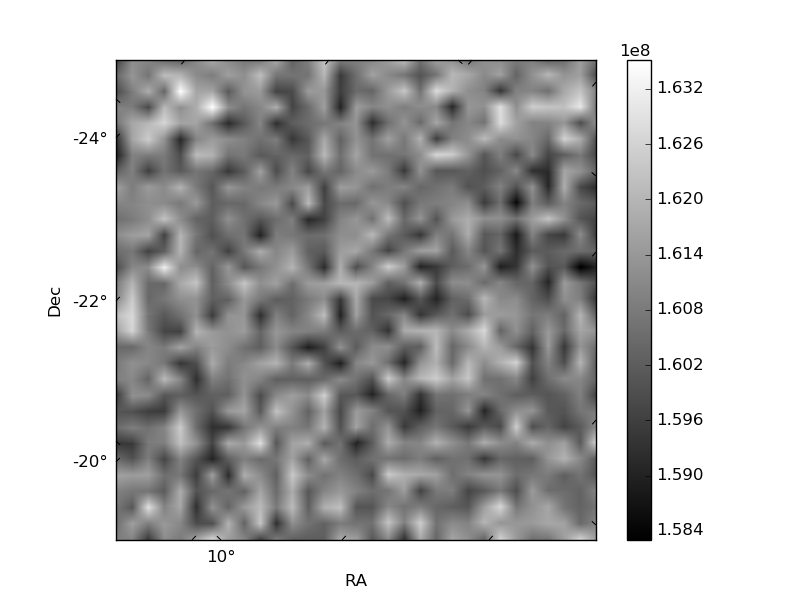
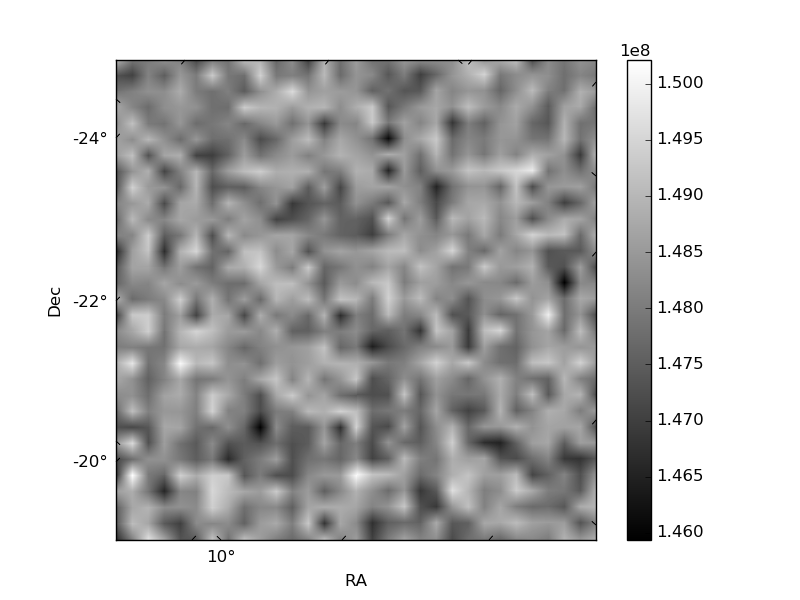
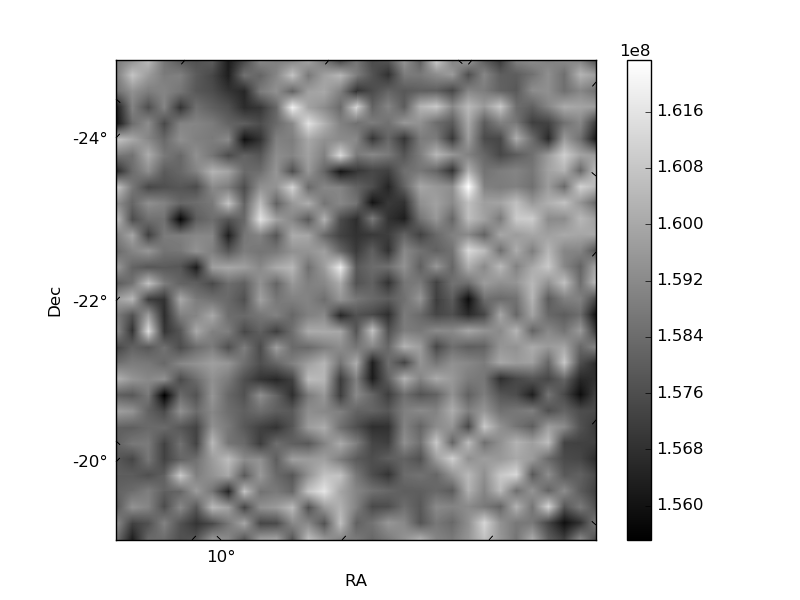
Histogram calculated using DETX and DETY for each event in the final _common_clean file
| Quadrant A | 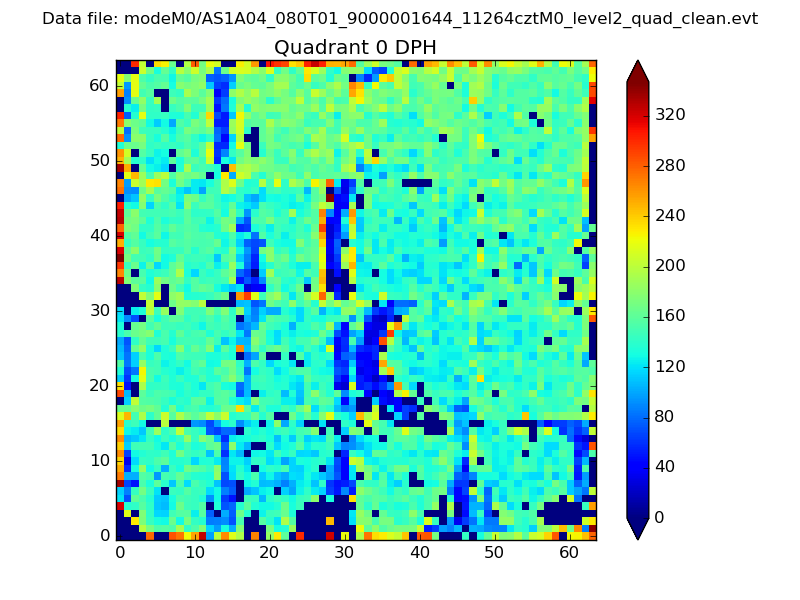 |
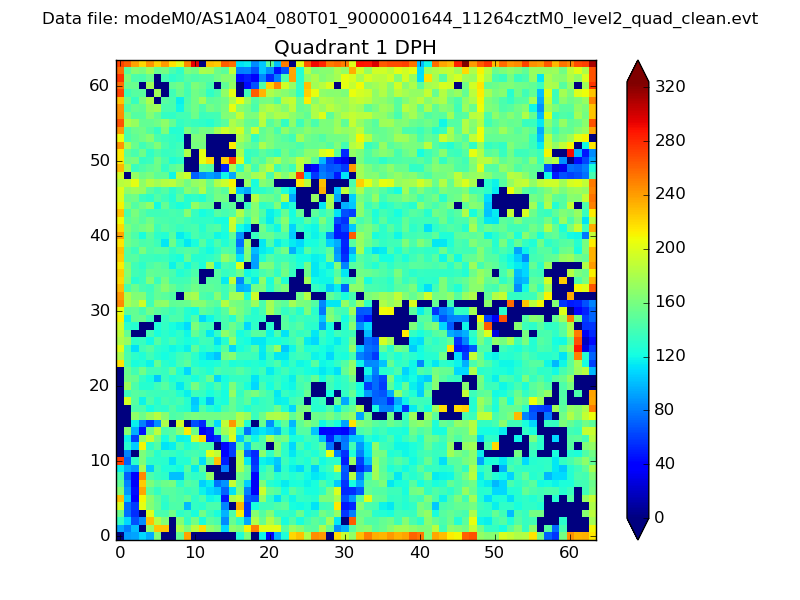 |
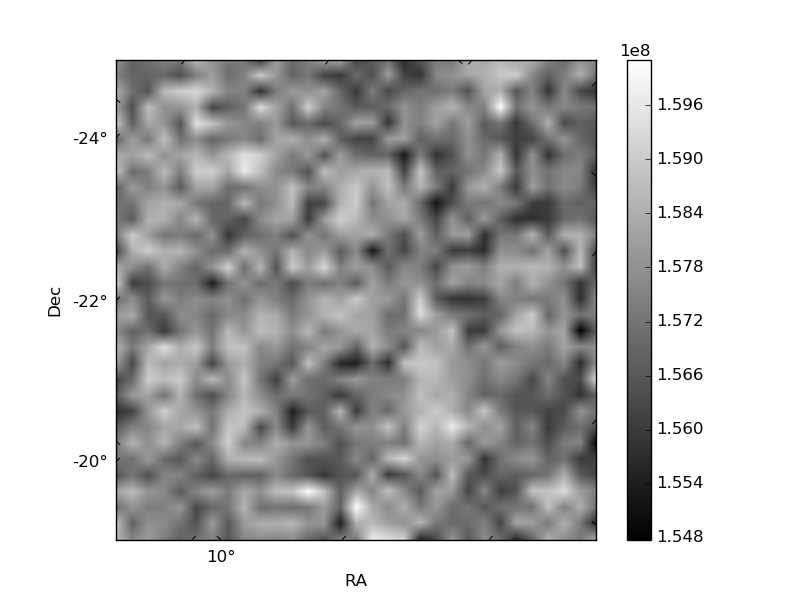
Quadrant B |
|---|---|---|---|
| Quadrant D | 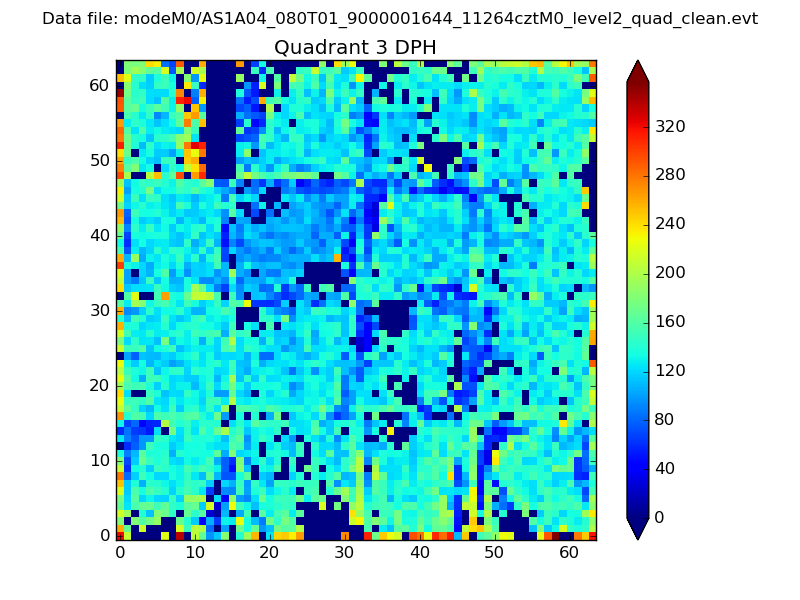 |
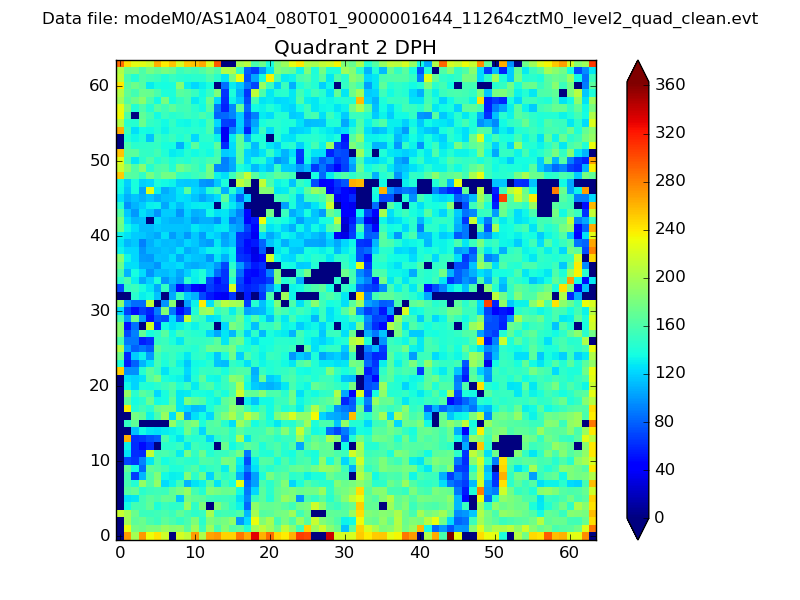 |
Quadrant C |
| Plot type | Count rate plots | Images |
|---|---|---|
| Comparison with Poisson distribution Blue bars denote a histogram of data divided into 1 sec bins. Red curve is a Poisson curve with rate = median count rate of data. |
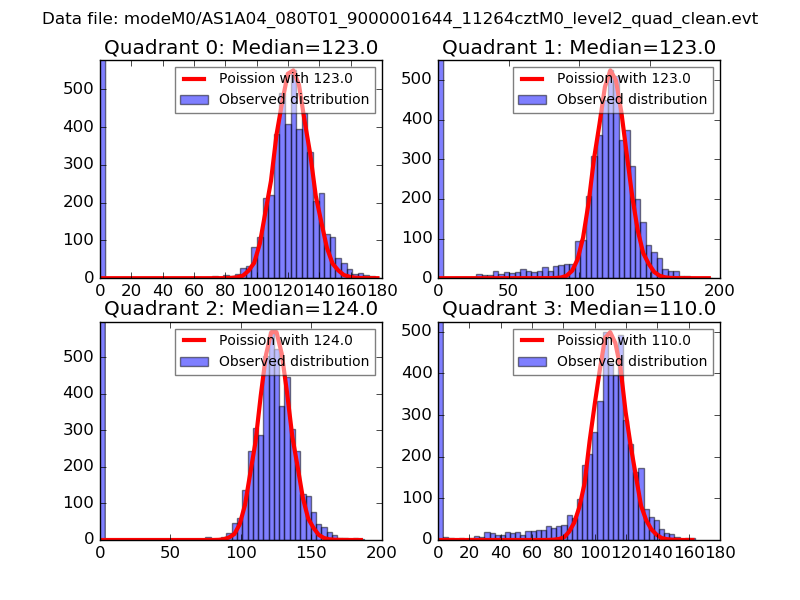 |
 |
| Quadrant-wise count rates Data is divided into 100 sec bins |
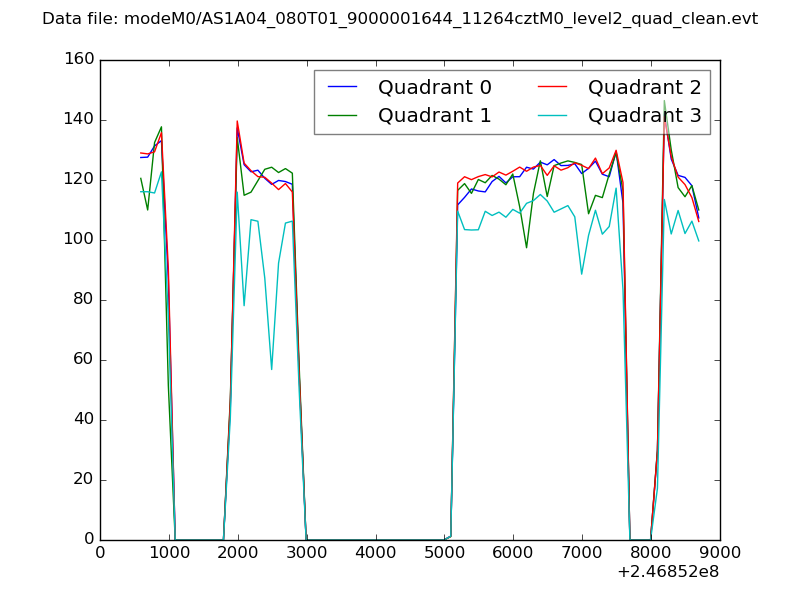 |
|
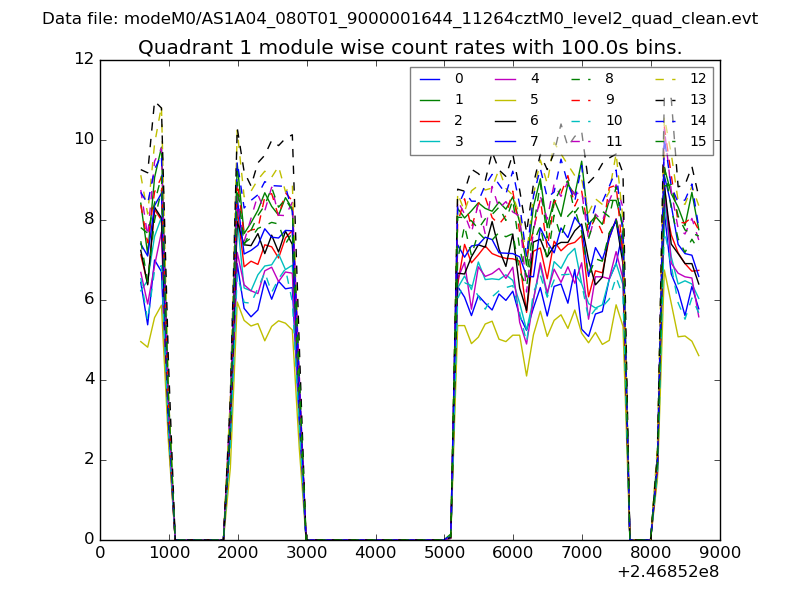
| Module-wise count rates for Quadrant A Data is divided into 100 sec bins |
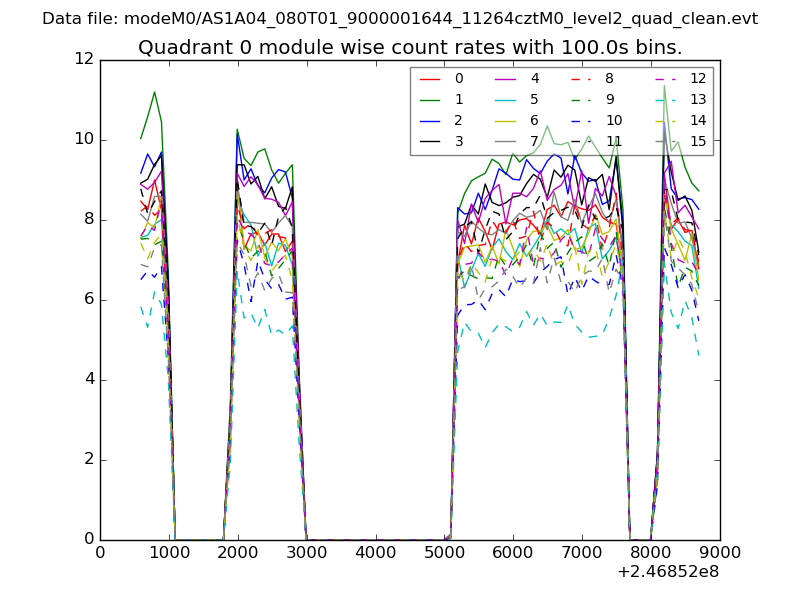 |
 |
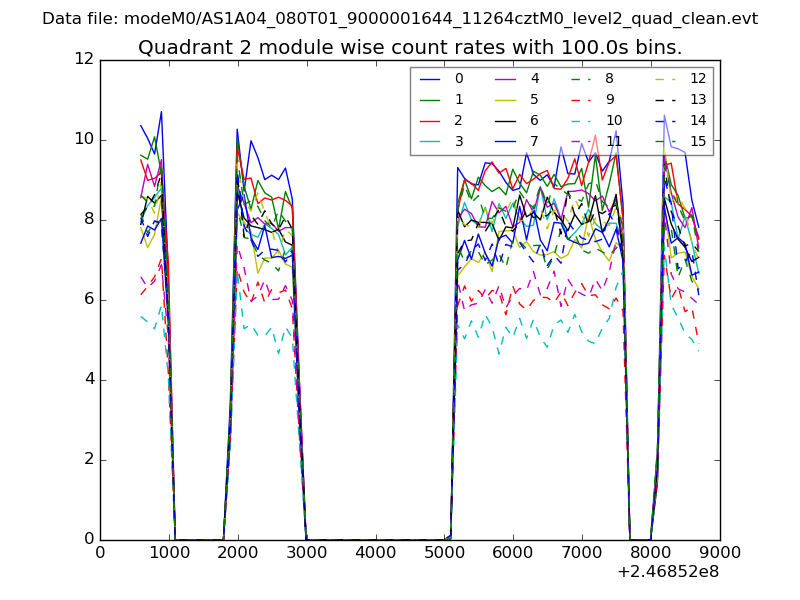
| Module-wise count rates for Quadrant B Data is divided into 100 sec bins |
 |
 |
| Module-wise count rates for Quadrant C Data is divided into 100 sec bins |
 |
 |
| Module-wise count rates for Quadrant D Data is divided into 100 sec bins |
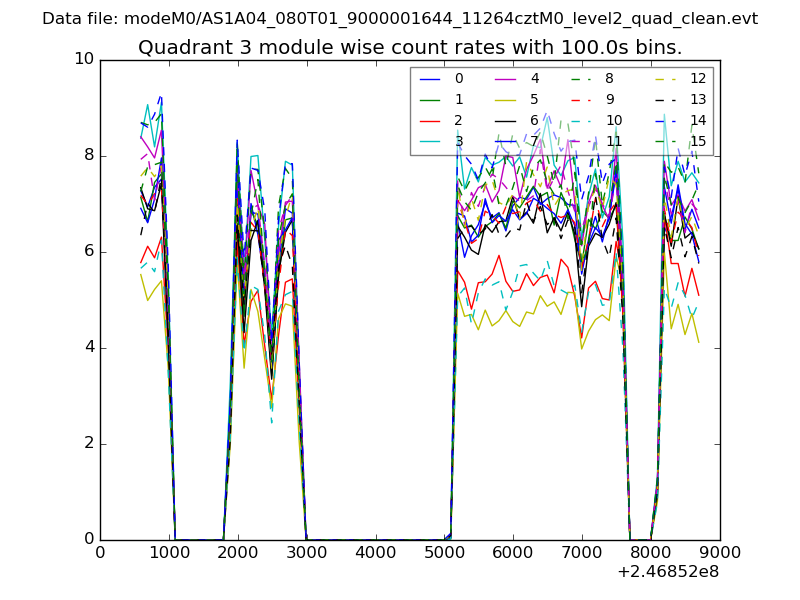 |
 |
| Parameter | Plot |
|---|---|
| CZT HV Monitor | 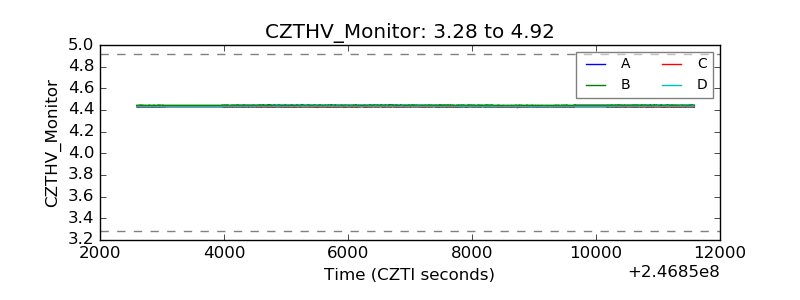 |
| D_VDD | 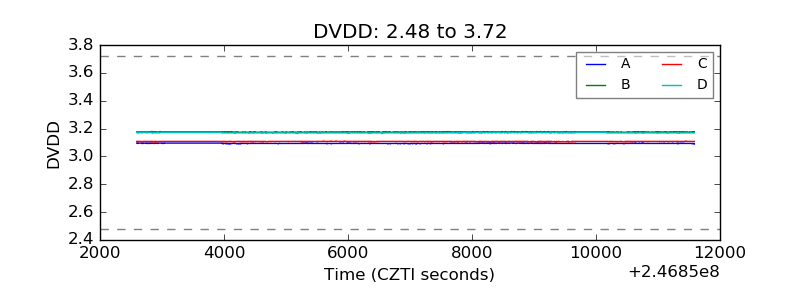 |
| Temperature 1 | 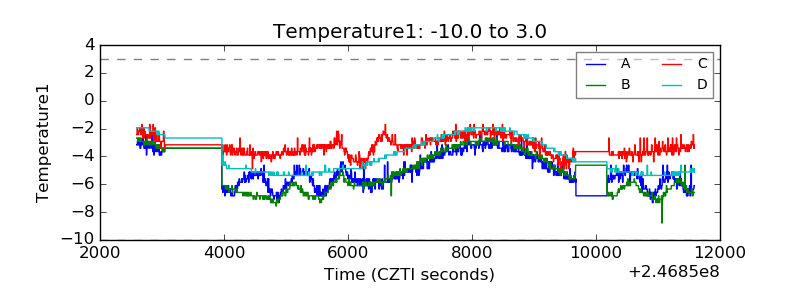 |
| Veto HV Monitor | 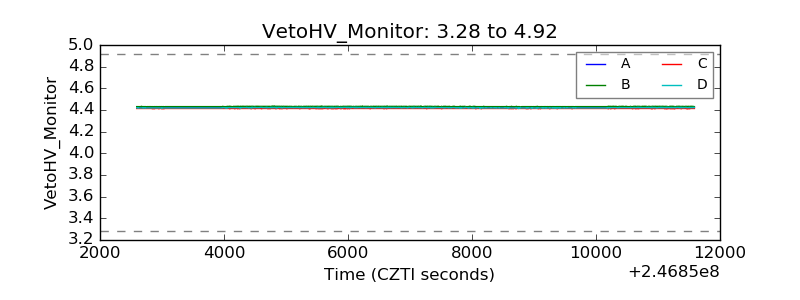 |
| Veto LLD | 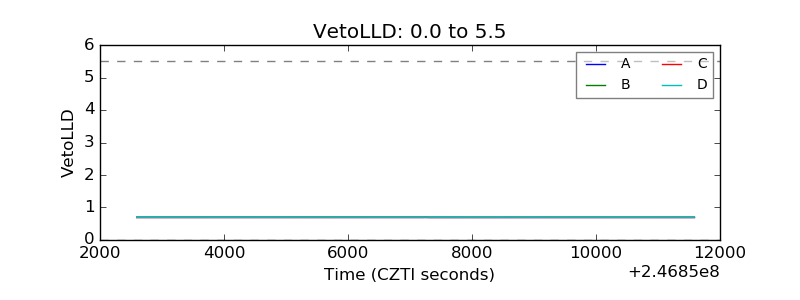 |
| Alpha Counter | 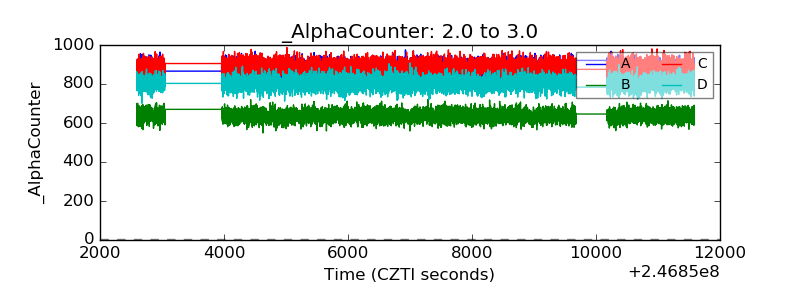 |
| _CPM_Rate | 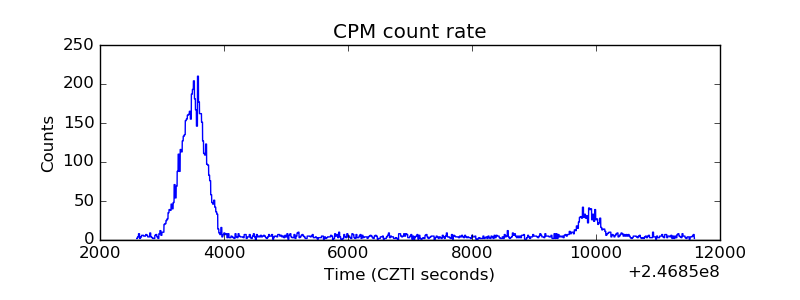 |
| CZT Counter | 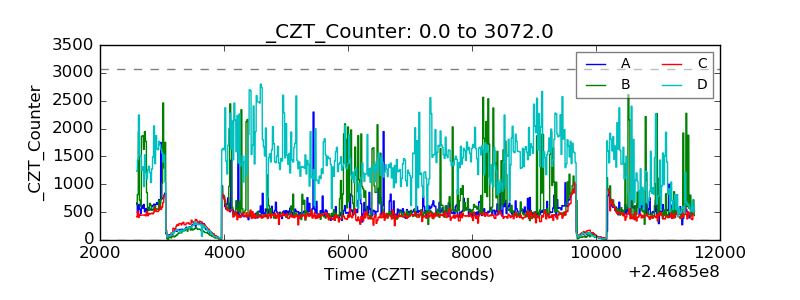 |
| +2.5 Volts monitor | 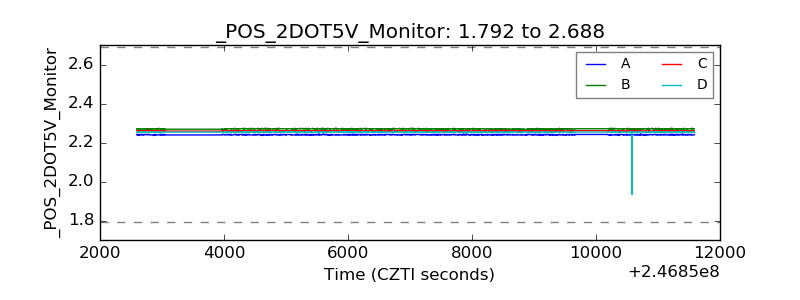 |
| +5 Volts monitor | 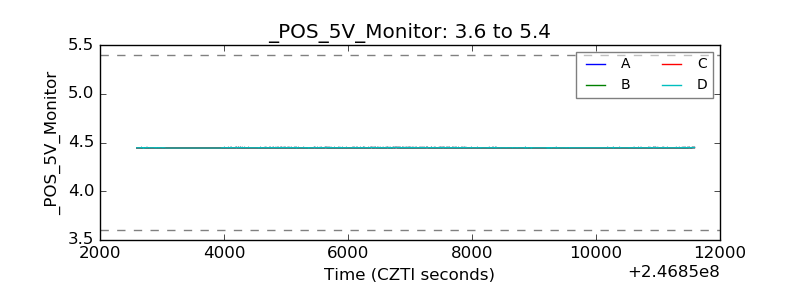 |
| _ROLL_ROT | 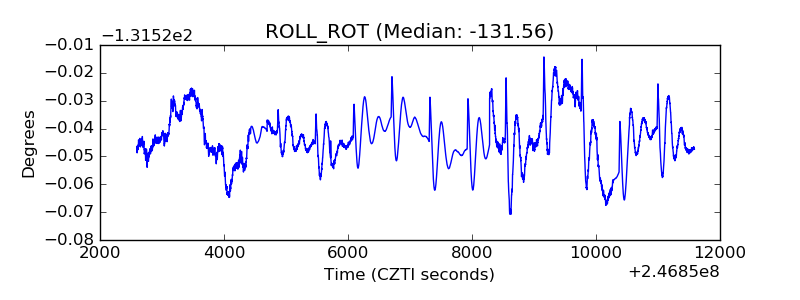 |
| _Roll_DEC | 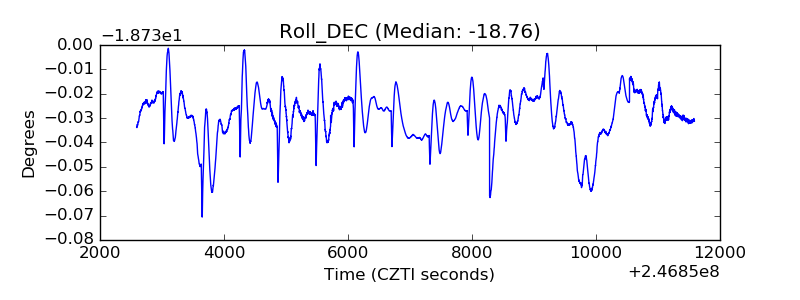 |
| _Roll_RA | 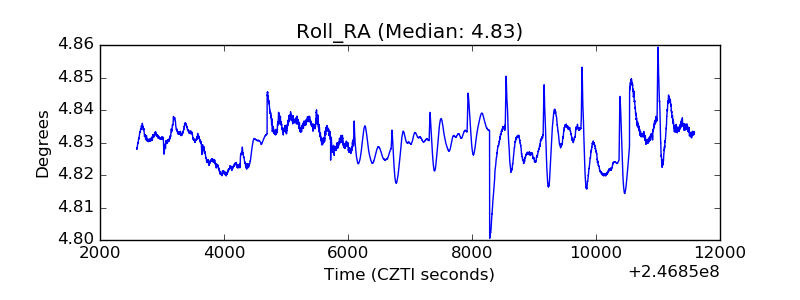 |
| Veto Counter | 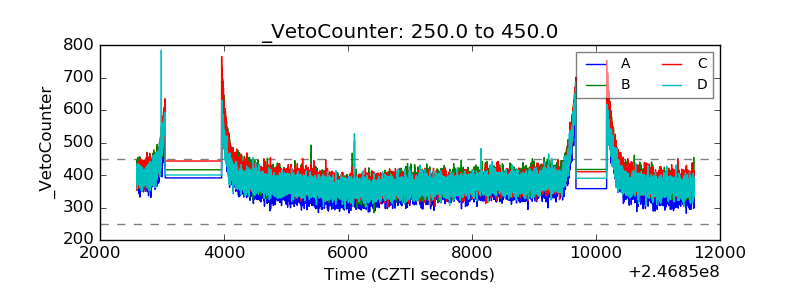 |