| Param | Original file | Final file |
|---|---|---|
| Filename | modeM0/AS1C03_012T01_9000001642cztM0_level2.fits | modeM0/AS1C03_012T01_9000001642cztM0_level2_quad_clean.evt |
| Size (bytes) | 309,752,640 | 320,267,520 |
| Size | 295.4 MB | 305.4 MB |
| Events in quadrant A | 1,872,818 | 1,988,457 |
| Events in quadrant B | 1,843,822 | 2,035,797 |
| Events in quadrant C | 1,914,544 | 1,938,203 |
| Events in quadrant D | 1,508,274 | 1,498,184 |
| Mode SS | |||
|---|---|---|---|
| Quadrant | BADHDUFLAG | Total packets | Discarded packets |
| A | 0 | 664 | 0 |
| B | 0 | 664 | 0 |
| C | 0 | 664 | 0 |
| D | 0 | 664 | 0 |
| Mode M9 | |||
|---|---|---|---|
| Quadrant | BADHDUFLAG | Total packets | Discarded packets |
| A | 0 | 78 | 0 |
| B | 0 | 78 | 0 |
| C | 0 | 78 | 0 |
| D | 0 | 78 | 0 |
| Mode M0 | |||
|---|---|---|---|
| Quadrant | BADHDUFLAG | Total packets | Discarded packets |
| A | 0 | 87866 | 0 |
| B | 0 | 82435 | 0 |
| C | 0 | 67965 | 0 |
| D | 0 | 120782 | 0 |
| Quadrant | Total seconds | Saturated seconds | Saturation percentage |
|---|---|---|---|
| A | 32581 | 1526 | 4.683711% |
| B | 32581 | 1349 | 4.140450% |
| C | 32581 | 195 | 0.598508% |
| D | 32581 | 5213 | 16.000123% |
Noise dominated data is calculated using 1-second bins in cleaned event files. If a bin has >2000 counts, and if more than 50% of those come from <1% of pixels, then it is considered to be noise-dominated and hence unusable.
| Quadrant | # 1 sec bins | Bins with >0 counts | Bins with >2000 counts | High rate bins dominated by noise | Noise dominated (total time) | Noise dominated (detector-on time) | Marked lightcurve |
|---|---|---|---|---|---|---|---|
| A | 40316 | 32566 | 0 | 0 | 0.00% | 0.00% |  |
| B | 40316 | 32580 | 0 | 0 | 0.00% | 0.00% | 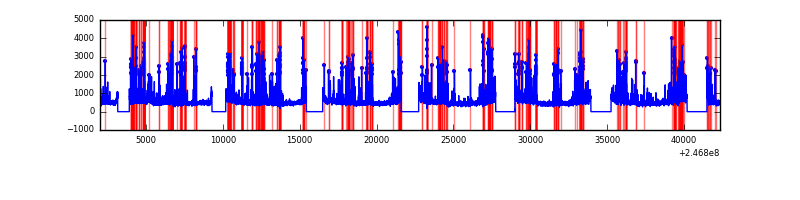 |
| C | 40316 | 32578 | 0 | 0 | 0.00% | 0.00% |  |
| D | 40316 | 32501 | 0 | 0 | 0.00% | 0.00% | 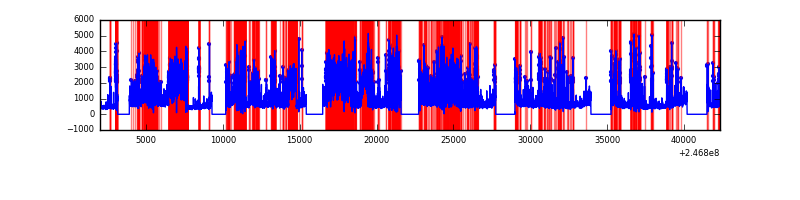 |
Top three noisy pixels from each quadrant. If the there are fewer than three noisy pixels in the level2.evt file, extra rows are filled as -1
| Pixel properties | Quadrant properties | ||||||
|---|---|---|---|---|---|---|---|
| Quadrant | DetID | PixID | Counts | Sigma | Mean | Median | Sigma |
| A | 14 | 188 | 1983 | 12.58 | 486 | 457 | 121.3 |
| A | 0 | 29 | 1805 | 11.11 | 486 | 457 | 121.3 |
| A | 14 | 204 | 1676 | 10.05 | 486 | 457 | 121.3 |
| B | 2 | 9 | 1614 | 11.86 | 486 | 464 | 96.9 |
| B | 2 | 8 | 1218 | 7.78 | 486 | 464 | 96.9 |
| B | 12 | 226 | 1217 | 7.77 | 486 | 464 | 96.9 |
| C | 1 | 80 | 1423 | 7.19 | 505 | 471 | 132.4 |
| C | 1 | 81 | 1387 | 6.91 | 505 | 471 | 132.4 |
| C | 1 | 65 | 1303 | 6.28 | 505 | 471 | 132.4 |
| D | 6 | 231 | 1166 | 6.61 | 430 | 391 | 117.2 |
| D | 10 | 189 | 1096 | 6.02 | 430 | 391 | 117.2 |
| D | 4 | 160 | 1077 | 5.85 | 430 | 391 | 117.2 |
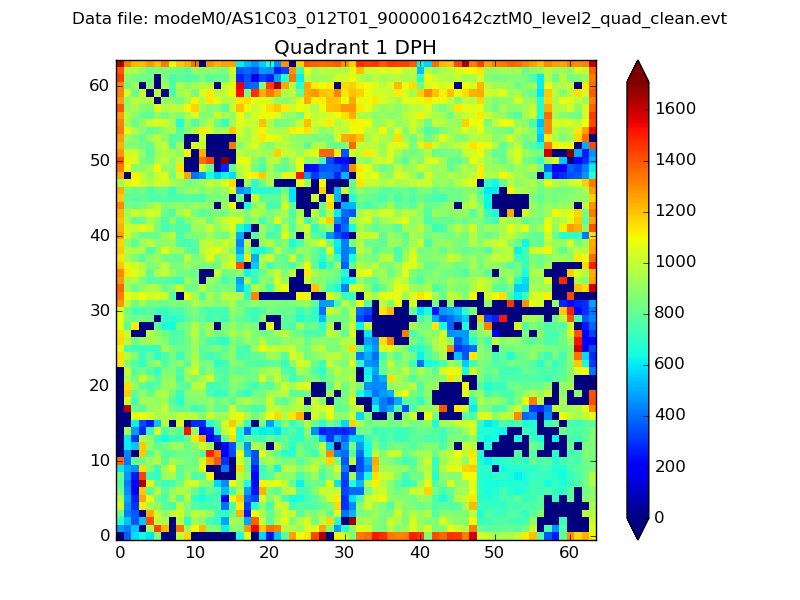
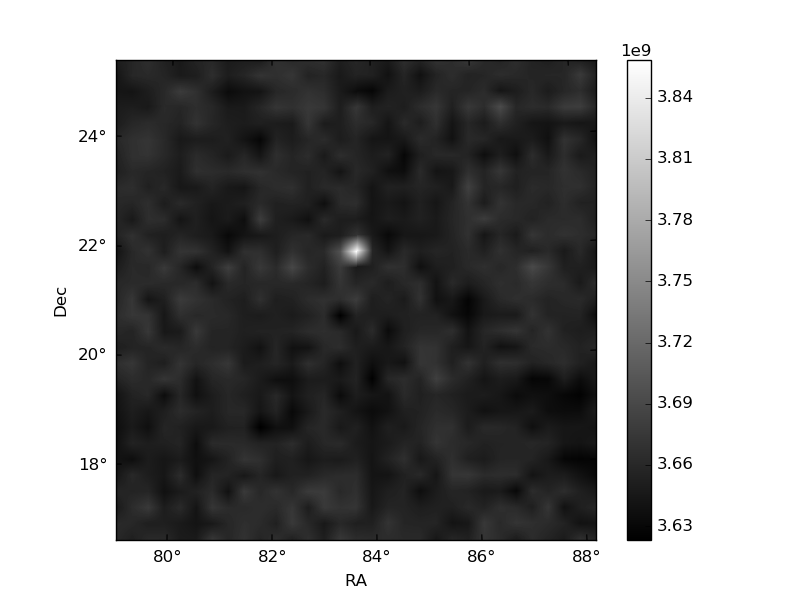
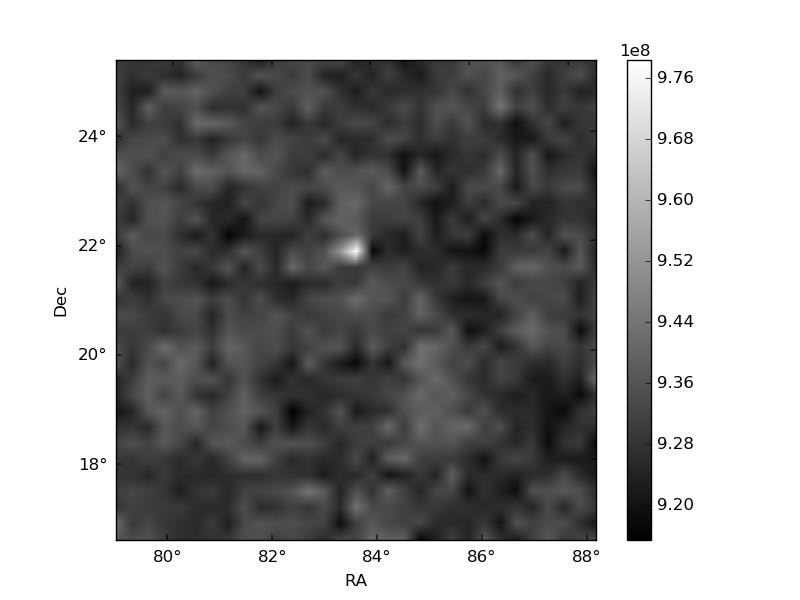
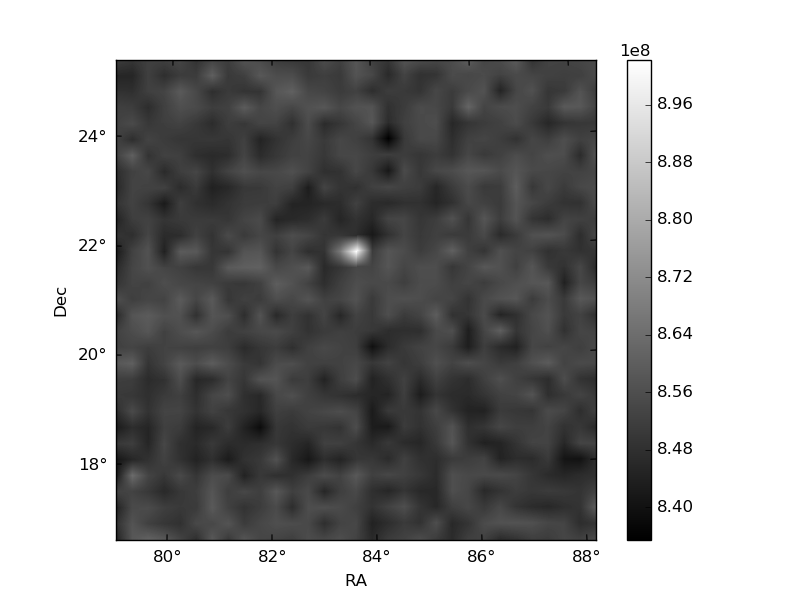
Histogram calculated using DETX and DETY for each event in the final _common_clean file
| Quadrant A |  |
 |
Quadrant B |
|---|---|---|---|
| Quadrant D | 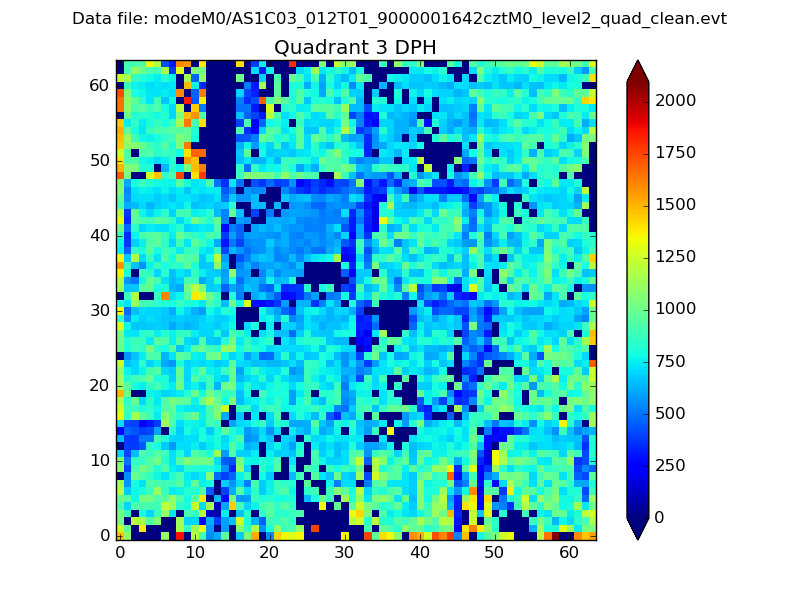 |
 |
Quadrant C |
| Plot type | Count rate plots | Images |
|---|---|---|
| Comparison with Poisson distribution Blue bars denote a histogram of data divided into 1 sec bins. Red curve is a Poisson curve with rate = median count rate of data. |
 |
 |
| Quadrant-wise count rates Data is divided into 100 sec bins |
 |
|
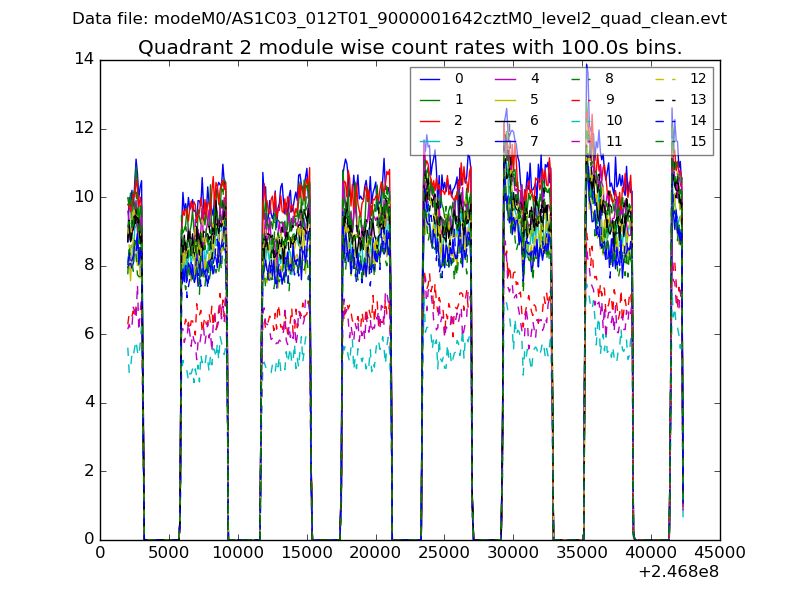
| Module-wise count rates for Quadrant A Data is divided into 100 sec bins |
 |
 |
| Module-wise count rates for Quadrant B Data is divided into 100 sec bins |
 |
 |
| Module-wise count rates for Quadrant C Data is divided into 100 sec bins |
 |
 |
| Module-wise count rates for Quadrant D Data is divided into 100 sec bins |
 |
 |
| Parameter | Plot |
|---|---|
| CZT HV Monitor |  |
| D_VDD | 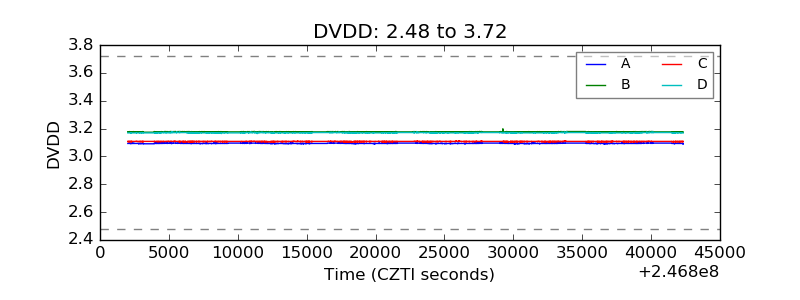 |
| Temperature 1 | 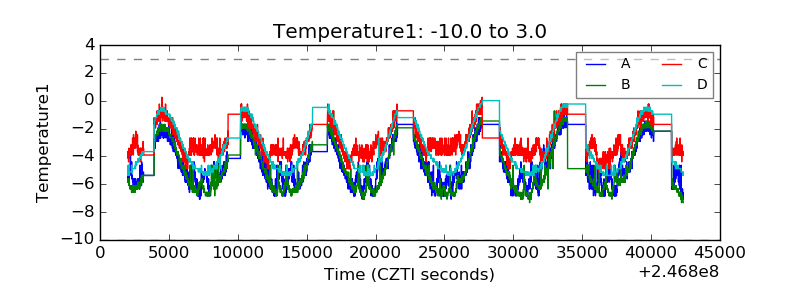 |
| Veto HV Monitor |  |
| Veto LLD |  |
| Alpha Counter | 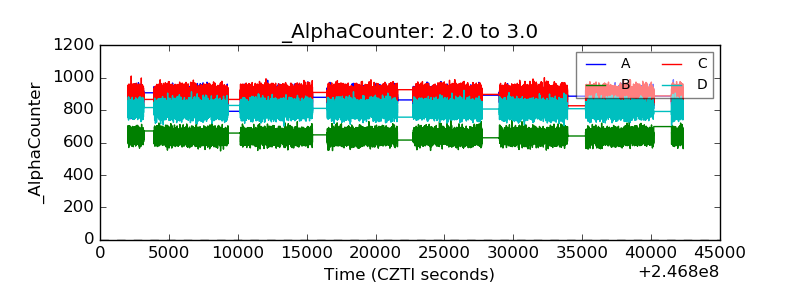 |
| _CPM_Rate | 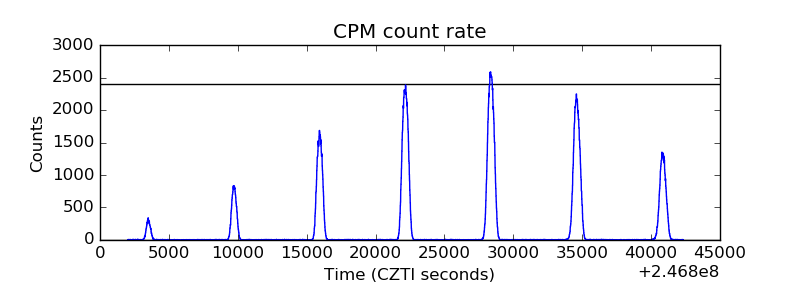 |
| CZT Counter |  |
| +2.5 Volts monitor |  |
| +5 Volts monitor |  |
| _ROLL_ROT | 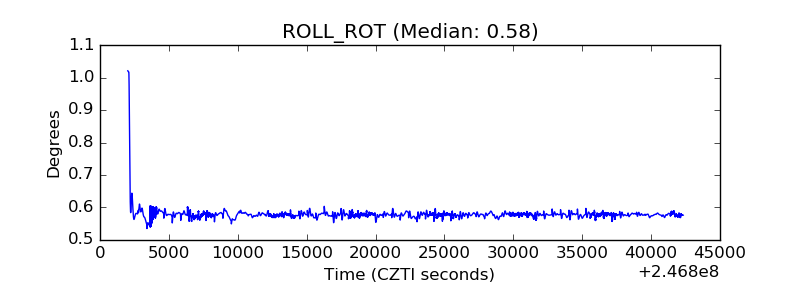 |
| _Roll_DEC |  |
| _Roll_RA |  |
| Veto Counter |  |