| Param | Original file | Final file |
|---|---|---|
| Filename | modeM0/AS1C03_012T01_9000001642_11255cztM0_level2.evt | modeM0/AS1C03_012T01_9000001642_11255cztM0_level2_quad_clean.evt |
| Size (bytes) | 704,387,520 | 72,714,240 |
| Size | 671.8 MB | 69.3 MB |
| Events in quadrant A | 4,817,895 | 443,005 |
| Events in quadrant B | 4,651,042 | 457,833 |
| Events in quadrant C | 3,221,091 | 455,266 |
| Events in quadrant D | 8,178,956 | 367,558 |
| Mode SS | |||
|---|---|---|---|
| Quadrant | BADHDUFLAG | Total packets | Discarded packets |
| A | 0 | 140 | 0 |
| B | 0 | 140 | 0 |
| C | 0 | 140 | 0 |
| D | 0 | 140 | 0 |
| Mode M9 | |||
|---|---|---|---|
| Quadrant | BADHDUFLAG | Total packets | Discarded packets |
| A | 0 | 17 | 0 |
| B | 0 | 17 | 0 |
| C | 0 | 17 | 0 |
| D | 0 | 17 | 0 |
| Mode M0 | |||
|---|---|---|---|
| Quadrant | BADHDUFLAG | Total packets | Discarded packets |
| A | 0 | 18644 | 3 |
| B | 0 | 18163 | 2 |
| C | 0 | 14057 | 2 |
| D | 0 | 29125 | 2 |
| Quadrant | Total seconds | Saturated seconds | Saturation percentage |
|---|---|---|---|
| A | 6852 | 456 | 6.654991% |
| B | 6852 | 455 | 6.640397% |
| C | 6852 | 74 | 1.079977% |
| D | 6852 | 1810 | 26.415645% |
Noise dominated data is calculated using 1-second bins in cleaned event files. If a bin has >2000 counts, and if more than 50% of those come from <1% of pixels, then it is considered to be noise-dominated and hence unusable.
| Quadrant | # 1 sec bins | Bins with >0 counts | Bins with >2000 counts | High rate bins dominated by noise | Noise dominated (total time) | Noise dominated (detector-on time) | Marked lightcurve |
|---|---|---|---|---|---|---|---|
| A | 8507 | 6854 | 282 | 282 | 3.31% | 4.11% | 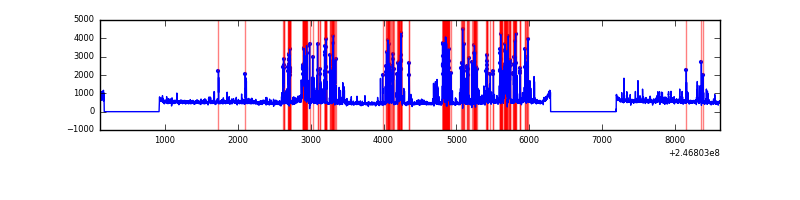 |
| B | 8507 | 6854 | 203 | 203 | 2.39% | 2.96% | 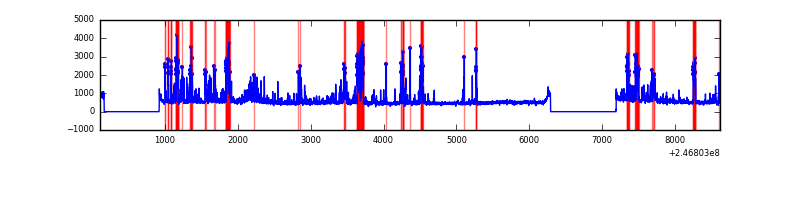 |
| C | 8507 | 6854 | 0 | 0 | 0.00% | 0.00% | 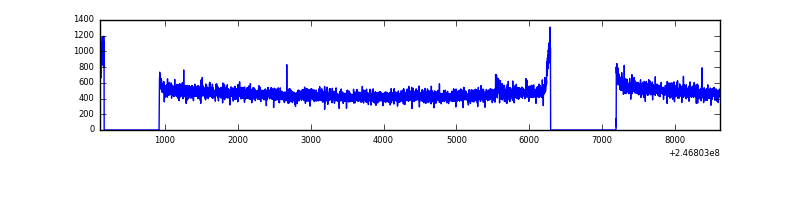 |
| D | 8507 | 6854 | 1325 | 1325 | 15.58% | 19.33% | 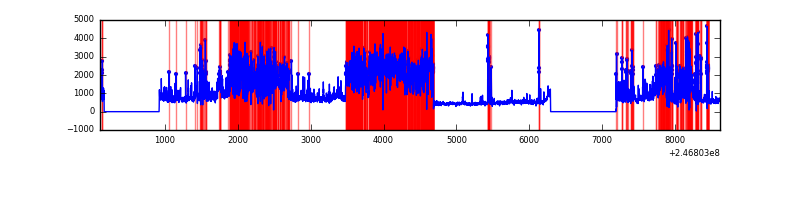 |
Top three noisy pixels from each quadrant. If the there are fewer than three noisy pixels in the level2.evt file, extra rows are filled as -1
| Pixel properties | Quadrant properties | ||||||
|---|---|---|---|---|---|---|---|
| Quadrant | DetID | PixID | Counts | Sigma | Mean | Median | Sigma |
| A | 14 | 238 | 1223603 | 7209.69 | 833 | 817 | 169.6 |
| A | 8 | 5 | 181175 | 1063.41 | 833 | 817 | 169.6 |
| A | 8 | 15 | 139396 | 817.08 | 833 | 817 | 169.6 |
| B | 4 | 239 | 1029151 | 6443.59 | 835 | 816 | 159.6 |
| B | 11 | 51 | 178590 | 1113.94 | 835 | 816 | 159.6 |
| B | 15 | 204 | 57309 | 353.98 | 835 | 816 | 159.6 |
| C | 7 | 238 | 6729 | 30.96 | 824 | 829 | 190.5 |
| C | 13 | 61 | 6087 | 27.59 | 824 | 829 | 190.5 |
| C | 8 | 222 | 2635 | 9.48 | 824 | 829 | 190.5 |
| D | 13 | 152 | 4566440 | 25721.85 | 732 | 711 | 177.5 |
| D | 8 | 195 | 272985 | 1533.9 | 732 | 711 | 177.5 |
| D | 14 | 34 | 166959 | 936.59 | 732 | 711 | 177.5 |
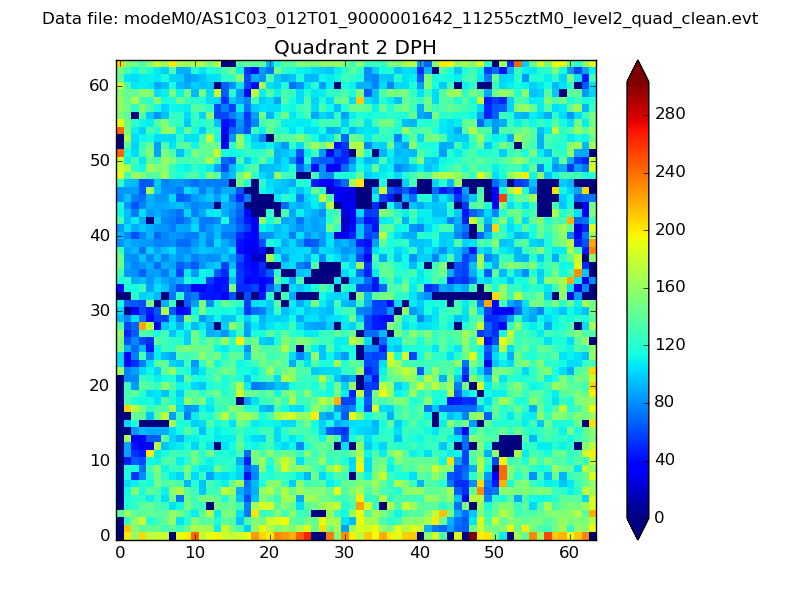
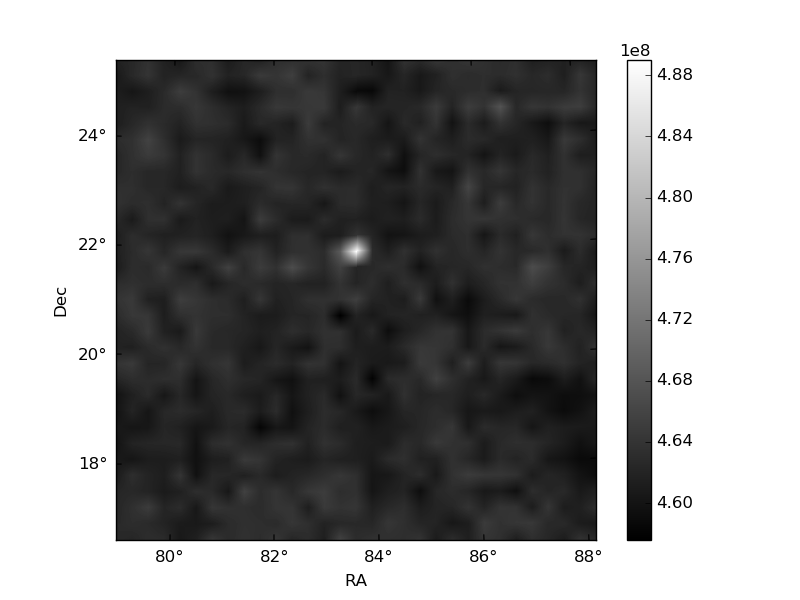
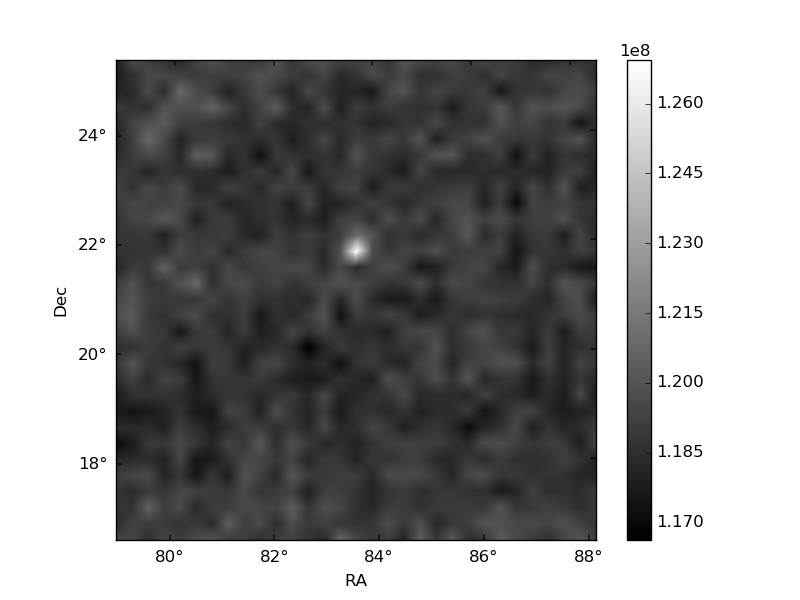
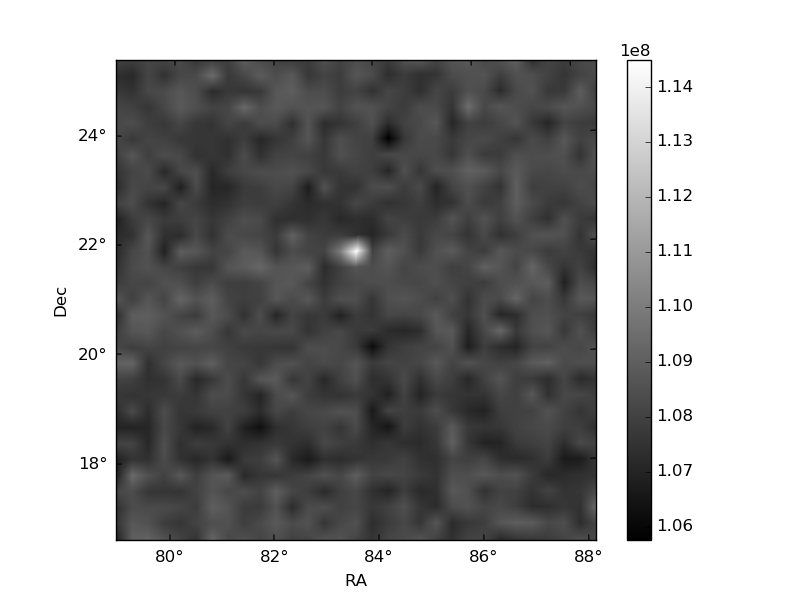
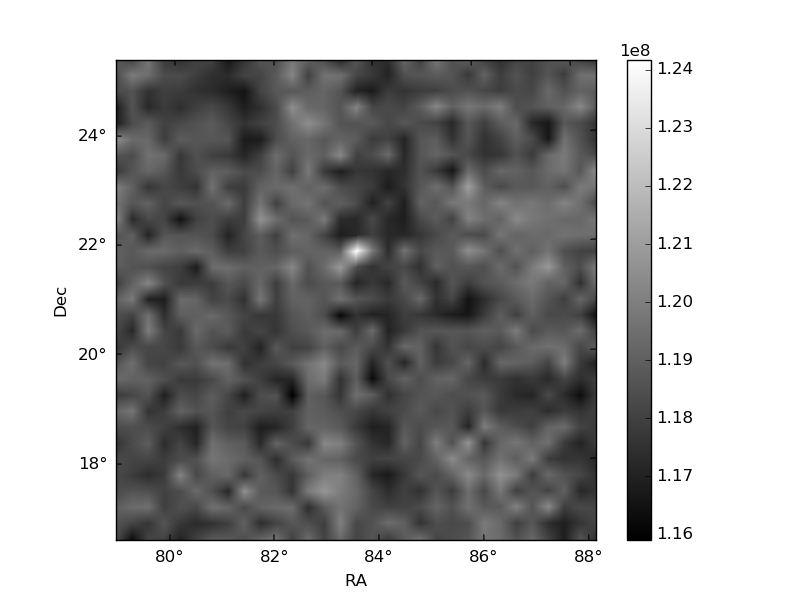
Histogram calculated using DETX and DETY for each event in the final _common_clean file
| Quadrant A | 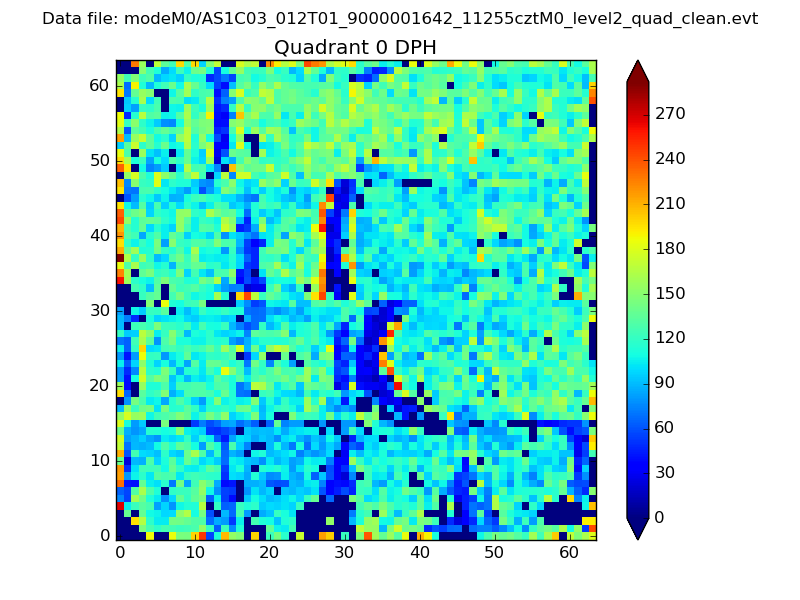 |
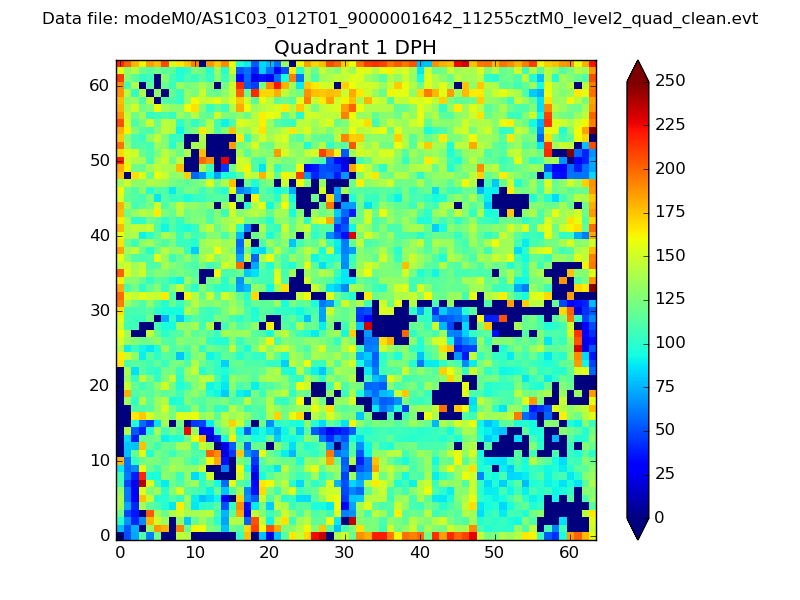 |
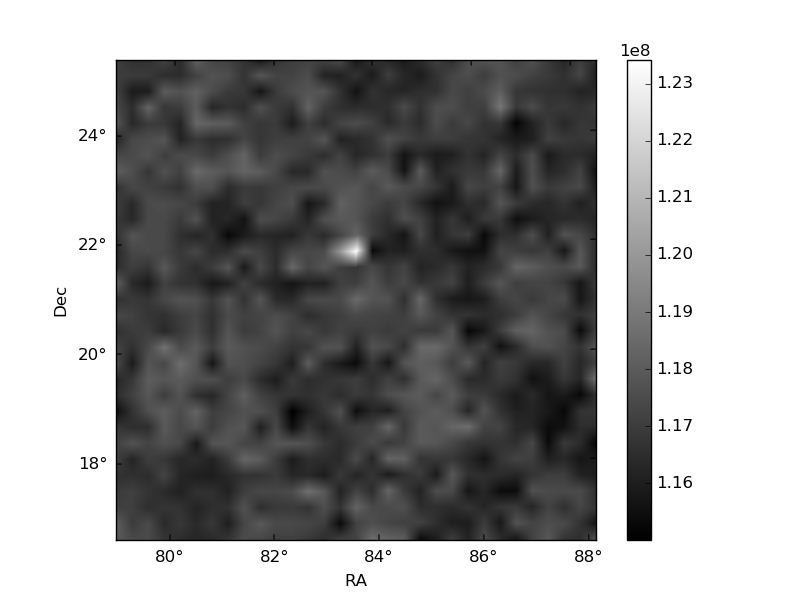
Quadrant B |
|---|---|---|---|
| Quadrant D | 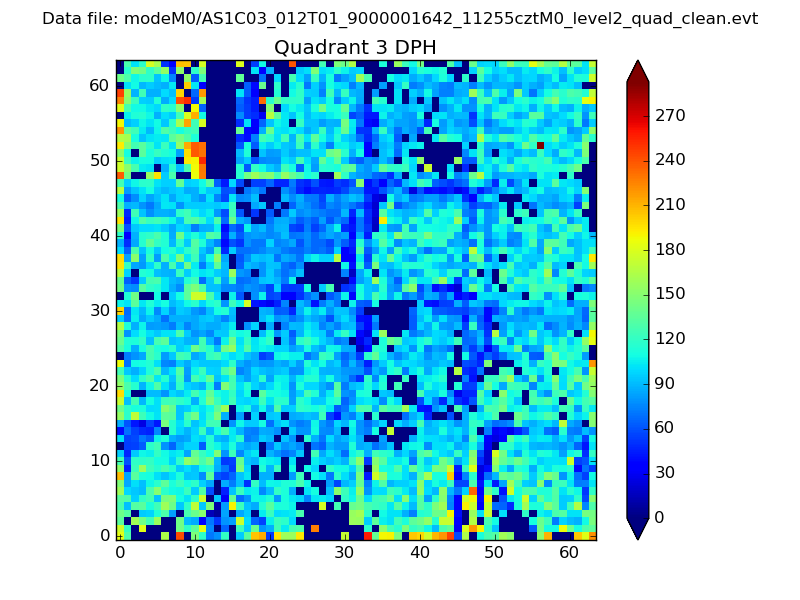 |
 |
Quadrant C |
| Plot type | Count rate plots | Images |
|---|---|---|
| Comparison with Poisson distribution Blue bars denote a histogram of data divided into 1 sec bins. Red curve is a Poisson curve with rate = median count rate of data. |
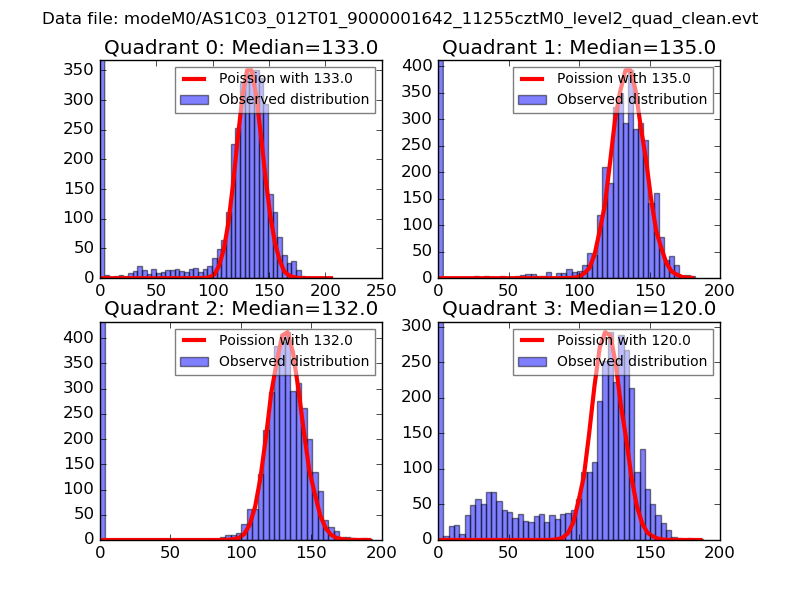 |
 |
| Quadrant-wise count rates Data is divided into 100 sec bins |
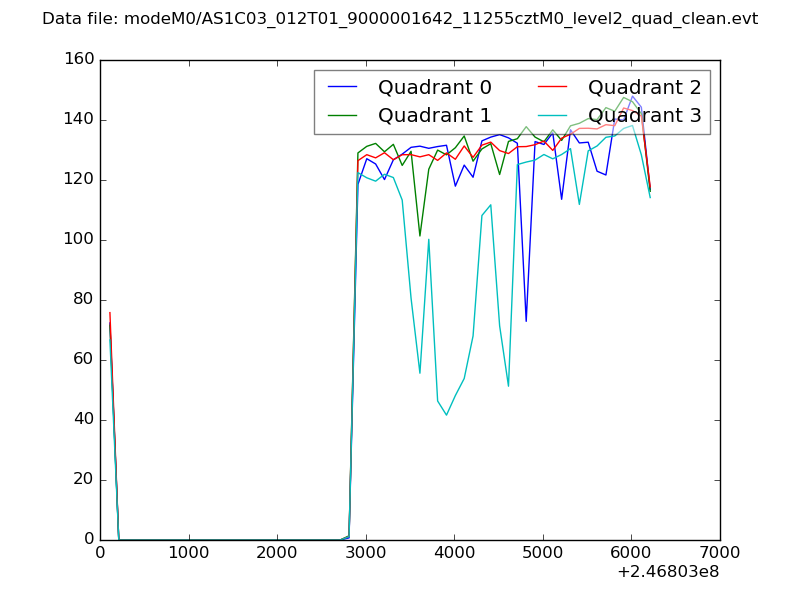 |
|
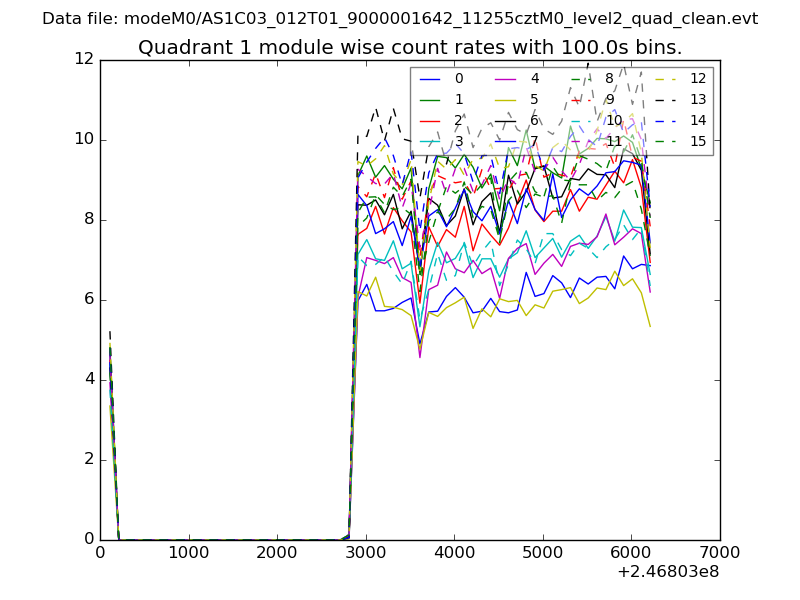
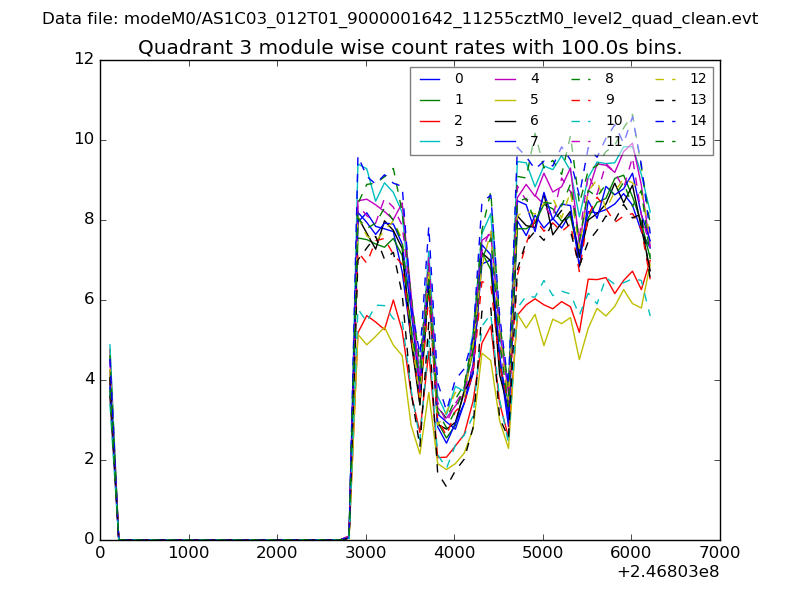
| Module-wise count rates for Quadrant A Data is divided into 100 sec bins |
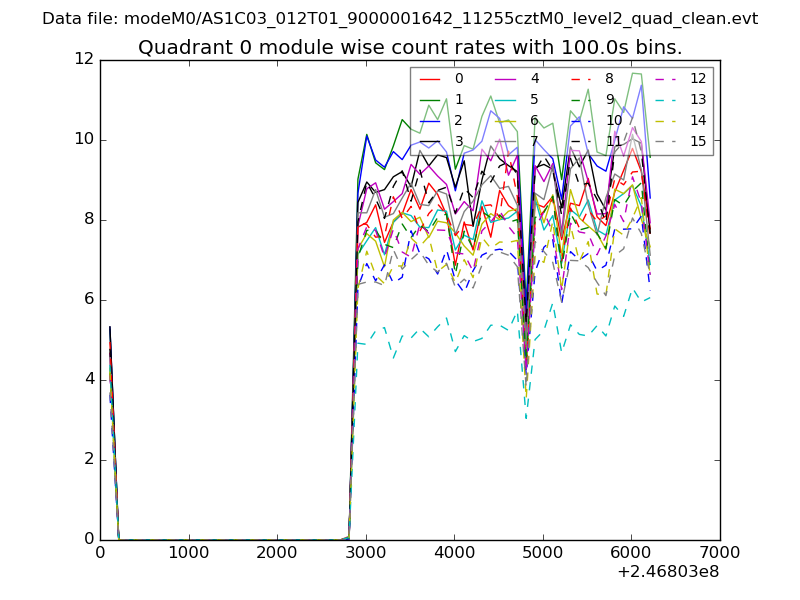 |
 |
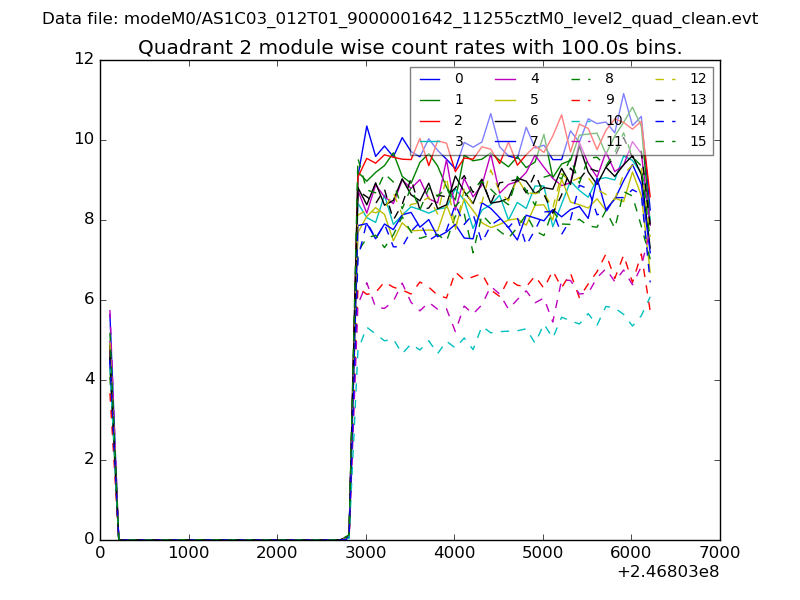
| Module-wise count rates for Quadrant B Data is divided into 100 sec bins |
 |
 |
| Module-wise count rates for Quadrant C Data is divided into 100 sec bins |
 |
 |
| Module-wise count rates for Quadrant D Data is divided into 100 sec bins |
 |
 |
| Parameter | Plot |
|---|---|
| CZT HV Monitor | 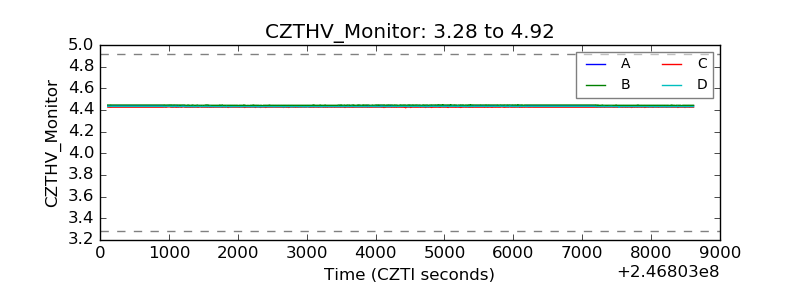 |
| D_VDD | 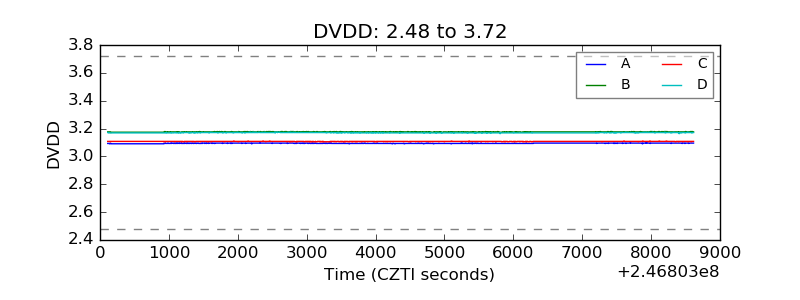 |
| Temperature 1 | 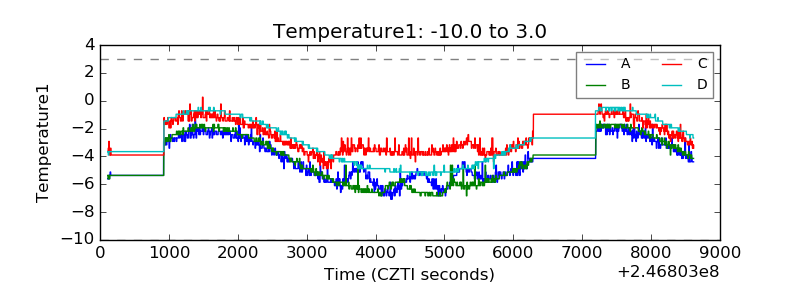 |
| Veto HV Monitor | 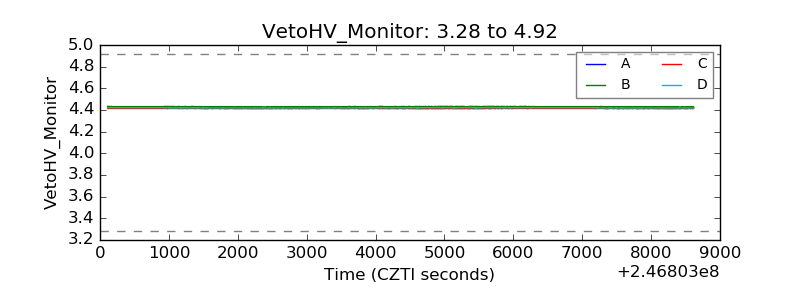 |
| Veto LLD | 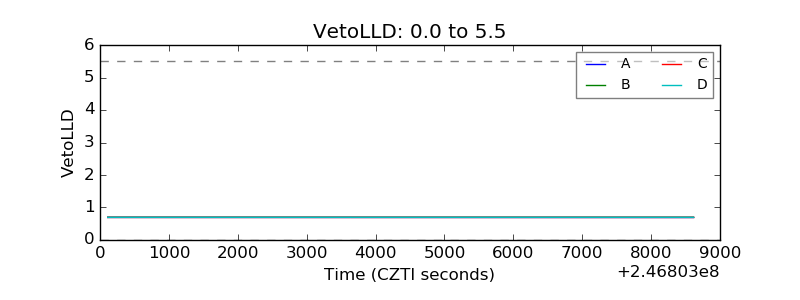 |
| Alpha Counter | 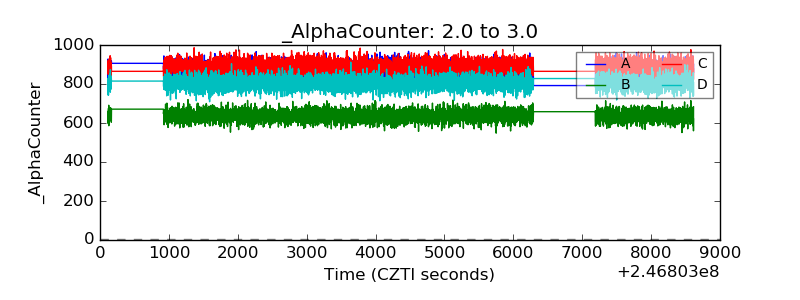 |
| _CPM_Rate | 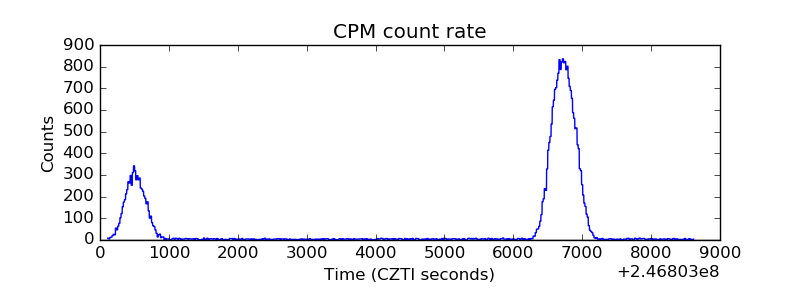 |
| CZT Counter | 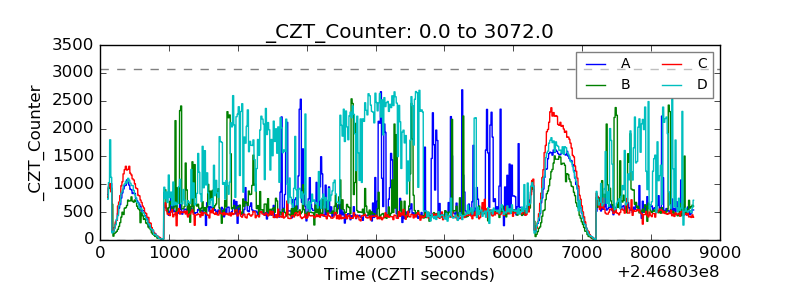 |
| +2.5 Volts monitor |  |
| +5 Volts monitor |  |
| _ROLL_ROT | 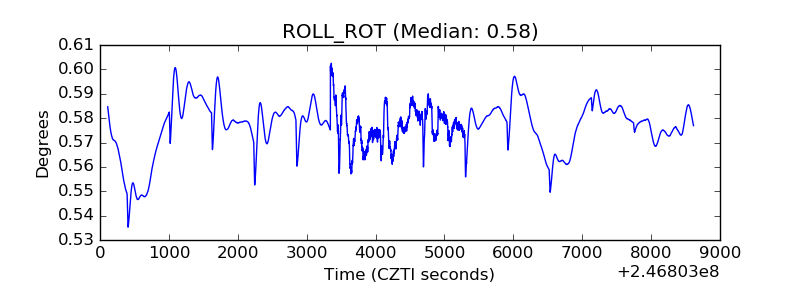 |
| _Roll_DEC | 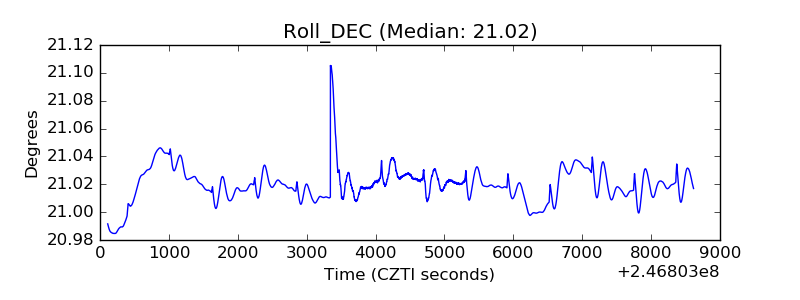 |
| _Roll_RA | 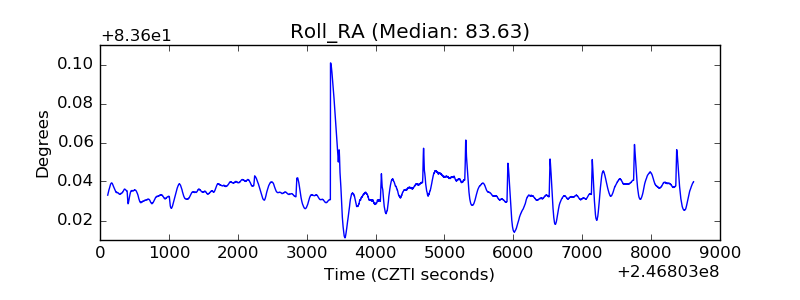 |
| Veto Counter | 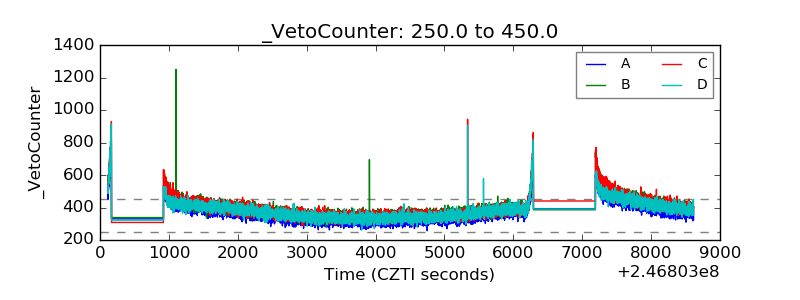 |